
Business Travel Rail Emissions Calculator | Scope 3 Cat 6
Compute UK business-travel rail emissions per passenger-kilometre — national rail, international rail, light rail & tram, and London Underground — on DEFRA 2026 conversion factors, in CO₂e on an AR5 GWP-100 basis, with a separate well-to-tank companion line.
One factor per passenger-kilometre. Rail emissions are an activity-data problem, not a modelling one. The calculator multiplies the distance each traveller covers on each rail mode by that mode’s published DEFRA 2026 emission factor, expressed in kilograms of CO₂e per passenger-kilometre, and sums the legs. There is no decay model, no load-factor input to set, no fuel-burn curve — DEFRA has already done that work and published a single weighted factor per mode. The accuracy of your result is the accuracy of your passenger-kilometres.
Tank-to-wheel is the headline; well-to-tank is the companion. The factor the calculator reports as your Category 6 number is the tank-to-wheel (traction) intensity — the emissions from running the train, matching the published DEFRA headline factor byte-for-byte. Each mode also carries a well-to-tank companion: the upstream emissions of producing and distributing the electricity or diesel before it reaches the train. Well-to-tank is shown as a separate, clearly-labelled line, with a display toggle to fold it into the Category 6 total. The default is to show it separately, so the headline always reconciles to the published DEFRA traction factor.
Well-to-tank here is Category 6 — never Category 3. This is the single most-confused point in business-travel accounting. The upstream energy of third-party business travel is a recommended addition within Category 6, not a Category 3 line. Category 3 (fuel- and energy-related activities) covers only the upstream of a company’s own Scope 1 and Scope 2 energy — the well-to-tank of fuel you burn and electricity you buy. The well-to-tank of a train someone else operates on your behalf belongs to the travel activity that caused it, which is Category 6. Booking rail-travel well-to-tank into Category 3 double-counts the boundary and misstates both categories.
The four rail modes and their factors. DEFRA publishes a distinct AR5 GWP-100 factor for each UK rail mode, in kg CO₂e per passenger-km: national rail 0.03092, international rail (Eurostar) 0.01135, light rail and tram 0.02121, and London Underground 0.01549. International rail sits roughly three times below national rail — not an error, but a direct consequence of Eurostar drawing largely on France’s low-carbon electricity grid. Each factor is a single weighted value; the per-gas CO₂, CH₄, and N₂O composition is preserved in the tool’s audit trail with DEFRA cell references, but methane and nitrous oxide together are under one percent of the rail factor, which is why the AR5 basis is fixed and immaterial to drift.
UK networks only. These are UK DEFRA factors and are valid for travel on the UK rail network only (international rail covers the Eurostar service from the UK). They are not appropriate for rail travel on networks in other countries, whose grid mix and rolling stock differ. The tool surfaces this as its leading insight.
GWP basis. Emissions convert to CO₂e on the IPCC AR5 GWP-100 basis, the DEFRA convention. There is no AR6 toggle on this calculator: DEFRA publishes its 2026 rail factors as single AR5-weighted values, and reweighting them to AR6 would produce a number that no longer matches any published DEFRA factor — breaking the source-traceability an audit-grade tool depends on. Where this matters is reconciliation: if you compare this calculator against a tool that reports on AR6, expect a difference of well under a tenth of a percent on rail, because rail’s non-CO₂ share is so small.
Category boundary. This calculator covers rail legs of employee business travel under GHG Protocol Scope 3 Category 6. Air travel is a separate calculator (radiative forcing applies there, not to rail). Private and hire car business travel, hotel nights, and employee commuting are each their own Category 6 or Category 7 line — see the companions below. Collection of the traveller is not in scope; this is passenger travel, not freight.
Rail distance is route (track) distance, not straight-line.
Default headlines tank-to-wheel; WTT shown as its own line.
Audit mode exposes the full calculation chain + gas split.
Build a journey leg-by-leg. Pick a common journey to auto-fill an approximate route distance, or type your own (use the distance from your ticket or timetable). Each leg is calculated independently and summed.
-
Leg 1
Enter a distance greater than zero.
Doubles distance for this leg
Already have totals from a travel-management company or expense system? Enter total passenger-kilometres per rail mode (distance × travellers, summed over the period). Leave a mode blank if it doesn’t apply.
Enter a non-negative number.
Enter a non-negative number.
Enter a non-negative number.
Enter a non-negative number.
Roll up a full quarter or year of rail travel from a single CSV. Parsing is fully client-side — your data never leaves your browser.
CSV schema (click to expand)
Required: mode and one of distance_km / distance / passenger_km. Optional: travellers (default 1), return (Y/N, default N), label.
mode accepts: national_rail, international_rail, light_rail_tram, london_underground (and common aliases: rail, eurostar, tram, tube…). If passenger_km is given it is used directly (no travellers/return multiplication). A bare distance column uses the Distance-unit toggle above; distance_km is always kilometres.
Drop a CSV file here or .
Or paste CSV text below.
For one journey, see the same passenger-kilometres by rail versus coach, car, taxi, and domestic flight — and the carbon avoided by choosing rail. The decision tool for travel policy.
Enter a distance greater than zero.
Enter a distance greater than zero.
Enter a journey above to calculate
Results appear instantly. Per-mode breakdown, well-to-tank companion, mode-shift comparison, and a full audit trail with DEFRA cell references all available after calculation.
Results are indicative, intended for screening and order-of-magnitude estimates. Factors are UK DEFRA 2026 (AR5 GWP-100), expressed per passenger-kilometre; they are not valid for non-UK rail networks. For CDP, SECR, CSRD, or other regulatory submissions, validate factors against the primary DEFRA dataset, confirm route distances against your travel records, and document your full Scope 3 Category 6 inventory boundary. Well-to-tank emissions are reported as a recommended addition within Category 6 per the GHG Protocol, not as Category 3.
Two colleagues travel London to Edinburgh and back on the same day. One takes the train; one takes the domestic flight. The distance is near-identical. The carbon is not — the flight carries more than seven times the emissions of the rail journey.
In business travel, the mode is the number — the distance is just the multiplier.
UK business-travel rail emissions are passenger-kilometres times a DEFRA 2026 factor: national rail 0.03092, international rail 0.01135, tram 0.02121, Underground 0.01549 kg CO₂e/passenger-km, on an AR5 basis. The traction figure is your Scope 3 Category 6 headline.

What the Rail calculator covers — UK rail, Category 6
This calculator computes the rail legs of Scope 3 Category 6 business travel for the UK network. You enter passenger-kilometres on each rail mode — national rail, international rail, light rail and tram, or London Underground — and the engine multiplies each by its DEFRA 2026 emission factor, reporting a per-mode breakdown, a Category 6 traction total, and a separate well-to-tank companion. It is a distance-based calculation on published per-passenger-km factors, not a fuel-burn or load-factor model.
The four UK rail modes
DEFRA publishes a separate factor for each mode because the energy behind each differs. National rail is the intercity and regional network, a mix of electric and diesel traction. International rail is the Eurostar service, predominantly electric and drawing heavily on the French grid. Light rail and tram covers systems such as Manchester Metrolink and the Sheffield Supertram. London Underground is metered separately again. The calculator carries all four; you enter the distance on each that applies to your travel.
UK networks only — the leading guardrail
These factors are UK DEFRA values and are valid for the UK rail network only. International rail here means the Eurostar service operating from the UK — it is not a generic “any international train” factor. Applying the UK national-rail factor to rail travel in, say, Germany, India, or the United States would be wrong, because those networks run different traction mixes on different grids. If your travellers use overseas rail, those legs need country-appropriate factors and do not belong in this tool.
Business travel, not commuting — Category 6 versus Category 7
Rail used for business travel — a trip between sites, to a client, to a conference — is Category 6. Rail used by employees to get to and from their usual workplace is commuting, which is Category 7, a separate inventory line and a separate calculator. The DEFRA rail factors are near-identical across the two uses, which is exactly why the categories are easy to conflate. The boundary is the purpose of the journey, not the mode: the same train on the same line is Category 6 if it is a business trip and Category 7 if it is the daily commute.
Mode boundary — what’s in, what’s a separate calculator
| Covered in this calculator | Out of scope — separate calculator or category |
|---|---|
| Four UK rail modes — national rail, international rail (Eurostar), light rail & tram, London Underground — each on its DEFRA 2026 passenger-km factor | Air travel, where radiative forcing applies — see the Business Travel Air Calculator |
| The tank-to-wheel traction headline plus a separately-labelled well-to-tank companion, both within Category 6 | Private and hire car business travel, on per-km vehicle factors — a separate Category 6 line (see the private/hire car methodology) |
| A mixed multi-mode UK rail itinerary, with a per-mode breakdown and a mode-shift comparison view | Hotel nights on the same trip — Category 6, but a different functional unit: see the Hotel Stay Calculator |
| UK-network rail only, on UK DEFRA factors, AR5 GWP-100 | Employee commuting and work-from-home — Scope 3 Category 7, not Category 6 (employee commuting and WFH methodology) |
The purpose of the journey decides the category, not the mode. A train trip to a client site is Category 6 business travel; the same employee’s daily train to the office is Category 7 commuting. The DEFRA rail factors are nearly the same for both, so the distinction lives in your activity data — how you classify the trip — not in the calculator’s arithmetic.
Tank-to-wheel and well-to-tank — the Category 6 boundary
Every rail factor has two layers, and getting them in the right place is what separates a defensible Category 6 line from a misstated one. The calculator reports both, keeps them labelled, and puts each where the GHG Protocol intends it.
Tank-to-wheel — the DEFRA-matching headline
Tank-to-wheel is the emission of moving the train: the electricity drawn from the wire or the diesel burned in the engine, converted to CO₂e. This is the number the calculator reports as your Category 6 headline, and it matches the published DEFRA traction factor for each mode exactly. When you reconcile this tool against DEFRA’s own conversion-factor workbook, the traction line is what ties out.
Well-to-tank — the recommended companion
Well-to-tank is everything upstream of the train: extracting, refining, and distributing the diesel, or generating and transmitting the electricity, before any of it reaches the traction system. It is a real emission and the GHG Protocol recommends including it. The calculator shows it as a separate, labelled line with a toggle to fold it into the Category 6 total; the default keeps it separate so the headline always reconciles to the published DEFRA traction factor. Folding it in raises your reported Category 6 figure — correctly — but you should do so knowingly, and disclose that your Category 6 total is traction-plus-upstream rather than traction-only.
Category 6 emission (kg) = Σ (passenger-kmmode × DEFRA factormode)
Traction headline uses the tank-to-wheel factor; the well-to-tank companion is added only when the fold-in toggle is set.
Why rail well-to-tank is Category 6, never Category 3
This is the page’s most important correctness point. The well-to-tank of business-travel rail is a recommended addition within Category 6 — it is not a Category 3 line. Category 3 (fuel- and energy-related activities) is defined narrowly: it captures the upstream emissions of the fuel and electricity a company consumes in its own Scope 1 and Scope 2 activities — the well-to-tank of the diesel in your own vans, the transmission losses on the grid power you buy. A train operated by a third party on your behalf is not your Scope 1 or Scope 2 energy; its upstream belongs to the travel that caused it. That makes it Category 6, alongside the traction. Routing rail well-to-tank into Category 3 splits one activity across two categories and misstates both.
Do not file business-travel rail well-to-tank under Category 3. Category 3 is for the upstream of your own Scope 1 and Scope 2 energy only. The upstream energy of a third-party train you travel on is part of the travel activity — it stays in Category 6, as a companion to the traction figure. Misfiling it into Category 3 is one of the most common Scope 3 boundary errors, and an assurance provider will flag it because it double-counts the boundary definition.
For the contrast — what Category 3 well-to-tank actually does cover — see the well-to-tank methodology, which handles the upstream of your own combusted fuel and purchased electricity. The distinction between that page’s scope and this one’s is precisely the boundary line described above.
Why international rail is far lower than national rail
The first thing most users notice is that international rail carries roughly a third of the emissions of national rail — 0.01135 against 0.03092 kg CO₂e per passenger-km. The gap is real — and it narrowed sharply in the DEFRA 2026 release.
The Eurostar grid effect
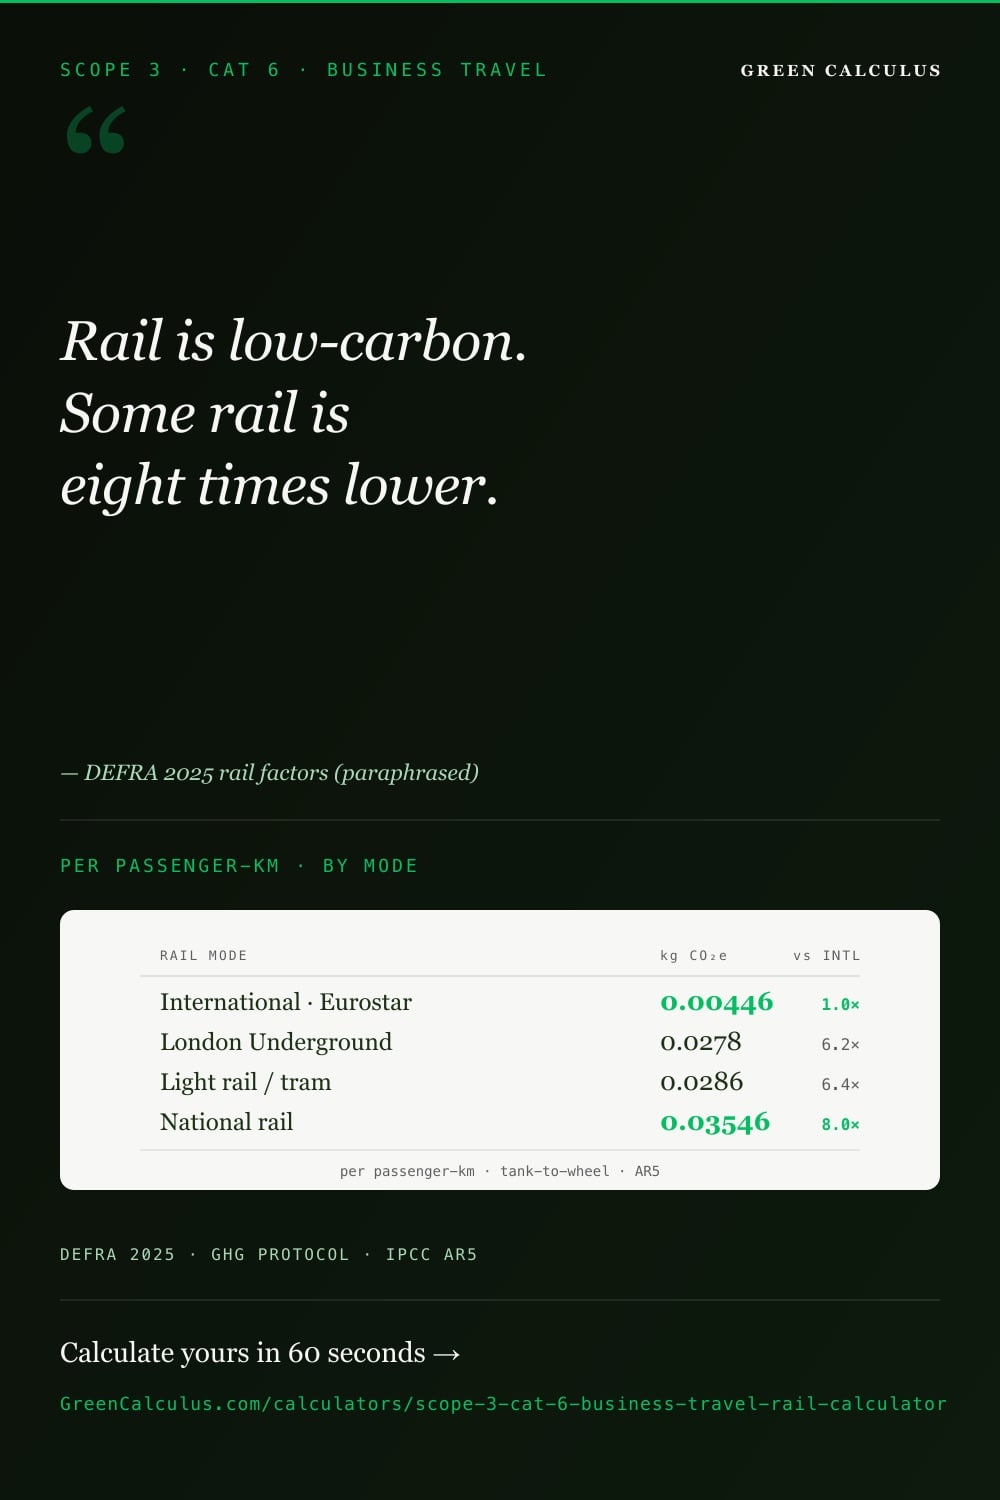
International rail in the DEFRA dataset is the Eurostar service, which runs predominantly on electric traction drawing heavily on the French electricity grid. France generates the large majority of its power from nuclear and renewables, so the carbon intensity of each kilowatt-hour pulling a Eurostar train is far below the UK average. National rail, by contrast, is a UK-network blend that still includes diesel traction on unelectrified lines and draws its electric portion from the higher-carbon UK grid. The gap is the grid behind the train, not a difference in how trains work. It is narrower than it once was: the DEFRA 2026 release revised the international-rail factor upward from 0.00446 to 0.01135 kg CO₂e per passenger-km, taking the national-to-international ratio from roughly eightfold to roughly threefold.
The rail mode-intensity ladder
The chart below ranks the four UK rail modes by their DEFRA 2026 traction factor. International rail sits at the floor; national rail tops the ladder; Underground and tram sit in between. All four remain well below car, taxi, or flight on the same journey — the comparison the next section makes explicit.
DEFRA 2026 conversion factors, AR5 GWP-100, kg CO₂e per passenger-kilometre, tank-to-wheel (traction) basis, UK network. Bars scaled to national rail = 100%. International rail is the Eurostar service on the predominantly low-carbon French grid; the gap is the electricity mix, not the rolling stock. These are headline traction figures; the well-to-tank companion sits on top of each and is computed live in the calculator.
International rail being roughly three times lower than national rail is correct, not a bug. Eurostar runs largely on France’s low-carbon electricity, so each passenger-kilometre carries far less embedded grid carbon. If you see that gap in your output, it is the calculator working as intended — the carbon of electric rail tracks the grid that powers it.
How each rail mode is modelled — passenger-km to CO₂e
Each mode runs the same one-line calculation: passenger-kilometres on that mode, multiplied by that mode’s DEFRA factor, summed into the Category 6 total. The difference between modes is entirely in the factor, which DEFRA has pre-weighted from the traction mix and ridership of each network.
National rail
The intercity and regional network at 0.03092 kg CO₂e/pkm — the highest UK rail factor, reflecting a mixed electric-and-diesel traction blend on the UK grid. The trap: applying it to overseas rail, where it does not hold.
International rail (Eurostar)
0.01135 kg CO₂e/pkm — the lowest, on France’s low-carbon grid. The trap: reading the ~3× gap below national rail as an error and “correcting” it.
Light rail & tram
0.02121 kg CO₂e/pkm — systems such as Metrolink and Supertram. The trap: folding tram distance into national rail rather than entering it on its own, lower-than-it-looks factor.
London Underground
0.01549 kg CO₂e/pkm — metered separately from national rail. The trap: treating Underground legs as national rail, which roughly doubles them and loses the audit trail.
The role of passenger-kilometres
Because the factor is fixed per mode, the entire accuracy of a rail line rests on the passenger-kilometres. A passenger-kilometre is one traveller carried one kilometre: a single employee on a 650 km return London–Edinburgh trip contributes 650 passenger-km, and two employees on the same trip contribute 1,300. Distance can come from booking systems, expense-claim mileage, or station-to-station rail-distance lookups; whichever source you use, the calculator treats the number as entered and converts it. Resolving the distance correctly is where the work is — the conversion is trivial.
The abatement lever for rail business travel is mode shift, not factor optimisation. You cannot make a national-rail kilometre much cleaner, but you can move journeys onto rail from higher-carbon modes — and, where the route allows, onto Eurostar rather than a short-haul flight. The mode-shift comparison below quantifies the gap; it is the single most useful view for a travel-policy decision.
GWP basis and the DEFRA convention
Rail is almost entirely a CO₂ story, which is why its global-warming-potential treatment is simple and why this calculator does not offer the AR5/AR6 toggle some of its siblings carry.
Why there is no AR6 toggle
DEFRA publishes its 2026 rail factors as single AR5 GWP-100 weighted values, in CO₂e per passenger-kilometre. Methane and nitrous oxide together make up under one percent of a rail factor, so the difference between converting on AR5 and on AR6 is well under a tenth of a percent — immaterial. More importantly, reweighting the published factor to AR6 from its per-gas components would produce a number that no longer matches any DEFRA-published figure, breaking the source-traceability that makes the tool audit-grade. So the calculator stays on AR5, the DEFRA convention, with no GWP mode to choose. The per-gas CO₂, CH₄, and N₂O split is preserved in the tool’s audit trail with DEFRA cell references, as a transparency feature — but it is fixed, not a selectable basis.
What this means for reconciliation
If you compare this calculator against another tool or a prior inventory, the global warming potential basis is unlikely to be the source of any discrepancy on rail — the non-CO₂ share is too small for AR5-versus-AR6 to matter. Differences will almost always come from the activity data: different passenger-kilometres, a different split across modes, or one tool including well-to-tank where the other reports traction only. Check those before suspecting the GWP basis.
The most likely cause of two rail figures disagreeing is the tank-to-wheel versus well-to-tank boundary, not the GWP basis. One tool may report traction only while another folds in well-to-tank, producing a higher number for the same journey. Before reconciling, confirm both figures are on the same boundary — traction-only or traction-plus-upstream — and that neither has misfiled the upstream into Category 3.
Worked example — a four-leg UK rail itinerary
This example runs a mixed four-leg UK itinerary across all four rail modes, on the tank-to-wheel headline basis. Each leg is passenger-kilometres times the mode factor; the legs sum to the Category 6 traction total. All figures are on the DEFRA 2026 AR5 basis and the arithmetic reconciles to five decimal places.
Four legs, tank-to-wheel headline
| Leg | Mode | Passenger-km | Factor (kg CO₂e/pkm) | Traction (kg CO₂e) |
|---|---|---|---|---|
| London → Edinburgh, return, one traveller | National rail | 1,320 | 0.03092 | 40.81440 |
| London → Paris, return, one traveller | International rail (Eurostar) | 690 | 0.01135 | 7.83150 |
| Manchester tram, one working day | Light rail & tram | 60 | 0.02121 | 1.27260 |
| London Underground, one working week | London Underground | 110 | 0.01549 | 1.70390 |
| Itinerary total | mixed | 2,180 | — | 51.62240 |
DEFRA 2026, AR5 GWP-100, tank-to-wheel (traction). Worked arithmetic: national rail 1,320 × 0.03092 = 40.81440 kg; international rail 690 × 0.01135 = 7.83150 kg; tram 60 × 0.02121 = 1.27260 kg; Underground 110 × 0.01549 = 1.70390 kg; total 51.62240 kg = 0.051622 tCO₂e. Passenger-km are illustrative round-trip distances for one traveller. The well-to-tank companion sits on top of this traction total and is computed live in the calculator from each mode’s upstream factor.
The lesson in the table is that the Category 6 rail figure concentrates in the long intercity legs. The 1,320 passenger-km national-rail trip carries 79% of this itinerary’s traction emissions; the tram and Underground legs, despite being everyday travel, are almost rounding lines against it. When you build a real inventory, the data-quality effort belongs on the long-distance legs, where a passenger-kilometre error moves the total — not on the short urban hops.
Weight your data-quality effort by passenger-kilometres, not by trip count. A handful of long intercity journeys will dominate a rail inventory, while dozens of short tram and Underground legs barely register. Get the booking-system distances right for the long hauls first; estimate the urban legs if you must. Run your real distances through the calculator and watch which one or two legs carry the total.
Mode-shift comparison — rail versus coach, car, taxi, flight
The calculator’s comparison view takes a single journey and shows it across modes, so a travel-policy decision can be made against carbon as well as cost and time. The comparison is a decision aid — only the rail legs are reportable Category 6 lines on this page; the other bars are fixed reference values.
The same journey, five ways
The table below takes the 1,320 passenger-km London–Edinburgh return and prices it across modes on their DEFRA 2026 factors. Rail sits at the floor, with coach now just above it; car and taxi are several times higher; the domestic flight, carried at DEFRA’s with-radiative-forcing factor, tops the table at more than seven times the rail figure.
| Mode (1,320 passenger-km) | Factor (kg CO₂e/pkm) | Journey (kg CO₂e) | Versus national rail |
|---|---|---|---|
| National rail | 0.03092 | 40.81 | 1.0× (reference) |
| Coach | 0.03948 | 52.11 | 1.3× |
| Car (average diesel, single occupant) | 0.17265 | 227.90 | 5.6× |
| Taxi (black cab) | 0.20402 | 269.31 | 6.6× |
| Domestic flight (with radiative forcing) | 0.22928 | 302.65 | 7.4× |
DEFRA 2026, AR5 GWP-100, kg CO₂e per passenger-km. Rail and coach are tank-to-wheel; the flight bar uses DEFRA’s domestic-average with-radiative-forcing factor (0.22928) as a realistic comparison reference. Car is the average diesel car at single occupancy; sharing the car lowers its per-passenger figure. Only rail legs are reportable Category 6 lines in this calculator — the coach, car, taxi, and flight bars are fixed comparison references, not reportable air- or road-travel lines. Flight comparison uses the with-RF domestic factor.
The flight bar in the comparison uses DEFRA’s with-radiative-forcing domestic factor as a realistic reference — radiative forcing is an aviation effect and has no meaning for rail. The flight figure here is a fixed comparison value to inform a mode-shift decision; it is not a reportable air-travel line on this calculator. To account air travel properly, use the dedicated air calculator, where the radiative-forcing treatment is the central methodological choice.
Data quality and the activity-data hierarchy
Because rail factors are fixed and published, data quality on a rail inventory is almost entirely a question of how good your passenger-kilometres are and whether each leg is assigned to the right mode. The reporting expectation is to use the most specific distance data available and to resolve generic “rail travel” spend into actual mode and distance where the emissions are material.
| Tier | Distance & mode data | Typical source |
|---|---|---|
| Primary / measured | Actual passenger-kilometres per mode, per traveller, from booking records with origin–destination pairs resolved to rail distance | Travel-management-company booking data, rail-operator records |
| Primary activity + estimated distance | Known trips and modes with station-to-station distances looked up rather than metered | Expense claims with route detail, rail-distance lookups |
| Default / proxy | Rail spend converted to distance via an average fare, or an undifferentiated “rail” line with an assumed mode split | Finance-system spend categories, average-fare proxies |
The highest-value improvement for most rail inventories is resolving an undifferentiated “rail travel” spend line into mode and distance. A spend-to-distance proxy cannot tell a low-carbon Eurostar leg from a national-rail intercity trip, and it cannot separate business travel from anything miscoded into the same category. Booking-system distances by mode remove both problems at once. The honest disclosure names which legs rest on measured passenger-kilometres and which on a spend proxy.
Audit checklist — what gets flagged in Cat 6 rail assurance
Rail is one of the simpler Category 6 lines to assure, but the same handful of findings recur. Each traces back to either a boundary error or an activity-data gap rather than to the arithmetic, which is rarely where rail goes wrong.
01 — Well-to-tank filed under Category 3
Booking rail-travel upstream energy into Category 3 instead of keeping it in Category 6. Category 3 is for your own Scope 1 and 2 energy upstream only. Keep third-party travel well-to-tank in Category 6, beside the traction.
02 — Commuting counted as business travel
Pulling employees’ daily rail commute into Category 6. Commuting is Category 7. Confirm the journey purpose before assigning the leg, and route commute distance to the commuting inventory.
03 — Overseas rail on UK factors
Applying UK DEFRA rail factors to travel on non-UK networks. The factors are UK-only. Overseas rail legs need country-appropriate factors and should be excluded from this tool.
04 — Mode collapsed to a single factor
Treating all rail as national rail, losing the lower tram, Underground, and Eurostar factors. Split the activity data by mode so each leg uses its own published factor.
05 — Boundary undisclosed in the total
Reporting a Category 6 rail total without stating whether it is traction-only or traction-plus-well-to-tank. Disclose the boundary; an undocumented fold-in is not reconcilable against the DEFRA traction factor.
06 — Spend proxy left unresolved on material legs
Leaving a large rail line on a spend-to-distance proxy when booking data exists. Resolve material legs to measured passenger-kilometres by mode; reserve the proxy for immaterial residual travel.
Reporting context — Scope 3, IFRS S2, CSRD E1, SECR
Category 6 business travel feeds the same disclosure regimes as the rest of the Scope 3 inventory, and rail travel is one of the more readily-measured lines within it. The rows below cover the disclosure surface a travel-reporting company navigates.
| Framework | Role for Category 6 rail emissions | Disclosure cadence |
|---|---|---|
| GHG Protocol Scope 3 Standard | The accounting standard. Defines Category 6 (business travel) and the distance-based method this calculator uses, and recommends including well-to-tank within the category. | Same as the company’s reporting cycle |
| UK DEFRA Conversion Factors | The factor source for every rail mode — the AR5 GWP-100 passenger-km traction factors and their well-to-tank companions. | Annual refresh (each DEFRA release) |
| IFRS S2 (ISSB) | The global disclosure baseline. Requires Scope 3 disclosure including business travel where material, with the calculation methodology disclosed. | Annual, aligned with financial statements |
| CSRD ESRS E1 (EU) | The EU climate standard. ESRS E1 carries Scope 3 business-travel emissions in CO₂e as part of the gross Scope 3 total. | Annual sustainability statement |
| UK SECR | UK Streamlined Energy and Carbon Reporting. Business travel in employee-owned or company vehicles is in scope; rail business travel is commonly reported alongside as a voluntary Scope 3 line. | Annual, with the directors’ report |
For the reporting mechanics, the disclosure-framework methodologies set out how a Category 6 rail figure flows into each return: the IFRS S2 disclosure methodology, the CSRD ESRS E1 methodology, and the UK SECR methodology. The common thread is that all three want the activity basis and the boundary disclosed — which is why keeping traction and well-to-tank labelled, and keeping the upstream in Category 6, matters beyond the number itself.
Data sources, factors, and GWP basis
The factors — source and structure
The rail factors are the DEFRA 2026 UK Government greenhouse gas conversion factors for business travel by rail, retrieved for the MasterBrain factor set: national rail, international rail, light rail and tram, and London Underground, each as a single weighted value in kg CO₂e per passenger-kilometre on the tank-to-wheel basis, with a well-to-tank companion. These are the same factors used across UK corporate reporting. There are no GLEC tonne-kilometre freight factors here — this is passenger travel, metered per passenger-km, not freight metered per tonne-km. The full DEFRA tables sit in the DEFRA emission factors reference and the business travel and freight logistics factors reference.
GWP basis — source and convention
Conversion to CO₂e is on the IPCC AR5 GWP-100 basis, the DEFRA convention for its published factors. This calculator exposes no AR6 alternative, by design: the rail factors are published as AR5-weighted values, and rail’s non-CO₂ share is under one percent, so an AR6 reweighting would be both immaterial and untraceable to source. For background on how the assessment-report bases differ, see the global warming potential definition and the AR6 GWP values reference. The per-gas composition behind each rail factor is preserved in the tool’s audit trail with DEFRA cell references, fixed at AR5.
Versioning and update cadence
DEFRA refreshes its conversion factors annually, so the rail factors update with each release; the MasterBrain version against which a result was computed is stamped on the output, so a figure computed against one DEFRA vintage and the same figure recomputed against a later one are distinguishable in restatement work. The GWP basis is stable between IPCC assessment reports. The paired methodology page documents the distance-based method and the tank-to-wheel and well-to-tank treatment in full.
What’s next — completing your Category 6 inventory
Rail is one mode of business travel. A complete Category 6 picture usually draws on the air, car, and hotel companions, and a complete travel-and-commuting picture adds the Category 7 commuting line. The calculators below cover the rest of the surface.
Live
Business Travel & Rail
UK rail business travel — national, international, tram, and Underground. The calculator on this page.
Live
Business Travel Air
The air companion — short-haul, long-haul, and domestic flights, with the radiative-forcing treatment that does not apply to rail.
Live
Hotel Stay
The Category 6 accommodation line — room-nights by country and hotel class, on DEFRA and Cornell HCMI factors.
Companion
Private & hire car business travel
The car leg of Category 6, on per-km vehicle factors — see the private/hire car methodology for the approach.
Live
GHG Inventory Aggregator
Roll Category 6 together with every other Scope 1, 2 and 3 source into one auditable corporate carbon footprint — the organisation-level inventory this category feeds into.
Live
Cat 7 Employee Commuting & WFH
Your workforce’s daily commute and home-working energy — the employee counterpart to business travel.
Live
Cat 6 Business Travel — Air, Hotel & Car
Air, hotel and car business-travel emissions combined on a single worked itinerary.
For the full methodological treatment — the distance-based method, the tank-to-wheel and well-to-tank factors, the Category 6 boundary, and the AR5 GWP handling — see the related business-travel methodologies: the business travel air emissions methodology for the air leg, the business travel car methodology for private and hire car, and the employee commuting and work-from-home methodology for the Category 7 boundary that sits next to this one. For what Category 3 well-to-tank actually covers — and why rail-travel upstream is not it — see the well-to-tank methodology.
Frequently asked questions
Yes. Employee business travel by rail is Scope 3 Category 6. It covers journeys for business purposes — to client sites, between offices, to conferences — on third-party transport. It is distinct from employee commuting, which is Scope 3 Category 7, even though both can use the same train on the same line. The difference is the purpose of the journey, not the mode.
Four UK rail modes: national rail, international rail (the Eurostar service), light rail and tram, and London Underground. Each uses its own DEFRA 2026 factor in kg CO₂e per passenger-kilometre. The calculator is for the UK network only — these factors are not valid for rail travel in other countries, whose grid mix and rolling stock differ.
International rail (Eurostar) is roughly three times lower than national rail — 0.01135 against 0.03092 kg CO₂e per passenger-km — because Eurostar runs predominantly on electric traction drawing heavily on France’s low-carbon electricity grid. National rail is a UK-network blend that still includes diesel traction and draws its electric portion from the higher-carbon UK grid. The gap is the grid behind the train, not a difference in the trains themselves. It is correct, not a data error.
Tank-to-wheel is the emission of running the train — the electricity or diesel the traction system consumes. It is the Category 6 headline and matches the published DEFRA factor. Well-to-tank is everything upstream: producing and distributing that energy before it reaches the train. The calculator reports tank-to-wheel as the headline and well-to-tank as a separate companion line, with a toggle to fold it into the total. The default keeps them separate so the headline reconciles to DEFRA’s published traction factor.
Category 6. The well-to-tank of business-travel rail is a recommended addition within Category 6, beside the traction figure. Category 3 (fuel- and energy-related activities) covers only the upstream of a company’s own Scope 1 and Scope 2 energy — the fuel you burn and the electricity you buy. A third-party train you travel on is not your own energy, so its upstream belongs to the travel activity, which is Category 6. Filing it into Category 3 double-counts the boundary and is a common assurance finding.
AR5 GWP-100, the DEFRA convention, with no AR6 toggle. DEFRA publishes its rail factors as single AR5-weighted values, and rail’s methane and nitrous-oxide share is under one percent of the factor — so the AR5-versus-AR6 difference is well under a tenth of a percent, immaterial. Reweighting to AR6 would also break traceability to the published DEFRA figure, which is why the calculator stays on the published basis.
For a London–Edinburgh return of about 1,320 passenger-km, national rail emits roughly 41 kg CO₂e while a domestic flight, at DEFRA’s with-radiative-forcing factor, emits about 303 kg — more than seven times as much. Coach now sits slightly above rail; a single-occupant diesel car is more than five times rail; a taxi over six times. Sharing a car lowers its per-passenger figure. In the calculator, only rail legs are reportable Category 6 lines; the other modes appear as fixed comparison references.
No. These are UK DEFRA factors, valid for the UK rail network only. International rail here means the Eurostar service from the UK, not a generic international-train factor. Rail travel on networks in other countries runs different traction mixes on different electricity grids, so it needs country-appropriate factors and should not be entered into this tool.
Yes, for accounting purposes. Rail used for business travel — a trip to a client, between sites, to an event — is Scope 3 Category 6. Rail used by employees to get to and from their normal workplace is commuting, which is Scope 3 Category 7, a separate inventory line. The DEFRA factors are nearly identical, so the distinction lives in how you classify the journey, not in the calculation.
Passenger-kilometres by mode — one traveller carried one kilometre is one passenger-km. The best source is travel-management-company booking data with origin–destination pairs resolved to rail distance; expense claims with route detail are a reasonable second. A spend-to-distance proxy is the fallback, but it cannot tell a low-carbon Eurostar leg from a national-rail trip, so resolve material legs to measured distance by mode where you can.
Methodology notes and limitations
Factor source and vintage. The rail factors implement the DEFRA 2026 UK Government greenhouse gas conversion factors for business travel by rail — national rail, international rail, light rail and tram, and London Underground — each as a single weighted value in kg CO₂e per passenger-kilometre, tank-to-wheel, with a well-to-tank companion. GWP conversion is on the IPCC AR5 GWP-100 basis, the DEFRA convention. There is no AR6 toggle; the published factors are AR5-weighted and rail’s non-CO₂ share is immaterial to the basis.
Tank-to-wheel is the headline; well-to-tank is a labelled companion. The Category 6 figure the calculator headlines is the tank-to-wheel traction emission, matching the published DEFRA factor. Well-to-tank — the upstream of producing and distributing the traction energy — is reported as a separate line with a fold-in toggle, defaulting to separate. When folded in, the Category 6 total becomes traction-plus-upstream and should be disclosed as such.
Rail well-to-tank is Category 6, not Category 3. The upstream energy of third-party business-travel rail belongs to the travel activity, within Category 6. Category 3 covers only the upstream of a company’s own Scope 1 and Scope 2 energy. Misfiling rail-travel well-to-tank into Category 3 double-counts the boundary and misstates both categories.
UK networks only. The factors are UK DEFRA values for the UK rail network; international rail is the Eurostar service from the UK. They are not valid for rail travel on networks in other countries. Overseas rail legs require country-appropriate factors and are out of scope for this calculator.
The factor is fixed; accuracy lives in the activity data. Each mode’s factor is a single published value, so the result’s accuracy depends entirely on the passenger-kilometres entered and on assigning each leg to the correct mode. The calculator takes the distances and modes as entered and does not independently verify them; the user is responsible for the activity-data basis and for documenting the source and mode of each leg.
The mode-shift comparison is a decision aid, not a reporting output. The comparison view shows the same journey by coach, car, taxi, and domestic flight alongside rail, using fixed DEFRA reference factors (the flight at DEFRA’s with-radiative-forcing domestic factor). Only rail legs are reportable Category 6 lines on this calculator; the other modes are comparison references and should be accounted on their own dedicated calculators if reported.
No assurance opinion. Results are estimates and do not constitute an assurance opinion. They should be reviewed by a qualified practitioner before use in IFRS S2 disclosures, CSRD ESRS E1 datapoints, UK SECR returns, or other regulatory submissions.