Nitrous Oxide

Most corporate inventories handle CO₂ correctly, treat methane carefully, and quietly under-report nitrous oxide by a factor that would fail any rigorous third-party assurance.
N₂O is the gas auditors flag, verifiers downgrade, and CDP reviewers cite for completeness failures — because the data lives outside finance systems and the calculation rules differ in four separate inventory contexts.
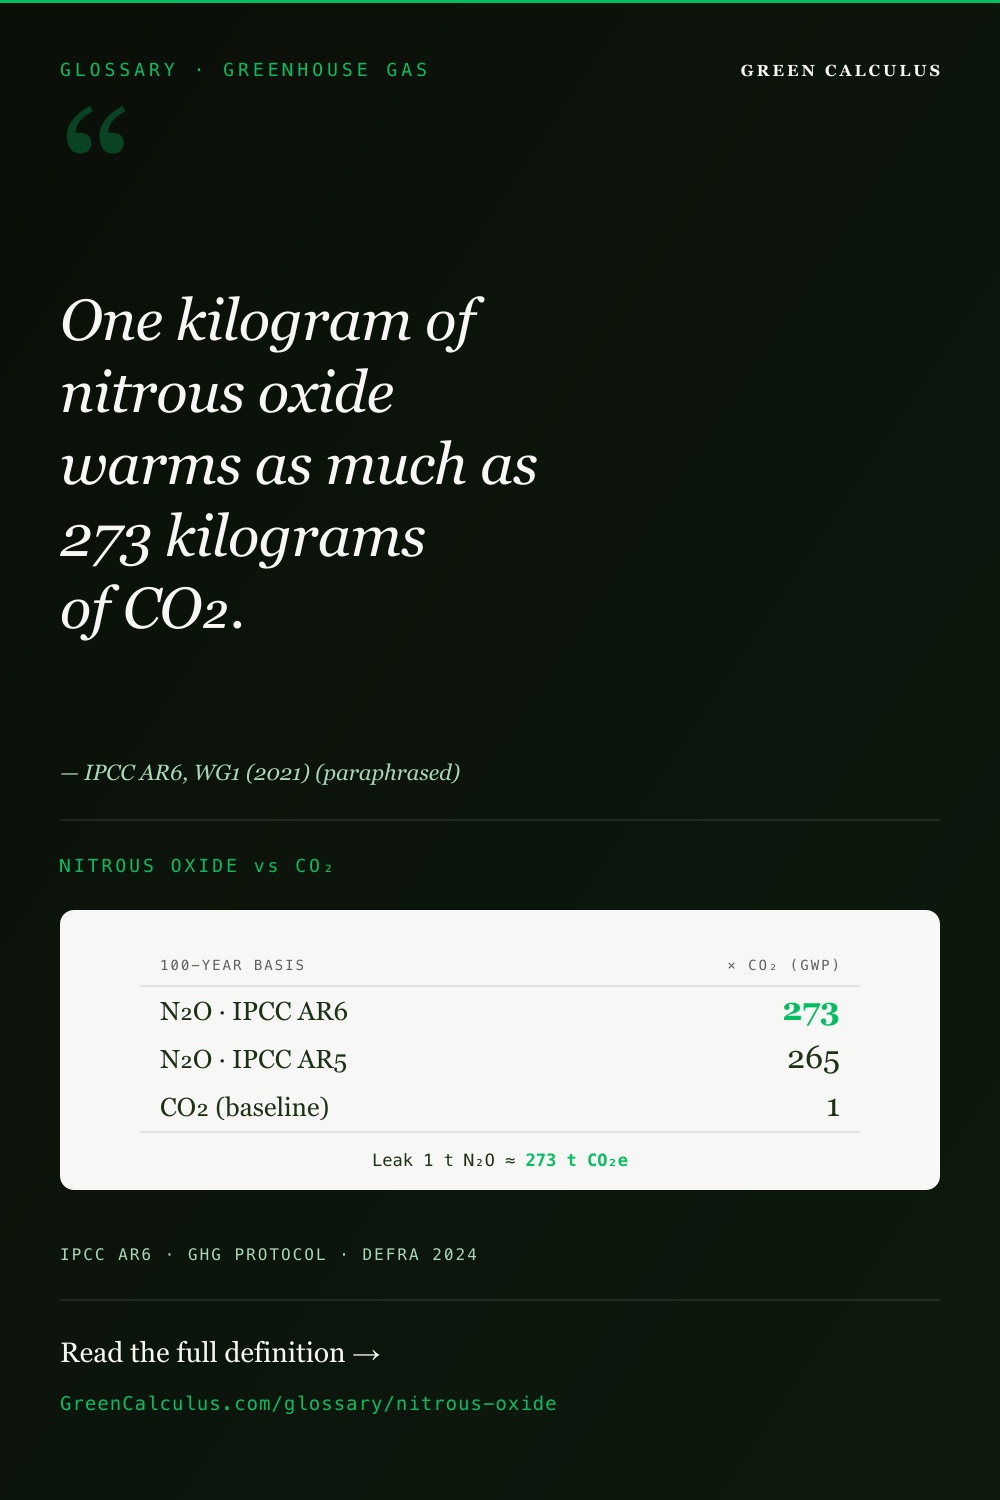
Nitrous oxide (N₂O) is a long-lived greenhouse gas with an atmospheric lifetime of 109 years and an IPCC AR6 GWP-100 of 273 — meaning one tonne of N₂O has the same warming effect as 273 tonnes of CO₂ over a 100-year horizon. Uniquely among major greenhouse gases, its GWP-20 and GWP-100 values are identical (both 273), so the time horizon choice is largely irrelevant for N₂O reporting. It is the third most significant gas in most corporate inventories after CO₂ and methane, and arises from four distinct sources: nitrogen fertiliser application, wastewater treatment, fuel combustion, and industrial chemical production.
Nitrous Oxide — Key Properties at a Glance
Every value in the table below is sourced from IPCC AR6 Working Group I, Table 7.SM.7 (Forster et al., 2021). These values govern all GHG Protocol, CSRD/ESRS E1, CDP, and SBTi corporate reporting from the 2023 cycle onwards.
| Property | Value | Notes |
|---|---|---|
| Chemical formula | N₂O | Two nitrogen atoms, one oxygen atom; CAS 10024-97-2. |
| Atmospheric lifetime | 109 years | Perturbation lifetime; mean lifetime is 116 yr. Removed by stratospheric photolysis. |
| GWP-20 | 273 | Same as GWP-100 — unique among major greenhouse gases. |
| GWP-100 reporting default | 273 | AR6 value. Use for all GHG Protocol, CDP, CSRD, and SBTi reporting. |
| GWP-100 with feedbacks | 296 | Includes climate–carbon cycle feedbacks. Scientific analysis only — not for inventory reporting. |
| GWP-500 | 130 | Long-term horizon. Rarely used in corporate disclosure. |
| AR5 GWP-100 | 265 ⚠ legacy | Replaced by AR6 in CDP (2023 cycle) and SBTi Net-Zero Standard v1.1 (2023). |
| AR5 → AR6 change | +8 (+3.0%) | Material for agricultural, wastewater, and combustion inventories. |
| Primary IPCC source | AR6 WGI Table 7.SM.7 | Stable until IPCC AR7 (~2028). |
Source: IPCC AR6 WGI, Table 7.SM.7, p.7-SM-47 (2021) · See the complete AR6 dataset for all gases →
One tonne of N₂O is equivalent to 273 tonnes of CO₂. A small leak from a nitric acid plant, a slightly over-applied fertiliser regime, or an under-counted wastewater stream each produces a CO₂e total disproportionate to the N₂O mass involved. Verifiers know this — and they look for it.
Why N₂O GWP-20 Equals GWP-100 — A Unique Property
For most greenhouse gases, the choice of GWP time horizon produces dramatically different values. Fossil methane’s GWP-20 of 82.5 is roughly three times its GWP-100 of 29.8 — because methane breaks down within 12 years, the 20-year window captures most of its warming impact while the 100-year average is diluted by the years it is no longer present.
Nitrous oxide is structurally different. With a 109-year atmospheric lifetime, N₂O is still substantially present at both 20 years and 100 years after emission. Applying simple exponential decay (e-t/τ with τ = 109 yr), approximately 83% of the original N₂O remains at year 20 and 40% remains at year 100. Its radiative forcing is therefore spread relatively evenly across the century, producing GWP values that are nearly identical across all reporting horizons.
| Gas | Lifetime | GWP-20 | GWP-100 | GWP-500 | Time horizon effect |
|---|---|---|---|---|---|
| N₂O | 109 yr | 273 | 273 | 130 | GWP-20 = GWP-100. Time horizon choice is irrelevant for N₂O. |
| CH₄ (fossil) | 12 yr | 82.5 | 29.8 | 8.27 | GWP-20 is 2.8× GWP-100. Horizon choice is highly consequential. |
| CH₄ (biogenic) | 12 yr | 79.7 | 27 | 7.45 | Same lifetime as fossil; lower GWP because no fossil-CO₂ tail. |
| CO₂ | Variable | 1 | 1 | 1 | Reference gas — defined as 1 at all horizons by convention. |
| SF₆ (pending) | 3,200 yr | 18,300 | 25200 | 32,600 | GWP increases with horizon — still accumulating warming at 500 years. |
For methane-intensive operations (oil & gas, landfill, livestock), switching between GWP-20 and GWP-100 changes reported CO₂e totals by a factor of three. For N₂O-intensive operations — agricultural businesses, wastewater operators, fertiliser manufacturers, nitric acid producers — switching horizons makes virtually no difference. A farm with 1,000 tonnes of N₂O emissions reports approximately the same CO₂e total at GWP-20 (273,000 tCO₂e) as at GWP-100 (273,000 tCO₂e). One number, one answer, regardless of horizon.
Where N₂O Appears in a Corporate GHG Inventory
Nitrous oxide is unusual among greenhouse gases because it appears in four completely different inventory contexts — and in each context, the calculation method, data source, and scope classification differ. Most inventories handle combustion N₂O correctly (because DEFRA pre-aggregated factors do it automatically) and miss everything else.
Combustion
of fuel CO₂e total. Embedded in DEFRA factors — do not add separately.
Agriculture
kg CO₂e per kg N applied. Largest anthropogenic N₂O source globally.
Wastewater
kg CO₂e per m³ treated. Most-omitted disclosure in office & food sectors.
Industrial process
per tonne. Nitric acid, adipic acid, caprolactam — calculate from production.
1. Combustion N₂O — Stationary and Mobile Sources Scope 1
When any fuel burns — natural gas, diesel, petrol, aviation fuel — a small fraction of the nitrogen in the fuel and combustion air reacts to form N₂O. The quantity is small per unit of energy but accumulates across large energy consumers. The N₂O is emitted as combustion products leave the stack or exhaust.
DEFRA 2025 pre-aggregated CO₂e factors for fuels already embed the N₂O component at GWP-100 = 273. The natural gas factor (0.18290 kg CO₂e/kWh, gross CV basis) includes a small N₂O contribution alongside the dominant CO₂ and the CH₄ slip.
If you use DEFRA CO₂e factors directly, you do not need to calculate N₂O separately — it is already counted. Only calculate N₂O independently if you are building from raw CO₂ + CH₄ + N₂O mass components, in which case apply 273 to the N₂O mass before summing.
Never apply N₂O GWP on top of a DEFRA pre-aggregated CO₂e factor. The N₂O is already in the number. Doing both inflates the reported total and is a finding verifiers will catch immediately.
2. Agricultural N₂O — The Most Material and Most Missed Source Scope 1 · Scope 3 Cat 1
Nitrogen fertiliser application — both synthetic and organic — is the largest anthropogenic source of N₂O globally. When nitrogen is applied to soil, microbial communities convert a fraction of it to N₂O through nitrification (aerobic) and denitrification (anaerobic). The IPCC 2006 Tier 1 default emission factor is approximately 1% of nitrogen applied (the 2019 IPCC Refinement disaggregates this into 1.6% for synthetic and wet-climate inputs and 0.6% for organic inputs).
| Fertiliser type | DEFRA 2025 factor | Scope | Apply to |
|---|---|---|---|
| Synthetic nitrogen (N) | 5.765 kg CO₂e / kg N | Scope 1 (operator) · Scope 3 Cat 1 (purchaser) | kg of nitrogen — not product weight |
| Organic nitrogen (manure, digestate) | 5.765 kg CO₂e / kg N | Scope 1 (operator) · Scope 3 Cat 1 (purchaser) | kg of nitrogen — not product weight |
DEFRA factors apply to the nitrogen content, not the bag weight. A 50 kg bag of ammonium nitrate (34% N) contains 17 kg N. A 50 kg bag of calcium ammonium nitrate (27% N) contains 13.5 kg N. A 50 kg bag of urea (46% N) contains 23 kg N. Multiply the product weight by the percentage N before applying the 5.765 factor.
How the 5.765 factor is built up
The IPCC 2006 Tier 1 direct emission factor is 0.01 kg N₂O-N per kg N applied. Converting from N₂O-N (mass of nitrogen) to N₂O (mass of the molecule) requires multiplying by the molecular weight ratio:
44 g/mol (N₂O) ÷ 28 g/mol (2N) = 1.5714
Applying AR6 GWP-100 = 273:
0.01 × 1.5714 × 273 = 4.29 kg CO₂e per kg N (direct emissions only)
The DEFRA 5.765 factor is higher because it also includes indirect N₂O from nitrogen leaching into waterways and volatilisation as ammonia — the full fertiliser & soil N₂O methodology documents the direct/indirect split and the Tier 1 / Tier 2 selection rules — both of which eventually return to soils and generate additional N₂O. The 1.475 kg CO₂e/kg N gap between the direct calculation (4.29) and the DEFRA total (5.765) is the indirect component.
For the operating farmer applying fertiliser to their own land, this is Scope 1. For a food, beverage, or apparel company purchasing agricultural commodities, the N₂O from fertiliser applied by their suppliers is Scope 3 Category 1 — Purchased Goods and Services, not Category 11 (which is “use of sold products,” a customer-side category). Misclassifying agricultural supply-chain N₂O as Cat 11 is a common error in food sector inventories. See the GHG Protocol Scope 3 Standard §5.2 and our Scope 3 Cat 1 guide for the correct treatment.
3. Wastewater N₂O — The Overlooked Scope 3 Source Scope 3 Cat 5
Biological wastewater treatment involves microbial nitrification and denitrification of the nitrogen compounds in sewage — the same chemical pathways that generate N₂O from fertilised soils. The nitrogen in human and industrial effluent is a direct N₂O source during treatment, and this N₂O is captured in the DEFRA wastewater treatment factor alongside the embedded energy.
DEFRA 2025 wastewater treatment factor: 0.272 kg CO₂e/m³. Classified as Scope 3 Category 5 — Waste Generated in Operations. Apply to the volume of wastewater discharged. The corresponding water supply factor (0.171 kg CO₂e/m³) is a separate Scope 3 Cat 5 line. Both are required for complete water-related disclosure under GHG Protocol and ISO 14064-1. See our DEFRA factor dataset — water section for the full table.
Most inventories include water supply (0.171 kg CO₂e/m³) and stop there. The wastewater treatment line (0.272 kg CO₂e/m³) is omitted in the majority of corporate disclosures we audit. Both are required under GHG Protocol completeness — and the wastewater factor is the larger of the two.
4. Industrial Process N₂O — Chemicals and Manufacturing Scope 1
Certain industrial chemical processes generate N₂O as a direct process by-product — not from combustion. The three most significant are:
- Nitric acid production — N₂O released during the catalytic oxidation of ammonia (the Ostwald process).
- Adipic acid production — historically one of the largest single industrial N₂O sources before tertiary abatement (catalytic reduction) was widely deployed in the 1990s and 2000s. Adipic acid is a precursor to nylon 6,6.
- Caprolactam production — another nylon precursor (nylon 6) with N₂O as a process by-product.
These are process emissions, not combustion emissions. They cannot be estimated from fuel consumption data alone and must be calculated from production volume and process-specific emission factors per the IPCC 2006 Guidelines for National GHG Inventories (Volume 3, Chapter 3) — Tier 1 defaults or, where measured continuous emissions monitoring data exists, Tier 2 facility-specific factors.
At GWP-100 = 273, even small N₂O leaks from these processes represent very large CO₂e totals. A nitric acid plant emitting 10 tonnes of N₂O per year generates 2,730 tCO₂e — material to corporate Scope 1 disclosure and, increasingly, to CSRD/ESRS E1 double-materiality assessment. Process N₂O is classified as Scope 1 direct emissions under GHG Protocol’s industrial-process category, separate from Scope 1 combustion.
Calculate Scope 1 emissions including N₂O
The Scope 1 Combustion Calculator applies AR6 N₂O GWP-100 = 273 automatically across all fuels — with a per-gas breakdown in the audit trail so you can satisfy ISO 14064-1 transparency requirements without rebuilding from raw mass fractions.
Why N₂O Is Systematically Under-Reported
Nitrous oxide is the greenhouse gas most likely to be materially under-reported in corporate inventories — not through negligence, but through structural gaps in how most inventory processes are designed. Five reasons recur in third-party verification findings:
| # | Structural reason | Verification finding |
|---|---|---|
| 01 | Combustion N₂O is invisible behind pre-aggregated factors. When practitioners use DEFRA CO₂e factors, the N₂O component is embedded and never appears as a separate line. Most practitioners cannot produce a per-gas breakdown when asked. | ISO 14064-1 transparency gap. |
| 02 | Agricultural N₂O data lives outside finance systems. Energy bills are already collected by finance teams. Kg of nitrogen applied per hectare lives in farm management systems, agronomy records, or supplier databases that are rarely integrated into Scope 3 inventories. | Scope 3 Cat 1 omission or high-uncertainty estimate. |
| 03 | Wastewater is forgotten as a Scope 3 Cat 5 entry. Water reporting typically covers supply (0.171) and stops there. The wastewater treatment factor (0.272) — which includes biological-treatment N₂O — is omitted in the majority of inventories. | Completeness failure — GHG Protocol & ISO 14064-1. |
| 04 | Industrial process N₂O is miscategorised as combustion. Companies operating nitric acid, adipic acid, or caprolactam plants sometimes apply combustion factors to process N₂O. The emission mechanism is fundamentally different, and applying combustion factors systematically understates process N₂O. | Methodology error — material understatement. |
| 05 | The AR5 → AR6 GWP update is overlooked for N₂O. The +3% shift from 265 to 273 is small per-unit but compounds materially across high-volume N₂O operations. CDP flags AR5 GWP usage as a methodology inconsistency from the 2023 reporting cycle. | CDP scoring downgrade. |
Converting Nitrous Oxide to CO₂e — Formula and Worked Examples
The conversion from N₂O mass to CO₂-equivalent follows the same single multiplication used for all greenhouse gases. Use GWP-100 = 273 for all corporate reporting — the time horizon does not matter for N₂O because GWP-20 and GWP-100 are both 273.
tCO₂e = tonnes N₂O × GWP-100 (273)
Worked examples — all four inventory contexts
| Scenario | Scope | Calculation | Result (tCO₂e) |
|---|---|---|---|
| Natural gas boiler — N₂O slip (from raw component basis only — not for use with DEFRA CO₂e factors) | S1 | 0.0005 t N₂O × 273 | 0.14 |
| Fertiliser application — 100 ha × 200 kg N/ha (synthetic) | S1 | 20,000 kg N × 5.765 | 115.3 |
| Wastewater treatment — 50,000 m³ discharged | S3 Cat 5 | 50,000 m³ × 0.272 | 13.6 |
| Nitric acid plant — 0.5 t N₂O measured (CEMS) | S1 | 0.5 t N₂O × 273 | 136.5 |
| Food company — 50,000 t purchased grain (15 kg N/t avg) | S3 Cat 1 | 750,000 kg N × 5.765 | 4,323.8 |
CEMS = Continuous Emissions Monitoring System.
Regulatory and Disclosure Relevance
N₂O is a Kyoto basket gas and is in scope for every major corporate disclosure framework. The table below summarises where N₂O appears and which GWP basis each framework currently mandates.
| Framework | N₂O scope | Required GWP basis | Reference |
|---|---|---|---|
| GHG Protocol Corporate Standard | All four contexts (S1 + S3) | AR6 GWP-100 (273) | View standard → |
| GHG Protocol Scope 3 Standard | Cat 1 (agriculture), Cat 5 (wastewater) | AR6 GWP-100 | View standard → |
| CSRD / ESRS E1 | Disclosure E1-6 — gross GHG emissions by gas | AR6 GWP-100 (latest IPCC) | View standard → |
| CDP Climate Change | C6 emissions, C7 emissions breakdown | AR6 GWP-100 (from 2023 cycle) | CDP guidance v2024+ |
| SBTi Corporate Net-Zero | All scopes — basket-of-gases approach | AR6 GWP-100 (Net-Zero Standard v1.1+) | SBTi 2023 update |
| ISO 14064-1:2018 | All four contexts — completeness principle | Latest IPCC (AR6) | View standard → |
Five N₂O-Specific Mistakes in GHG Inventories
- Applying GWP on top of a DEFRA CO₂e combustion factor. DEFRA factors are pre-aggregated — N₂O is already in the number. Adding a separate N₂O calculation on top of 0.18290 kg CO₂e/kWh for natural gas double-counts the N₂O component. Only apply GWP independently if working from raw gas mass fractions.
- Applying the fertiliser factor to product weight instead of nitrogen content. DEFRA 5.765 is per kg of nitrogen (N), not per kg of fertiliser product. A 50 kg bag of calcium ammonium nitrate at 27% N contains 13.5 kg N, not 50 kg. Applying the factor to bag weight overstates emissions by a factor of 3 to 4 depending on the fertiliser type.
- Omitting wastewater treatment N₂O from Scope 3 Cat 5. Almost every inventory includes water supply (0.171 kg CO₂e/m³); very few include wastewater treatment (0.272 kg CO₂e/m³). For a facility consuming 100,000 m³/year, the omission is approximately 27 tCO₂e — a flagged disclosure gap.
- Using the AR5 GWP-100 of 265 instead of AR6’s 273. The 3% difference compounds materially for N₂O-intensive operations. A dairy farm with 500 tCO₂e of N₂O-related emissions at AR5 understates by ~15 tCO₂e at AR6 values. CDP flags AR5 usage as methodology inconsistency from 2023 onwards.
- Misclassifying supplier-applied agricultural N₂O as Scope 3 Category 11 instead of Category 1. N₂O from fertiliser applied by agricultural suppliers is Purchased Goods and Services (Cat 1), not Use of Sold Products (Cat 11). Cat 11 covers downstream customer use of products you sold; Cat 1 covers the upstream emissions of goods you bought. For food, beverage, and apparel companies, this is typically the largest single line in the Scope 3 inventory and the most consequential to get right.
Related Terms, Standards, and Tools
Frequently Asked Questions
The IPCC AR6 GWP-100 value for nitrous oxide is 273, sourced from WGI Table 7.SM.7. This means one tonne of N₂O causes the same warming effect as 273 tonnes of CO₂ over a 100-year period. The previous AR5 value was 265 — a difference of +8 (+3.0%). CDP moved to AR6 from its 2023 reporting cycle; SBTi adopted AR6 in its Corporate Net-Zero Standard v1.1 (2023). All GHG Protocol, CSRD, and SBTi reporting should now use 273.
Nitrous oxide has an atmospheric lifetime of 109 years — substantially longer than methane (12 years) but shorter than CO₂ (centuries). Because most of the N₂O emitted today is still in the atmosphere at both year 20 (~83%) and year 100 (~40%), its radiative forcing is spread relatively evenly across the century. The GWP-20 for N₂O is 273 — the same as its GWP-100 of 273. By contrast, methane’s 12-year lifetime means it has largely decayed by year 20, making its GWP-20 (82.5 fossil) nearly three times its GWP-100 (29.8). For N₂O reporting, the time horizon choice is largely irrelevant — the same value applies across all commonly used horizons.
N₂O appears in four inventory contexts. First, Scope 1 combustion — a small N₂O component is generated when any fuel burns; this is automatically included in DEFRA pre-aggregated CO₂e factors and does not need to be calculated separately. Second, Scope 1 agriculture — nitrogen fertiliser application generates N₂O through soil nitrification and denitrification; DEFRA 2025 factor is 5.765 kg CO₂e per kg of nitrogen applied. Third, Scope 3 Category 5 wastewater — biological treatment of nitrogen-containing effluent generates N₂O; DEFRA 2025 factor is 0.272 kg CO₂e/m³. Fourth, Scope 1 industrial process — nitric acid, adipic acid, and caprolactam production generate process N₂O that must be calculated from production volumes, not combustion data. For purchasers of agricultural commodities, supplier fertiliser N₂O is Scope 3 Category 1 (Purchased Goods and Services).
Use the DEFRA 2025 nitrogen fertiliser factor: 5.765 kg CO₂e per kg of nitrogen (N) applied. The critical point is that this factor applies to the nitrogen content of the fertiliser, not the total product weight. Multiply the total kg of nitrogen applied across all fields by 5.765 to get kg CO₂e. For example: 10,000 kg of nitrogen applied = 57,650 kg CO₂e = 57.7 tCO₂e. The same factor applies to both synthetic and organic nitrogen fertilisers under DEFRA 2025. This factor incorporates both direct N₂O emissions (IPCC 2006 Tier 1, ~1% of N applied; 2019 Refinement: 1.6% synthetic / 0.6% organic) and indirect emissions from leaching and volatilisation, at AR6 GWP-100 = 273. The Fertiliser N₂O Calculator applies this automatically with full audit trail.
Yes. All DEFRA 2025 CO₂e factors incorporate N₂O at AR6 GWP-100 = 273 alongside CO₂ and CH₄. The combustion factors (natural gas, diesel, petrol) include a small N₂O combustion component; the agricultural factors (5.765 kg CO₂e/kg N) are primarily N₂O; and the wastewater factor (0.272 kg CO₂e/m³) includes N₂O from biological treatment. Because DEFRA factors are pre-aggregated, you never need to apply N₂O GWP separately when using them — the conversion is already done. Only calculate N₂O independently if building from raw CO₂ + CH₄ + N₂O mass fractions, in which case multiply the N₂O mass in tonnes by 273 to get tCO₂e. Note: DEFRA’s stated GWP basis on its publication is AR5 (per the workbook Introduction tab); however, DEFRA pre-aggregates the components and the resulting CO₂e factor already accounts for the GWP arithmetic, so the practical effect of DEFRA’s basis statement is a sub-1% rounding-level difference for most fuels.
Stop under-reporting nitrous oxide.
GreenCalculus tools apply AR6 GWP-100 = 273 automatically and surface the per-gas breakdown your verifier will ask for. Built directly on the GHG Protocol Corporate Standard, IPCC AR6, and DEFRA 2025 source documents — audit-grade by default.