
IPCC Tier 1 / 2 / 3 — Definition and GHG Accounting Context
There is no single “right” way to calculate an emission. Estimating the CO₂ from a power station can mean multiplying its fuel use by a global average factor, or by a factor built for that country’s coal, or by numbers piped straight from a monitor on the stack. All three are legitimate — they simply sit at different points on a trade-off between how much accuracy you get and how much data and effort you must spend to get it.
The IPCC tiers name those points — a three-level hierarchy of estimation methods, from Tier 1’s default factors to Tier 3’s site-specific measurement, each step buying accuracy with effort.
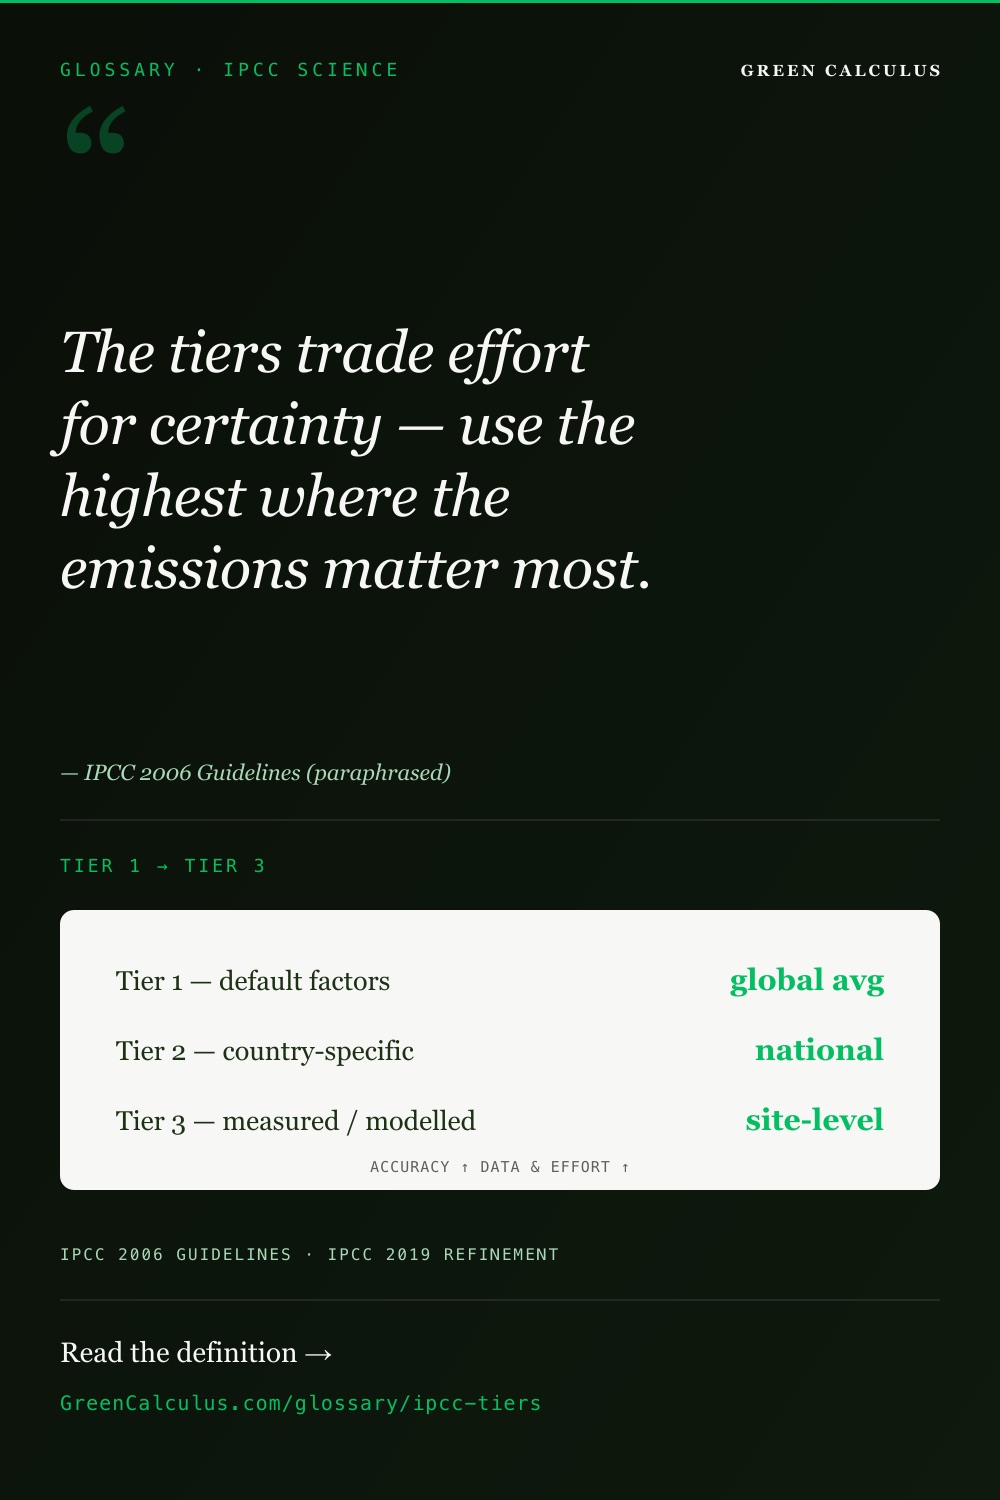
The IPCC tiers are the three methodological levels the IPCC Guidelines define for estimating emissions, in ascending order of accuracy. Tier 1 uses default emission factors (global averages); Tier 2 uses country- or technology-specific factors; Tier 3 uses site-specific measurement or modelling. Higher tiers are more accurate but need more data — so they are applied to the sources that matter most.
Definition — A Hierarchy of Methods
The IPCC tiers are three levels of methodological complexity defined in the IPCC Guidelines for National Greenhouse Gas Inventories for estimating emissions from a given source. They ascend in both accuracy and data intensity: Tier 1 is the simplest and least accurate, Tier 3 the most detailed and most accurate. The tier is a choice of method, not a measure of the result — and the same emission can be estimated at any tier, depending on the data available.
All three tiers share the same underlying structure — activity data multiplied by an emission factor — but differ in how specific the factor and the data are. Tier 1 reaches for a published default; Tier 3 reaches for a measurement. Moving up the tiers means replacing generic values with ones that reflect the actual source more closely.
Crucially, tiers are applied per emission source category, not to a whole inventory. A single GHG inventory routinely mixes them — Tier 3 for a large, well-instrumented power plant, Tier 1 defaults for a scatter of minor sources — because the goal is not maximum tier everywhere, but effort spent where it changes the answer.
Definition at a glance
| Also known as | IPCC tiers · tiered methods · method tiers |
|---|---|
| What they are | A hierarchy of estimation methods, Tier 1 (simplest) to Tier 3 (most detailed) |
| The trade-off | Higher tier = lower uncertainty, but more data and effort |
| Tier 1 / 2 / 3 | Default factors / country-specific factors / site-measured or modelled |
| Chosen by | Data availability + whether the source is a “key category” |
| Set by | IPCC Guidelines for National Greenhouse Gas Inventories |
The IPCC 2006 Guidelines set out a three-level framework of increasing complexity and accuracy: Tier 1 applies default emission factors that do not account for country- or plant-specific conditions; Tier 2 substitutes country- or technology-specific factors; and Tier 3 uses detailed models or direct measurement at the individual-facility level. Tiers 2 and 3 are together called the “higher-tier” methods.
The 2019 Refinement updates many of these tier methods and default factors, and the Guidelines recommend higher tiers for key categories — the sources that most influence a total or its trend.
Tier 1, Tier 2, and Tier 3 Compared
The three tiers differ along the same axes — how specific the emission factor is, how detailed the activity data is, and how much accuracy and effort follow:
| Tier 1 | Tier 2 | Tier 3 | |
|---|---|---|---|
| Emission factors | IPCC defaults (global / regional averages) | Country- or technology-specific | Site-specific — measured or modelled |
| Activity data | Aggregated / national | More disaggregated | Detailed, plant-level |
| Accuracy | Lowest | Higher | Highest |
| Data & effort | Lowest | Medium | Highest |
| Typical use | Minor sources; where local data are missing | Significant sources with national data | Key categories; measured facilities |
The dividing line between Tier 1 and the higher tiers is the emission factor: Tier 1 accepts a generic default, while Tiers 2 and 3 invest in factors that reflect the specific country, technology, or plant. Tier 3 goes furthest, often replacing a factor with a direct measurement or a process model.
The Accuracy–Effort Trade-off
Every step up the tiers narrows the uncertainty of the estimate, because a global average is a poor description of any single source, while a country-specific factor or a stack measurement is a much closer one. The cost is data: Tier 3 can demand continuous monitoring, plant-level fuel and technology data, or a calibrated model.
Typical uncertainty by tier (illustrative)
Uncertainty typically falls sharply from Tier 1 to Tier 3 as global default factors give way to country-specific and then site-measured values — while the data and effort required rise in step. The bars are illustrative; actual uncertainty varies widely by source category and by how good the underlying data are.
Which Tier to Use: Key Categories
The tiers are not a ladder you must climb everywhere. The IPCC’s guidance is to concentrate higher tiers on key categories — the source categories that most influence total emissions, the trend, or the overall uncertainty. Building a Tier 3 model for a trivial source wastes effort; leaving the single largest source at Tier 1 wastes accuracy where it matters most.
So a well-built inventory deliberately mixes tiers: Tier 3 or Tier 2 for the handful of dominant, decision-relevant sources, and Tier 1 defaults for the long tail of small ones. The right tier for a source is the lowest one that does not materially distort the total — which is why key-category analysis, not a blanket rule, drives the choice.
Tiers Beyond the IPCC
Although the tiers originate in the IPCC’s national-inventory guidance, the same logic runs through corporate and financial accounting under other names. Choosing between a Tier 1 default factor and a Tier 3 supplier-specific measurement is the same decision as choosing between a spend-based estimate and primary activity data, or between a high and a low PCAF data quality score.
In every version, the principle is identical: a more specific method costs more but describes reality better, and the sensible move is to spend that effort where the emissions — and the uncertainty — are largest. The IPCC tiers are simply the clearest, most formal statement of a trade-off that every carbon calculation eventually faces.
Common Confusions
- Thinking Tier 3 is always required. Higher tiers are for key categories; using Tier 1 defaults for minor sources is correct, not a shortcoming.
- Applying a tier to the whole inventory. Tiers are chosen per source category — a real inventory mixes them.
- Assuming a higher tier is automatically more accurate. A Tier 3 model fed poor data can be worse than a sound Tier 1 estimate; the tier sets the method, not the quality of the inputs.
- Leaving a dominant source at Tier 1. A default factor on the largest source carries the widest uncertainty exactly where it matters most.
- Confusing IPCC tiers with the PCAF data quality score. Both grade methodological rigour, but they are distinct frameworks with different scales.
- Confusing tiers with scopes. IPCC tiers are levels of estimation method; scopes are categories of emission source — unrelated axes.
Frequently Asked Questions
The IPCC tiers are the three methodological levels the IPCC Guidelines define for estimating greenhouse gas emissions, in ascending order of accuracy and data intensity. Tier 1 uses default emission factors — global or regional averages — and is the simplest but least accurate. Tier 2 uses country- or technology-specific factors. Tier 3 uses site-specific measurement or detailed models, giving the highest accuracy but demanding the most data. All three multiply activity data by an emission factor; they differ in how specific that factor and data are.
The difference is how specific the method is. Tier 1 applies generic IPCC default factors that ignore country- or plant-specific conditions — simplest, least accurate. Tier 2 substitutes country- or technology-specific factors, improving accuracy where national data exist. Tier 3 goes furthest, using direct measurement or detailed models at the individual-facility level for the highest accuracy, at the cost of the most data and effort. Tiers 2 and 3 together are called the higher-tier methods. Each step up narrows the uncertainty of the estimate.
Match the tier to the importance of the source. The IPCC recommends higher tiers for key categories — the sources that most influence total emissions, the trend, or the overall uncertainty — and allows Tier 1 defaults for minor sources. A real inventory therefore mixes tiers: Tier 2 or Tier 3 for the dominant, decision-relevant sources, and Tier 1 for the long tail of small ones. The right tier for any source is the lowest one that does not materially distort the total, which is why key-category analysis, not a blanket rule, drives the choice.
Usually, but not automatically. A higher tier uses a method capable of greater accuracy — country-specific factors or direct measurement instead of a global default — so in principle it narrows uncertainty. But the tier sets the method, not the quality of the inputs: a Tier 3 model fed poor or unrepresentative data can perform worse than a sound Tier 1 estimate. Higher tiers deliver their promised accuracy only when the more detailed data they require are actually good. This is why the tier should be matched to both the source’s importance and the data genuinely available.
Directly. Although the tiers come from the IPCC’s national-inventory guidance, the same trade-off appears throughout corporate and financial accounting under other names. Choosing a Tier 1 default versus a Tier 3 supplier-specific measurement is the same decision as choosing a spend-based estimate versus primary activity data, or a high versus low PCAF data quality score. In each, a more specific method costs more but describes reality better, and the sensible course is to spend that effort where the emissions and uncertainty are largest.