Scope 3 Emissions

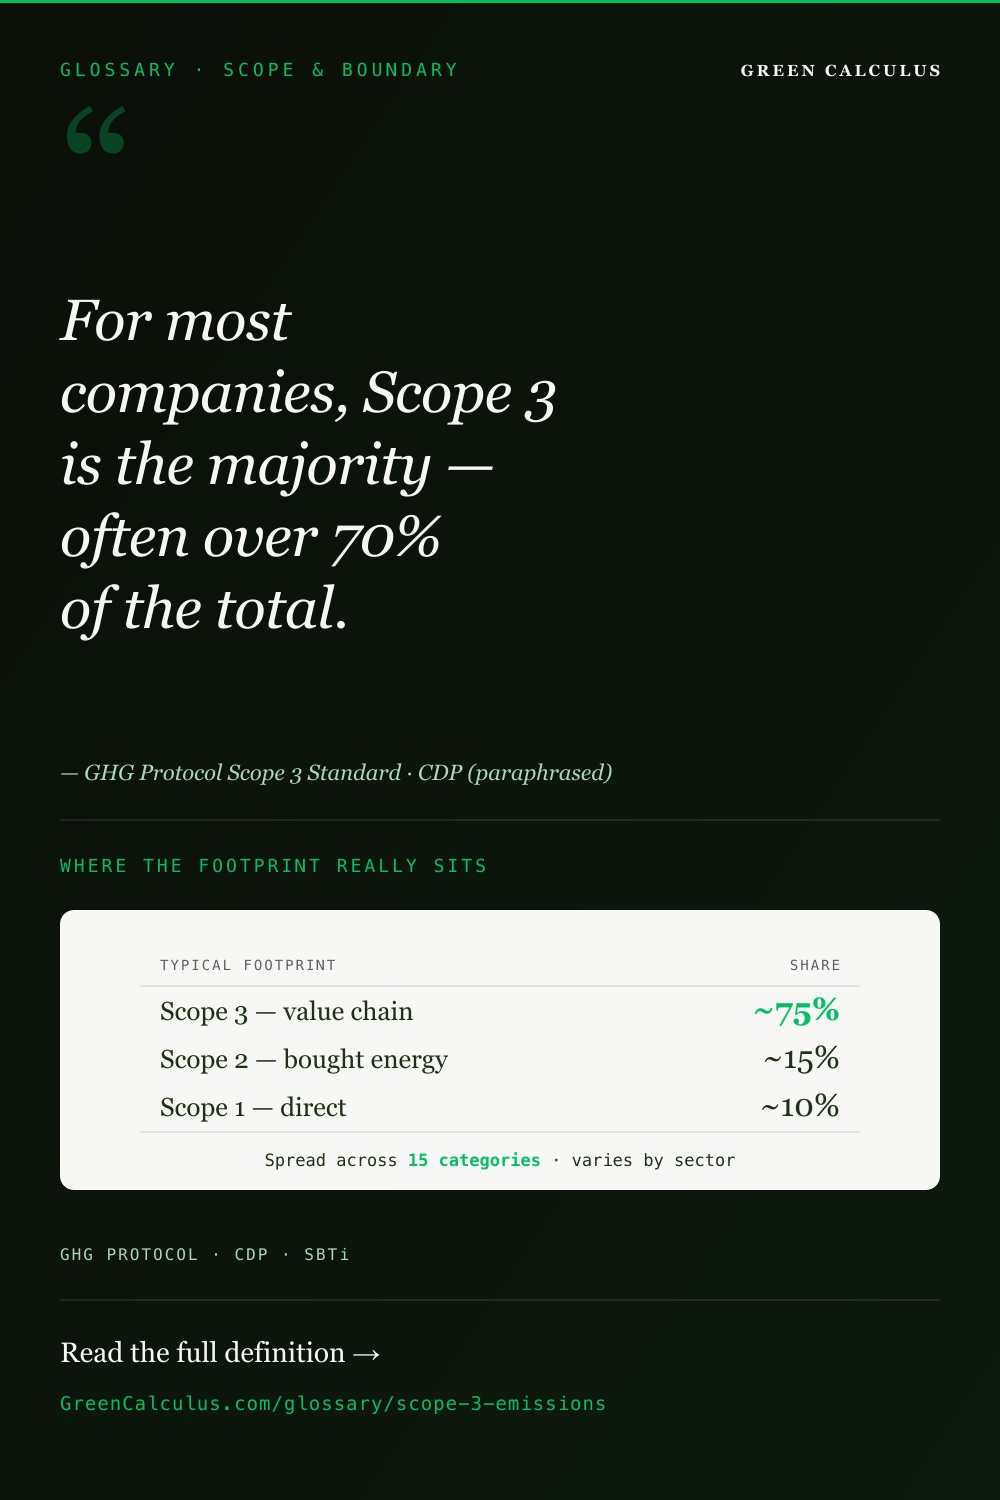
Scope 3 is 70–90% of most companies’ total greenhouse gas footprint. It is also the most inconsistently reported number in sustainability disclosure. Two companies in the same sector can publish Scope 3 figures that differ by an order of magnitude while both being technically compliant with the GHG Protocol. The problem is not intent — it is methodology: which of the 15 categories were included, which calculation method was applied to each, and whether the organisational boundary was applied consistently across upstream and downstream activities.
This article delivers the canonical 15-category reference, the three-method calculation hierarchy, the boundary rules that align Scope 3 with the Scope 1 organisational boundary decision, and the five methodology errors that appear most frequently at third-party verification. The goal is to make Scope 3 calculable — not just defensible.
Scope 3 emissions are all indirect greenhouse gas emissions that occur in the value chain of the reporting company — both upstream and downstream — and that are not already captured in Scope 1 or Scope 2. The GHG Protocol Scope 3 Standard defines 15 categories: 8 upstream (purchased goods, capital goods, fuel-related activities, upstream transport, waste, business travel, commuting, upstream leased assets) and 7 downstream (downstream transport, processing of sold products, use of sold products, end-of-life, downstream leased assets, franchises, investments). Three calculation methods are recognised — spend-based, activity-based, and supplier-specific — in increasing order of accuracy. For most companies, Scope 3 is the largest scope and Category 1 (Purchased goods and services) is the largest category within it.
Definition and GHG Protocol Basis
The GHG Protocol Corporate Value Chain (Scope 3) Accounting and Reporting Standard defines Scope 3 as all indirect GHG emissions (not included in Scope 2) that occur in the value chain of the reporting company, including both upstream and downstream emissions. The operative phrase is value chain, not supply chain — downstream emissions from sold products, end-of-life treatment, and investments are equally in scope.
The relationship to Scope 1 and Scope 2 is governed by a single rule: mutual exclusivity. The same emission cannot appear in two scopes simultaneously. An emission belongs to Scope 1 if the source is owned or controlled by the company; to Scope 2 if it comes from purchased electricity, steam, heat, or cooling consumed by the company; to Scope 3 if it occurs anywhere else in the company’s value chain. The defining question is not “did we cause this emission?” but “does this emission occur in our value chain, and is it not already captured in Scope 1 or Scope 2?”
Scope 3 covers all seven Kyoto Protocol gases — CO₂, CH₄, N₂O, HFCs, PFCs, SF₆, and NF₃ — converted to a common reporting unit using their Global Warming Potential at AR6 GWP-100. The result, expressed in tonnes of CO₂-equivalent (tCO₂e), aggregates across the 15 categories defined in the next section.
Scope 3 is defined by two questions in sequence: (1) does this emission occur somewhere in our value chain — upstream or downstream? (2) is it already captured in Scope 1 or Scope 2? An emission is Scope 3 only if the answer to (1) is yes and to (2) is no. The 15 categories below partition the “yes/no” answer space; they do not add new emissions on top of it.
The 15 Categories — Upstream vs Downstream
The Scope 3 Standard partitions all value-chain emissions into 15 mutually-exclusive categories. Eight categories cover upstream activities — emissions from goods, services, and energy that flow into the company. Seven categories cover downstream activities — emissions that occur after the company’s products leave its operational control.
Purchased Goods & Services
Largest category for most sectors. Spend-based or material-based calculation — depending on data availability.
Business Travel
Flights, rail, hotels, taxis. DEFRA factors per passenger-km. Includes RF for aviation by default.
Use of Sold Products
Dominant for electronics, appliances, vehicles. Energy consumption × product lifetime × grid factor.
Investments
Financed emissions per PCAF. Often >99% of total Scope 3 for banks, asset managers, insurers.
Full category reference table
| # | Category name | Direction | CSRD required | Typical method | Examples |
|---|---|---|---|---|---|
| 1 | Purchased goods & services | Upstream | Yes | Spend / material | Raw materials, components, professional services, IT hardware |
| 2 | Capital goods | Upstream | Yes | Spend / material | Buildings, machinery, vehicles, IT infrastructure |
| 3 | Fuel- & energy-related activities | Upstream | Yes | Activity-based (WTT) | Well-to-tank emissions of purchased fuels; T&D losses for grid electricity |
| 4 | Upstream transportation & distribution | Upstream | Yes | Activity-based (tonne-km) | Inbound freight, third-party logistics for purchased goods |
| 5 | Waste generated in operations | Upstream | Yes | Activity-based (tonnes) | Landfill, incineration, recycling — by waste type |
| 6 | Business travel | Upstream | Yes | Activity-based (p-km) | Flights, rail, taxis, hotels, rental cars |
| 7 | Employee commuting | Upstream | Yes | Survey + p-km | Daily home-to-office travel; work-from-home energy allocation |
| 8 | Upstream leased assets | Upstream | No | Activity-based | Assets the company leases in but doesn’t operationally control |
| 9 | Downstream transportation & distribution | Downstream | No | Activity-based (tonne-km) | Outbound freight after sale; distributor logistics |
| 10 | Processing of sold products | Downstream | No | Activity-based | Intermediate-product manufacturers’ downstream processing emissions |
| 11 | Use of sold products often largest | Downstream | Yes | Lifetime energy × grid factor | In-use energy of sold appliances, electronics, vehicles |
| 12 | End-of-life treatment of sold products | Downstream | Yes | Activity-based (tonnes) | Disposal emissions of sold products at end of life |
| 13 | Downstream leased assets | Downstream | No | Activity-based | Assets the company leases out to third parties |
| 14 | Franchises | Downstream | No | Activity-based | Emissions of franchisee-operated outlets |
| 15 | Investments | Downstream | No | PCAF / financed emissions | Equity, debt, project finance — financed emissions for FIs |
CSRD-required categories per ESRS E1 datapoint E1-6. Categories 1, 2, 3, 4, 5, 6, 7, 11, and 12 are required for all in-scope undertakings; the remaining six are required where material. MasterBrain v2025.3.
Categories 9–15 cover the full set of emissions that occur after the company’s gate — but not all of them are triggered by a sale. Cat 13 (downstream leased assets) applies when the company leases out an asset it owns. Cat 14 (franchises) applies for franchisor companies regardless of whether a discrete “sale” occurred. Cat 15 (investments) applies to equity and debt holdings — there is no sale at all. The unifying principle for downstream is “emissions occurring outside operational control, after the company’s value-chain gate”, not “emissions of sold goods”.
Mandatory vs Optional — Framework Requirements
Whether a Scope 3 category must be reported depends on the framework and on whether the category is material. CSRD/ESRS E1 specifies nine baseline-required categories. SBTi requires Scope 3 inclusion in near-term targets above a quantified threshold. GHG Protocol requires all material categories to be quantified. The same Scope 3 inventory is read against multiple framework requirements simultaneously — and meeting one does not automatically satisfy the others.
| Framework | Scope 3 requirement | GWP basis | Notes |
|---|---|---|---|
| GHG Protocol Scope 3 Standard | All material categories required | AR6 GWP-100 | Materiality screened against the 15-category structure. Boundary justification required. |
| CSRD / ESRS E1 most prescriptive | Cat 1, 2, 3, 4, 5, 6, 7, 11, 12 baseline required | AR6 GWP-100 (latest IPCC) | Datapoint E1-6 gross GHG emissions. Remaining six categories required where material. |
| CDP Climate Change | C6.5 Scope 3 — all categories assessed | AR6 GWP-100 (from 2023 cycle) | Per-category disclosure; “not relevant” requires explicit justification. |
| SBTi Corporate Net-Zero v1.1 | Required if Scope 3 ≥ 40% of S1+S2+S3 | AR6 GWP-100 | Once triggered, near-term target must cover ≥ 67% of total Scope 3. |
| ISO 14064-1:2018 | “Significant” indirect emissions required | Latest IPCC (AR6) | Applies the completeness principle; significance determined by the reporter. |
Under the SBTi Corporate Net-Zero Standard v1.1, Scope 3 must be included in the near-term target if it represents ≥ 40% of combined Scope 1 + 2 + 3 emissions. For most sectors, this threshold is met by default — Scope 3 is typically 70–90% of the total. Once the threshold is crossed, the near-term target must cover at least 67% of total Scope 3 emissions. The 67% can be achieved through a combination of absolute reduction targets, supplier engagement targets, or both — but the coverage is non-negotiable. Submitting an S1+S2-only target while Scope 3 exceeds 40% is grounds for SBTi rejection.
Under CSRD/ESRS E1, the nine baseline-required categories (1, 2, 3, 4, 5, 6, 7, 11, 12) must be quantified by every in-scope company. The remaining six (8, 9, 10, 13, 14, 15) are required where material — and materiality is the company’s call to make and defend. A retailer with a large franchise estate cannot skip Cat 14 by classifying it as immaterial; an asset manager cannot skip Cat 15. The CSRD floor is a starting point, not a permission to stop.
Three Calculation Methods
The Scope 3 Standard recognises three calculation methods, ordered by data quality and accuracy. Most corporate Scope 3 inventories use a mix — spend-based for screening immaterial categories, activity-based for material categories with physical-quantity data, and supplier-specific data where supplier engagement programs have matured enough to deliver primary data.
Level 1 — Spend-based (lowest accuracy)
Activity data: spend in GBP (or another currency, with the appropriate factor set).
Factors: DEFRA 2025 spend-based factors (kg CO₂e per GBP).
When to use: screening exercises, immaterial categories, Cat 1 sub-categories where physical quantity data is unavailable.
DEFRA 2025 spend-based factors are derived from input-output tables based on approximately 2022 supply-chain data. Underlying supplier emission intensities can shift substantially in three years, and price changes that don’t reflect underlying emissions can distort the spend-to-emissions translation. Spend-based is acceptable for screening — it is not acceptable as the final method for a category that is material to total Scope 3.
Level 2 — Activity-based (preferred)
Activity data: physical mass, distance, quantity, or energy consumption.
Factors: DEFRA 2025 material-based factors (kg CO₂e/kg), freight factors (kg CO₂e/tonne-km), business travel factors (kg CO₂e/passenger-km).
When to use: the preferred method for any category where physical activity data exists. This is the default for Cat 4, 5, 6, 7, and material sub-categories of Cat 1 and 2.
Level 3 — Supplier-specific (highest accuracy)
Activity data: primary supplier-reported data, Environmental Product Declarations (EPDs), Product Carbon Footprints (PCFs).
Factors: supplier-disclosed emission intensities at the product or service level.
When to use: material Cat 1, 2, 4, and 11 emissions where supplier engagement programs deliver primary data; required for SBTi supplier engagement targets.
The GHG Protocol Scope 3 Standard recommends upgrading from spend-based to activity-based (or higher) for any category that represents at least 1% of total Scope 3 in the screening year. This is the operational decision rule for inventory maturity: screen everything with spend-based first, identify the categories above the 1% threshold, then invest in activity-based or supplier-specific data for those categories. The remaining sub-1% categories can stay on spend-based factors indefinitely.
Scope 3 vs Scope 1 vs Scope 2 — Boundary Traps
The mutual-exclusivity rule is simple in principle: each emission belongs to one scope only. In practice, three boundary configurations cause the majority of misclassification errors at third-party verification. Each error type is symmetrical — the same emission can be wrongly assigned in either direction.
Trap 1 — Cat 3 vs Scope 1 combustion
The well-to-tank (WTT) emissions of purchased fuels — extraction, refining, transport to point of use — are Scope 3 Category 3 (Fuel- and energy-related activities), not Scope 1. The combustion of natural gas at a company boiler is Scope 1. The emissions from extracting that gas, processing it, and piping it to the meter are Cat 3. WTT factors typically add 15–20% on top of combustion emissions for fossil fuels — and they are systematically missed because they are not embedded in fuel invoices.
Trap 2 — Cat 6 vs Scope 1 mobile combustion
Rental cars, hire cars, employee-owned vehicles used for business, taxis, ride-share, and flights are Scope 3 Category 6 (Business travel), not Scope 1 mobile combustion. Only vehicles the company owns or operates under its operational control policies are Scope 1. This error is symmetrical — companies inflate Scope 1 with travel emissions that should be Cat 6, and companies under-report Scope 1 by treating company-owned vehicles as if they were rental fleet.
The well-to-tank component of natural gas combustion is dominated by upstream methane leakage. Fossil methane has an AR6 GWP-100 of 29.8× CO₂ — small mass releases produce large CO₂e numbers. For a gas-heavy operation (e.g. a chemicals plant burning 100 GWh of natural gas annually), the Cat 3 WTT component can be 15–20% of combined Scope 1 + Cat 3 emissions. Excluding it understates the company’s effective gas footprint by the same percentage. See methane (CH₄) for the full sectoral breakdown.
Trap 3 — Cat 8 / Cat 13 leased assets
Whether a leased asset is Scope 1, Cat 8 (upstream leased), or Cat 13 (downstream leased) depends on the same organisational boundary approach the company chose for Scope 1 — equity share, financial control, or operational control. Under operational control, a long-term leased building where the company sets its own energy and facilities policies is Scope 1, not Cat 8. The same building under financial control might be Cat 8 if the lease doesn’t meet financial-consolidation criteria. The classification cannot diverge from the boundary decision: applying operational control to Scope 1 but treating the same leased assets as Cat 8 is internally inconsistent and a verification finding.
The organisational boundary chosen for Scope 1 is the same boundary that governs Cat 8 and Cat 13 inclusion. A company cannot use operational control for Scope 1 and equity share for leased-asset classification — this is a boundary inconsistency that verifiers test explicitly. See Scope 1 emissions for the three boundary approaches and their interaction with leased assets across the inventory.
How to Calculate Scope 3 — Worked Examples
Every Scope 3 calculation reduces to the same core multiplication, applied to whichever activity data the chosen method uses.
tCO₂e = Activity Data × Emission Factor
Where activity data is: spend (£), mass (kg), distance (km), passenger-km, tonne-km, or kWh — and the factor is matched to the unit.
Worked examples — across upstream and downstream categories
| Scenario | Category | Calculation | Result (tCO₂e) |
|---|---|---|---|
| £10,000 spent on IT hardware (spend-based) | Cat 1 | 10,000 GBP × 0.058 kg CO₂e/GBP | 0.58 |
| £10,000 spent on textiles (spend-based) | Cat 1 | 10,000 GBP × 0.869 kg CO₂e/GBP | 8.69 |
| 500 kg virgin steel purchased (material-based) | Cat 1 | 500 kg × 2.800 kg CO₂e/kg | 1.4 |
| Return short-haul flight — London ↔ Amsterdam (740 km return) | Cat 6 | 740 p-km × 0.123 kg CO₂e/p-km (with RF) | 0.091 |
| Petrol-car commuting — 50 employees × 30 km/day × 220 days | Cat 7 | 330,000 p-km × 0.170 kg CO₂e/p-km | 56.1 |
| Work-from-home allocation — 10 employees × 3 days/wk × 44 wks | Cat 7 | 1,320 working days × 2.84 kg CO₂e/day | 3.7 |
DEFRA 2025 factors throughout. Aviation factor includes radiative forcing (RF). The first two rows illustrate that category choice dominates method choice — same £10,000 spend produces a 15× difference in emissions depending on what was bought. The Cat 7 commuting row uses average car-petrol passenger-km factor; the WFH row uses DEFRA’s daily energy allocation. Aggregate Cat 7 example: 56.1 + 3.7 = 59.8 tCO₂e.
Map your Scope 3 against an SBTi-aligned target.
The SBTi Near-Term Target Calculator and SBTi Readiness Checklist apply the 67% Scope 3 coverage rule, the absolute contraction approach, and the 40% materiality threshold automatically — so the line between “qualifies” and “rejected” is calculated, not estimated.
Materiality Screening
The GHG Protocol Scope 3 Standard requires every reporting company to evaluate all 15 categories — but does not require every company to fully calculate all 15. The screening approach is a three-step funnel that distinguishes categories worth investing in from categories that can be left at a default low value with adequate justification.
- Identify all 15 categories that could apply to the company’s operations. A retailer has Cat 1; a financial institution has Cat 15; a manufacturer has Cat 1 and Cat 11. Companies that “skip” a category should justify on operational grounds, not data-availability grounds.
- Estimate order-of-magnitude size for each category that could apply. Spend-based factors are acceptable for screening — accuracy is not the goal here, ranking is.
- Prioritise categories representing ≥ 1% of estimated total Scope 3 for full activity-based calculation. Categories below the 1% threshold can stay on spend-based factors with a documented rationale.
Sector materiality reference
| Sector | Dominant category | Other material categories | Typically immaterial |
|---|---|---|---|
| Office / professional services | Cat 1 (purchased services, IT) | Cat 6 (travel), Cat 7 (commuting), Cat 5 (waste) | Cat 11, Cat 14, Cat 15 |
| Retail (non-food) | Cat 1 (purchased goods for resale) | Cat 4 (inbound freight), Cat 11 (electronics use) | Cat 14 (unless franchise model), Cat 15 |
| Manufacturing (consumer goods) | Cat 1 (raw materials, components) | Cat 11 (use of sold products), Cat 12 (end-of-life), Cat 4 | Cat 14, Cat 15 |
| Financial services | Cat 15 (financed emissions, often >99%) | Cat 1 (operations), Cat 6 (travel) | Cat 11, Cat 12, Cat 14 — usually all minor relative to Cat 15 |
| Technology / SaaS | Cat 1 (cloud services, hardware) | Cat 11 (data-centre energy of sold compute), Cat 6 | Cat 12, Cat 14, Cat 15 |
| Food & beverage | Cat 1 (agricultural inputs) | Cat 4 (freight), Cat 11 (cooking energy), Cat 12 (packaging EoL) | Cat 14 (unless franchise model), Cat 15 |
For consumer electronics, automotive, and appliance manufacturers, Category 11 (Use of sold products) is typically the single largest category — often 50–80% of total Scope 3 alone. The reason is straightforward: a refrigerator sold today consumes electricity for 10–15 years; an EV consumes electricity (or a hybrid burns fuel) for 8–12 years; a smartphone runs charging cycles for 3–5 years. The aggregate use-phase emissions over the product’s full lifetime — energy consumption × lifetime × grid emission factor — almost always exceed the manufacturing emissions captured in Cat 1. Companies in these sectors that do not calculate Cat 11 are missing the largest piece of their Scope 3 footprint.
Regulatory and Disclosure Relevance
Scope 3 disclosure is required by every major corporate framework, with varying degrees of prescription on which categories must be quantified and at what GWP basis.
| Framework | Scope 3 requirement | GWP basis | Reference |
|---|---|---|---|
| GHG Protocol Scope 3 Standard | All material categories required; materiality justification required | AR6 GWP-100 | View standard → |
| CSRD / ESRS E1 | 9 baseline categories required; remaining 6 where material | AR6 GWP-100 (latest IPCC) | View standard → |
| CDP Climate Change | C6.5 — per-category disclosure across all 15 | AR6 GWP-100 (from 2023 cycle) | CDP guidance v2024+ |
| SBTi Corporate Net-Zero v1.1 | Required if Scope 3 ≥ 40% of total; ≥ 67% coverage in target | AR6 GWP-100 | View standard → |
| ISO 14064-1:2018 | “Significant” indirect emissions required (completeness principle) | Latest IPCC (AR6) | View standard → |
Five Common Scope 3 Mistakes
- Omitting Category 3 (fuel- and energy-related activities) entirely. The well-to-tank emissions of purchased fuels are structurally separate from combustion (Scope 1), but they are systematically missed because WTT factors are not embedded in fuel invoices. For a gas-heavy operation, Cat 3 can represent 15–20% of total Scope 3. Cat 3 also covers transmission and distribution losses for purchased grid electricity — a non-trivial contribution for any company with material Scope 2.
- Double-counting between Cat 1 and Cat 11. A manufacturer that buys components (Cat 1) and also sells finished goods that consume energy in use (Cat 11) must ensure these don’t overlap. Cat 1 covers the upstream supply chain emissions of producing the components; Cat 11 covers the downstream use-phase emissions of the finished product. Different product flows, different calculation methods, different emission sources — but the categories are sometimes conflated by including supplier production emissions inside the use-phase calculation, which inflates Cat 11 with double-counted Cat 1 content.
- Using spend-based for a material category without upgrading. DEFRA spend factors are a screening tool. Using 0.869 kg CO₂e/GBP for a fashion retailer’s entire textiles procurement (Cat 1) when physical-quantity data is available produces a figure with high uncertainty — not audit-grade. The GHG Protocol Scope 3 Standard requires upgrading to activity-based or supplier-specific data for any category that crosses the 1% materiality threshold.
- Wrong leased-asset classification. Companies that chose operational control for Scope 1 but report leased buildings as Cat 8 (upstream leased assets) contradict their own boundary decision. The same assets cannot be Scope 1 under one approach and Scope 3 under another — the boundary must be applied consistently. See Scope 1 emissions for the three boundary approaches and their interaction with leased assets.
- Excluding Scope 3 from SBTi targets when the 40% threshold is met. If Scope 3 represents ≥ 40% of combined Scope 1 + 2 + 3 (which it does for most sectors), SBTi requires near-term targets to cover Scope 3 with ≥ 67% coverage. Companies that submit S1+S2-only targets under SBTi Corporate Net-Zero Standard v1.1 while their Scope 3 exceeds the 40% threshold are non-compliant — and the target will be rejected at validation.
Related Terms, Standards, and Tools
Frequently Asked Questions
Scope 3 emissions are all indirect greenhouse gas emissions that occur in the value chain of the reporting company, both upstream and downstream, that are not already captured in Scope 1 or Scope 2. The GHG Protocol Scope 3 Standard defines 15 categories — 8 upstream and 7 downstream — covering everything from purchased goods and business travel to use of sold products and financed emissions. For most companies, Scope 3 is the largest of the three scopes (typically 70–90% of the total) and is also the most error-prone to quantify because the data sits with suppliers, customers, and counterparties rather than inside the company’s own operations.
Scope 1 is direct emissions from sources you own or control — boilers, vehicles, refrigerant leaks, process emissions. Scope 2 is indirect emissions from purchased electricity, steam, heat, or cooling that you consume. Scope 3 is all other indirect emissions in your value chain, both upstream (purchased goods, business travel, commuting) and downstream (use of sold products, end-of-life, investments). The three scopes are mutually exclusive — the same emission cannot appear in two scopes simultaneously. The GHG Protocol Corporate Standard defines all three; the Scope 3 Standard adds the 15-category structure for Scope 3. Under CSRD/ESRS E1, all three scopes are required.
It depends on the framework. Under CSRD/ESRS E1, nine categories are baseline-required for all in-scope companies: Cat 1 (purchased goods & services), Cat 2 (capital goods), Cat 3 (fuel- and energy-related activities), Cat 4 (upstream transport), Cat 5 (waste), Cat 6 (business travel), Cat 7 (employee commuting), Cat 11 (use of sold products), and Cat 12 (end-of-life). The remaining six (Cat 8, 9, 10, 13, 14, 15) are required where material. Under the GHG Protocol Scope 3 Standard, all material categories are required, with materiality justification documented. Under SBTi Corporate Net-Zero v1.1, Scope 3 must be included in near-term targets if it exceeds 40% of the total.
Three methods, in increasing order of accuracy. Spend-based: total spend in GBP × DEFRA 2025 spend factor (kg CO₂e/GBP) — fastest, but with high uncertainty and a 3-year data lag. Material-based (activity-based): physical mass purchased × material-specific emission factor (e.g. 500 kg of virgin steel × 2.800 kg CO₂e/kg = 1.4 tCO₂e) — preferred where mass data is available. Supplier-specific: primary supplier-disclosed emission intensities, EPDs, or PCFs — highest accuracy and required for SBTi supplier engagement targets. The GHG Protocol Scope 3 Standard recommends upgrading from spend-based to activity-based for any Cat 1 sub-category that represents ≥ 1% of total Scope 3 in the screening year. Full DEFRA factor set: DEFRA 2025 emission factors dataset.
Business travel is almost always Scope 3 Category 6. This includes flights, rail journeys, hotel stays, taxis, ride-share, rental cars, and employee-owned vehicles used for business. The only travel-related emissions that belong in Scope 1 are those from vehicles the company owns or operationally controls — for example, a company-owned delivery van or a leased fleet vehicle under operational-control boundary. A common error in corporate inventories is to lump all travel into Scope 1 mobile combustion when most of it is rental, employee-owned, or third-party-operated — and therefore Cat 6. See Scope 1 emissions for the boundary rules that distinguish company-owned vehicles from business travel in non-owned vehicles.
Map your Scope 3 exposure before your next disclosure cycle.
GreenCalculus tools apply DEFRA 2025 factors, AR6 GWP values, and the SBTi 67% coverage rule automatically — and surface the per-category breakdown that CSRD, CDP, and SBTi reviewers will ask for. Built directly on the GHG Protocol Scope 3 Standard, IPCC AR6, and DEFRA 2025 source documents — audit-grade by default.