
Digital & IT · ISO 14067
End-User Devices Emissions Calculator (Laptop / Smartphone / Monitor / Tablet)
Audit-grade CO₂e for the devices your workforce uses — laptops, smartphones, monitors, tablets, desktops, and all-in-ones — across both carbon phases: the embodied carbon locked in at manufacture and the use-phase electricity each device draws in service. Embodied carbon is amortised over a per-device service life; use-phase runs through active-use power × hours × location-based grid intensity. The two lines are reported separately, because for most device fleets the manufacturing footprint — not the electricity — is the larger number.
Two carbon phases, two reporting perspectives. Every device carries an embodied footprint (the emissions of mining, manufacturing, and shipping it) and a use-phase footprint (the electricity it draws while you operate it). This calculator reports both as separate lines and never blends them into a single hidden total. Which scopes those lines land in depends on the reporting-perspective toggle.
Own-fleet perspective (default). You operate the devices. Embodied carbon is upstream Scope 3 Category 1 (purchased goods), reported on an amortised annual basis — the device’s embodied total divided across its service life so each reporting year carries its share. Use-phase electricity is Scope 2 (purchased electricity). The headline figure is an annual number.
Sold-products perspective. You manufacture or sell the devices. Embodied carbon stays Scope 3 Category 1, but use-phase electricity moves to Scope 3 Category 11 (use of sold products), and the result is reported per device over its full life, not annualised. The headline number’s meaning changes with the toggle — read it accordingly.
Embodied carbon (Stage 1). Per-device embodied factors come from Lövehagen et al. (2023), a supply-chain study that allocates the reported Scope 1/2/3 emissions of upstream electronics manufacturers to the ITU-T L.1450 user-equipment categories, validated against published manufacturer PCFs and LCAs and representing the 2020 global shipment mix. The figures are cradle-to-distribution (they exclude use-phase and end-of-life) on an IPCC AR5-100 GWP basis. Amortisation is straight-line: embodied per year = embodied total ÷ service-life years. Default service lives are 4 years (laptop, tablet), 3 years (smartphone), 6 years (monitor), and 5 years (desktop, all-in-one), each overridable.
Use-phase electricity (Stage 2). kWh = active-use power (W) × annual active hours ÷ 1000, then multiplied by the location-based grid factor and, optionally, grossed up for transmission & distribution losses. The power coefficients are active-use watts — not ENERGY STAR typical-energy-consumption (TEC) values — measured or framework-sourced per device: laptop from Kirkeby & Lagermann (2026, measured median), smartphone and tablet from DIMPACT (2022), monitor, desktop, and all-in-one from the Digst framework (2025). Standby is excluded as de minimis for these device types. Power Usage Effectiveness (PUE) is not applied — PUE is a data-centre overhead multiplier and has no place in an end-user device calculation. If you are accounting for the data centres behind cloud services, use the data-centre PUE calculator instead.
Grid basis. Country factors are location-based (Ember Yearly Electricity; the US uses EPA eGRID and GB uses DEFRA), covering 213 countries. The grid factor is the single largest lever on the use-phase line — but because embodied carbon usually dominates the total, grid choice moves the headline less here than on a data-centre or AI-compute page. See §3.
Excluded: end-of-life and e-waste treatment (report via the end-of-life calculator), network and data-transfer energy beyond the device, data-centre and cloud compute behind any services the device consumes (see the cloud compute calculator), and peripherals without a dedicated row (thin-clients, routers, feature-phones).
Own fleet → embodied Scope 3 Cat 1 + use-phase Scope 2 (annual). Sold products → embodied Scope 3 Cat 1 + use-phase Scope 3 Cat 11 (full life).
One line per device type. Embodied carbon is read per device (Lövehagen 2023); operational from the device’s active-use power × your hours × the regional grid factor.
Location-based grid factor for the device estate’s electricity. Used for the operational (use-phase) component.
Useful-life years amortise embodied carbon (no MasterBrain lifetime row exists — these are documented defaults, citing ITU-T L.1450 / Lövehagen). Extending a lifetime is the primary reduction lever for a device estate — adjust to model your refresh policy.
Add your devices and pick a region above to calculate
Results appear instantly. The embodied-vs-operational split, per-device breakdown, scope mapping and full audit trail appear after calculation. For most device estates, embodied (manufacturing) carbon dominates.
Results are indicative lifecycle estimates for an end-user device estate, combining embodied (cradle-to-distribution manufacturing) carbon — Lövehagen et al. 2023 representative 2020 device footprints (AR5-100) — with operational use-phase electricity (active-use power × hours × the location-based regional grid factor). The reporting perspective sets the GHG Protocol scope: own / operated fleet reports embodied as Scope 3 Category 1 (amortised over useful life, or full at acquisition) and use-phase as Scope 2; sold products reports embodied as Scope 3 Category 1 and use-phase as Scope 3 Category 11 over the device’s full life. Embodied factors are 2020 representative shipment-mix averages — a specific SKU can vary ±20%. Useful-life years are documented engine defaults, not published factors. End-of-life / recycling and network / data-transmission energy are out of scope. This is a transparent estimate, not a metered reading; confirm device counts and active-use hours against your IT asset register, and where material proceed to third-party verification.
The greenest laptop is the one already on the desk. By the time a new device is unboxed, the majority of the carbon it will ever be responsible for has already been emitted — in the mines, fabs, and assembly lines that built it, long before it draws a single watt of office electricity. For phones and laptops, manufacturing, not use, is where the footprint lives.
This calculator separates the two things device spreadsheets routinely merge — the embodied carbon baked in at the factory and the use-phase electricity drawn in service — and shows you which one actually dominates your fleet.
For a typical office fleet, embodied (manufacturing) carbon is the larger share — often around 85–90% of a device’s annual footprint. A laptop’s manufacture emits roughly 200 kgCO₂e; its yearly electricity, far less. Extending device life is the single biggest reduction lever.
Accounting basis
Own-fleet: Scope 3 Cat 1 (embodied, amortised) + Scope 2 (use-phase). Sold-products: Cat 1 + Cat 11.
Two-phase model
Embodied (manufacturing, amortised over service life) reported separately from use-phase (electricity).
Use-phase chain
Active-use power (W) × annual hours ÷ 1000 × location-based grid. No PUE. No TEC.
Grid basis
Location-based · Ember Yearly Electricity · EPA eGRID (US) · DEFRA (GB) · 213 countries.
Factor sources
Embodied: Lövehagen 2023. Power: Kirkeby 2026 · DIMPACT 2022 · Digst 2025.
Device classes
Laptop · smartphone · tablet · monitor · desktop (tower) · all-in-one — embodied + use-phase for all six.
A laptop’s electricity over a year is modest. The carbon emitted to build it — mining, chip fabrication, assembly, shipping — is locked in before it reaches the desk, and on a low-carbon office grid it dwarfs the use-phase line. The practical consequence is counter-intuitive: buying fewer devices and keeping them longer cuts more carbon than chasing energy efficiency. This calculator surfaces both lines so you can see the split for your own estate rather than assume electricity dominates.
Account for the Cloud Behind Those Devices →
What “End-User Device Emissions” Covers — Embodied vs Use-Phase
End-user device emissions are the greenhouse gases attributable to the devices people use directly — the laptop, phone, monitor, and tablet at the working edge of an organisation, as opposed to the servers, networks, and data centres behind them. Every such device has two carbon phases that behave very differently and must be accounted separately.
The Two Carbon Phases
- Embodied carbon. The one-time emissions of producing the device — raw-material extraction, component and chip manufacture, assembly, and distribution to the point of sale. It is incurred before the device is ever switched on and is fixed at manufacture.
- Use-phase carbon. The recurring emissions from the electricity the device draws in operation, which depend on how the device is used and on the carbon intensity of the grid powering it.
Why Embodied Carbon Usually Dominates
For compact, high-value electronics, manufacturing is energy- and emissions-intensive while operating power is low. A smartphone draws around a watt in use; a laptop around ten. Across a year of normal office use, that electricity is modest — and on a clean grid it is small enough that the amortised manufacturing footprint outweighs it by a wide margin. The pattern is strongest for phones and laptops and weaker for always-on, higher-draw devices like desktops and large monitors, where the use-phase line grows relative to embodied. The calculator makes the split explicit for each device so you can see where your own fleet sits.
Scope Mapping — Where Devices Land in Your Inventory
Device emissions touch several inventory categories at once, and which ones depend on your relationship to the hardware. If you operate the devices, their embodied carbon is upstream Scope 3 Category 1 (purchased goods) — or Category 2 (capital goods) where your accounting treats them as capitalised assets — and their use-phase electricity is Scope 2. Devices used by home-working employees and powered by household electricity fall under Scope 3 Category 7 (employee commuting and remote work). If you manufacture and sell devices, the buyer’s electricity is your Scope 3 Category 11 (use of sold products). The same laptop can be Scope 2 for the company that runs it and Scope 3 Category 11 for the OEM that built it.
Included vs Excluded
| Included in this calculator | Excluded — report separately |
|---|---|
| Embodied carbon for six device classes (cradle-to-distribution) | End-of-life and e-waste treatment (use the end-of-life calculator) |
| Use-phase electricity via active-use power × hours × grid | Network, data-transfer, and CDN energy beyond the device |
| Amortised annual or full-life embodied, per reporting perspective | Data-centre and cloud compute behind consumed services |
| Location-based grid factors, 213 countries, with optional T&D gross-up | Peripherals without a dedicated row (thin-client, router, feature-phone) |
| Own-fleet (Scope 2 + 3) and sold-products (Scope 3) perspectives | Software, licensing, and embodied carbon of the workspace itself |
Embodied Carbon — The Manufacturing Footprint Per Device
Embodied carbon is the part of a device’s footprint that is already spent by the time it ships. Because it is fixed at manufacture, the only levers on it are buying fewer devices, keeping each one longer, and choosing refurbished over new — all addressed in §4. First, the benchmarks.
Per-Device Embodied Benchmarks
The calculator reads embodied carbon as a live MasterBrain factor for each device class, all drawn from a single named source — Lövehagen et al. (2023) — so the figures are internally consistent rather than stitched from mismatched manufacturer reports. The values below are illustrative of what the engine reads at the time of writing; the live values are authoritative.
| Device class | Embodied CO₂e | Default service life | Source |
|---|---|---|---|
| Laptop | 200 kg | 4 years | Lövehagen et al. (2023) |
| Smartphone | 50 kg | 3 years | Lövehagen et al. (2023) |
| Tablet | 100 kg | 4 years | Lövehagen et al. (2023) |
| Monitor | 100 kg | 6 years | Lövehagen et al. (2023) |
| Desktop (tower) | 350 kg | 5 years | Lövehagen et al. (2023) |
| All-in-one PC | 350 kg | 5 years | Lövehagen et al. (2023) |
The all-in-one reuses the desktop embodied row because the two share a manufacturing profile. The figures are cradle-to-distribution on an IPCC AR5-100 basis and represent the 2020 global shipment mix; they exclude use-phase electricity (counted separately in §3) and end-of-life treatment (out of scope here).
The embodied column is a 2020-basis figure. The paper’s first author confirms (personal communication, September 2026) that more recent data indicate a minor decrease across most of these device classes, and that an update of the ICT sector’s carbon footprint built on 2025 data — covering the same devices — is in preparation, which the authors hope to publish during 2027. Read the embodied numbers as a conservative-high 2020 baseline until then, and say so in any disclosure that carries them.
Why the Spread Is So Wide
A desktop’s embodied footprint is roughly seven times a smartphone’s — not because it is seven times the mass, but because larger devices carry more silicon, more metal, and larger displays, each carbon-intensive to produce. The phone’s small footprint per unit is deceptive, though: phones are replaced far more often than any other device, so their per-year amortised carbon climbs sharply once short refresh cycles are factored in. Embodied carbon per year, not per device, is the number that matters for an annual inventory.
Amortisation — Spreading Manufacturing Over Service Life
The calculator amortises embodied carbon straight-line over each device’s service life: a 200 kgCO₂e laptop on a four-year life carries 50 kgCO₂e per reporting year. This differs deliberately from the firm’s data-centre and AI-compute calculators, which amortise shared servers per running-hour over a life measured in operating hours. End-user devices are whole units owned for whole years, so the calculator divides embodied carbon by years, not hours. An alternative “full at purchase” basis books the entire embodied figure in the acquisition year — useful for procurement-cycle accounting — and the sold-products perspective reports full embodied plus full-life use-phase per device.
Use-Phase Emissions — Power × Hours × Grid
Use-phase carbon is the electricity a device draws while you operate it, converted to CO₂e through the grid factor. It is the smaller of the two phases for most office devices, but it is the one organisations instinctively reach for first — so it is worth getting the method right.
The Use-Phase Chain
kWh = active-use power (W) × annual active hours ÷ 1000 → CO₂e = kWh × grid factor × (optional T&D gross-up)
Two things distinguish this from a naïve estimate. First, the power values are active-use watts — the draw while the device is genuinely in use — not ENERGY STAR typical-energy-consumption (TEC) figures, which blend idle, sleep, and off states over a year and would double-count assumptions the calculator handles through the hours input. Second, no PUE multiplier is applied: PUE is data-centre overhead and does not belong on a device drawing power from a wall socket.
Device Power and Hours Reference
Active-use power coefficients are live MasterBrain reads, measured or framework-sourced per device. Default annual active hours are engine constants, adjustable for your own usage pattern.
| Device | Active-use power | Default annual hours | Power source |
|---|---|---|---|
| Laptop | 10.15 W (measured median) | 2,000 | Kirkeby & Lagermann (2026) |
| Smartphone | 1 W | 1,460 | DIMPACT (2022) |
| Tablet | 5.5 W | 1,095 | DIMPACT (2022) |
| Monitor | 31 W | 2,000 | Digst framework (2025) |
| Desktop (tower) | 87 W | 2,000 | Digst framework (2025) |
| All-in-one PC | 81 W | 2,000 | Digst framework (2025) |
The laptop figure is a measured median rather than a datasheet rating, which is why it sits well below the device’s nameplate power. Standby and sleep draw are excluded as de minimis for these device types. An optional transmission-and-distribution gross-up accounts for grid losses between generation and the socket, applied as 100 ÷ (100 − loss%).
Why Grid Location Matters Less Here
On a data-centre or AI-compute page, grid location is the dominant lever because the whole footprint is electricity. Here it is not — because embodied carbon usually dominates, swapping a device fleet from a high-carbon to a low-carbon grid moves the use-phase line substantially but the headline total only modestly. Grid choice still matters most for always-on, high-draw devices (desktops, large monitor arrays) and for organisations with unusually short device-replacement discipline, where the use-phase share is larger.
Lifespan and Refresh Cycles — The Single Biggest Lever
Because embodied carbon is fixed at manufacture and dominates the total, the most powerful thing an organisation can do is spread that fixed cost over more years. Extending service life is to device emissions what grid location is to data-centre emissions: the lever that outweighs everything else.
Replacement Cycle vs Amortised Annual Carbon
The arithmetic is direct. A 200 kgCO₂e laptop amortised over three years carries about 67 kgCO₂e per year; over five years, 40 kgCO₂e; over seven, under 29. Extending the refresh cycle from three to five years cuts the device’s annualised embodied carbon by roughly 40% — a larger reduction than any realistic efficiency gain on the use-phase line, which is itself the smaller phase to begin with.
You cannot make a manufactured laptop un-manufactured, but you can make its carbon work for more years. A device kept five years instead of three carries 40% less embodied carbon per year — and that embodied line is the majority of the footprint. No power-management setting, no efficient-charger choice, no grid-shift on the use-phase line comes close to the leverage of simply not replacing the device.
The Repair, Reuse, Refurbish Hierarchy
- Extend first. The lowest-carbon device is the one you already own, kept in service longer through repair, battery replacement, and resisting cosmetic-driven refresh.
- Reuse second. Redeploy retired devices internally — a laptop too slow for engineering may serve perfectly for reception or kiosk duty.
- Refurbish third. When buying, refurbished devices carry a fraction of new embodied carbon because the manufacturing emission is already spent; only refurbishment overhead is added.
- Replace last. A new device is the highest-carbon option and should be the final resort, justified by genuine capability needs rather than depreciation schedules.
Fleet Modelling — From One Device to a Corporate Estate
A single device is a rounding error; a fleet of thousands is a material inventory line. The calculator scales from per-device factors to a whole estate by multiplying each device class by its count and summing the embodied and use-phase lines separately.
Per-Device → Per-Employee → Fleet
The practical modelling unit for most organisations is the employee. A typical knowledge worker carries a laptop, a phone, and one or two monitors; multiplying a per-employee device bundle by headcount gives a defensible first-pass estate footprint. Refine it by replacing default counts with your actual asset register, and default service lives with your real refresh policy — the asset register is usually the highest-quality data an IT function already holds.
Home-Working vs Office Allocation
The split between office and remote work changes the scope mapping, not the physics. Electricity drawn by a device plugged in at an office you operate is Scope 2; the same device powered from an employee’s home is Scope 3 Category 7. The employee remote-work calculator handles the home-energy allocation; this calculator gives you the device-power figure to feed into it. Embodied carbon stays with whoever procured the device regardless of where it is used.
Worked Example — A Mixed Fleet, Step by Step
This example reproduces the calculator’s default boot state: a small mixed fleet on the UK grid, own-fleet perspective, embodied carbon amortised, laptop on the measured-power basis, with transmission losses off. All factors are live MasterBrain reads; the service lives and hours are the engine’s documented per-device defaults from §2 and §3.
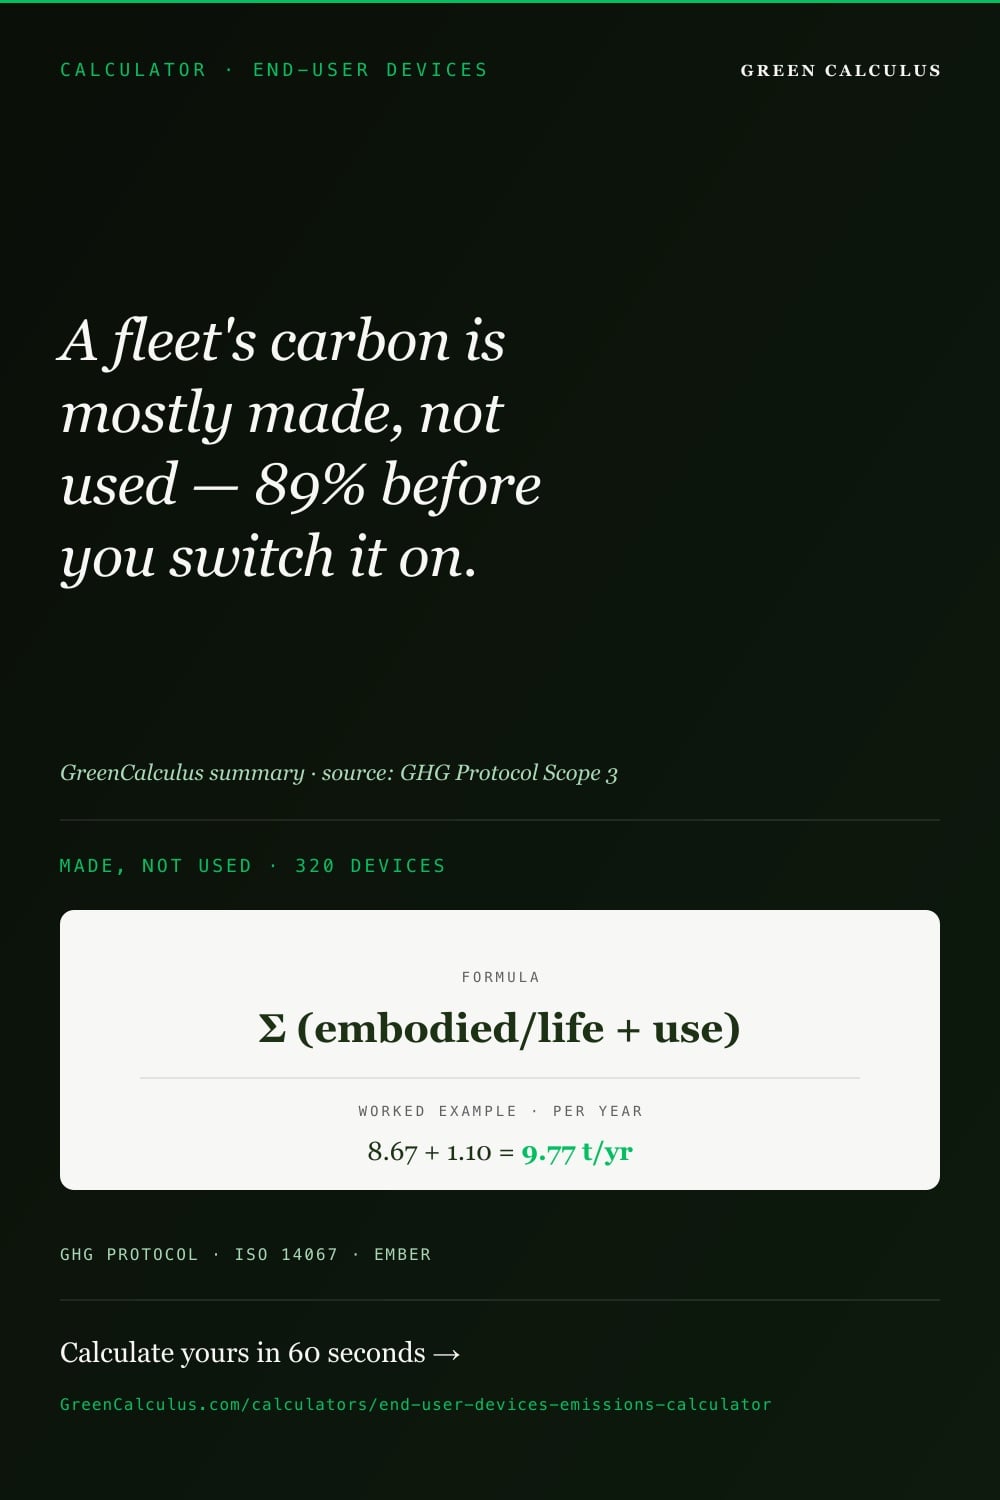
A fleet of 100 laptops, 100 monitors, and 120 smartphones on the UK grid carries an amortised embodied line of 8.667 tCO₂e/yr and a use-phase line of 1.101 tCO₂e/yr from 8,405 kWh of electricity. The fleet total is 9.77 tCO₂e/yr — of which embodied carbon is 88.7%. Manufacturing, not electricity, is the overwhelming share.
| Line | Embodied /yr | Use-phase /yr | Use-phase kWh/yr |
|---|---|---|---|
| 100 × Laptop | 5,000.0 kg | 265.8 kg | 2,030 |
| 100 × Monitor | 1,666.7 kg | 812.0 kg | 6,200 |
| 120 × Smartphone | 2,000.0 kg | 22.9 kg | 175 |
| Fleet (320 devices) | 8,666.7 kg | 1,100.8 kg | 8,405 kWh |
The 88.7% Split, Visualised
The whole point of separating the two lines is to see how lopsided the split is. For this fleet, embodied carbon is nearly nine-tenths of the annual footprint:
Broken down by device line, the laptops carry the most carbon — driven by their embodied figure — followed by the monitors (whose higher power draw lifts their use-phase share) and the smartphones:
Audit trail note: Sources — Lövehagen et al. (2023) embodied factors (laptop 200 kg, monitor 100 kg, smartphone 50 kg); active-use power Kirkeby & Lagermann (2026, laptop 10.15 W), Digst (2025, monitor 31 W), DIMPACT (2022, smartphone 1 W); UK grid 0.13096 kgCO₂e/kWh (location-based, DEFRA via Ember layer). Service lives: laptop 4 yr, monitor 6 yr, smartphone 3 yr (straight-line ÷ years). Annual active hours: laptop/monitor 2,000, smartphone 1,460. T&D gross-up off. Own-fleet perspective: embodied = Scope 3 Cat 1 (amortised), use-phase = Scope 2, reported annual. Embodied and use-phase lines are reported separately and not netted. The 9.77 tCO₂e/yr figure is the engine’s default-boot output recorded on the review date.
Standards and Methodology — How These Numbers Are Grounded
The calculator’s credibility rests on traceable inputs and a published method. Every factor is a live MasterBrain read; every device factor cites a named study. The relevant external references fall into three groups.
Accounting Standard
Scope assignment follows the GHG Protocol Scope 3 Standard for embodied carbon (Category 1, or Category 2 for capitalised assets) and for sold-product use-phase (Category 11), and the GHG Protocol Scope 2 Guidance for own-operated device electricity. The reporting-perspective toggle is what moves the use-phase line between Scope 2 and Scope 3 Category 11.
Life-Cycle Assessment Basis
Embodied carbon is a product-LCA quantity, governed in principle by ISO 14040/14044 (LCA principles and framework) and ISO 14067 (product carbon footprint). The Lövehagen et al. (2023) factors the calculator reads are a supply-chain-approach study allocated to the ITU-T L.1450 user-equipment categories and validated against published PCFs and LCAs, so they sit within this standards framework rather than outside it.
Grid and Energy Basis
Use-phase electricity is converted with location-based grid factors from Ember Yearly Electricity globally, with the US drawing on EPA eGRID and Great Britain on DEFRA. The full derivation, including the amortisation choice and the active-use-power basis, is documented in the end-user devices methodology page.
Relationship to the Other Digital Models
Device emissions connect to several adjacent models. The IT asset and e-waste calculator extends the same embodied-carbon basis across an asset’s full cradle-to-grave lifecycle, while the video streaming calculator and the website and digital carbon calculator both model the device as the consumption end of the digital delivery chain. They share device-energy and embodied-factor lineage, so the estimates stay mutually consistent. See also the Bitcoin emissions calculator for the other headline energy-intensive workload.
Reducing Device Emissions — Levers That Move the Number
The reduction levers are not equal. Because embodied carbon dominates, anything that reduces the number of devices manufactured or extends their working life outranks any use-phase efficiency play. Ranked by leverage:
1 · Extend service life
Three to five years cuts annualised embodied carbon ~40%. The single largest lever, because embodied dominates the total.
2 · Buy refurbished
Refurbished devices carry a fraction of new embodied carbon — the manufacturing emission is already spent.
3 · Reduce device count
Fewer devices per employee, shared and pooled where possible. Every device avoided avoids its whole embodied footprint.
4 · Right-size the device
Match the device to the task — a laptop where a desktop isn’t needed; a smaller monitor where a large one isn’t used.
5 · Grid location
Moves the use-phase line, which is the smaller phase. Matters most for always-on, high-draw devices.
6 · Power management
Sleep policies and reduced active hours trim use-phase energy. Real, but the smallest lever on the total.
The practical implication inverts the usual instinct: a team focused on power-saving settings while replacing laptops every two years is optimising the small phase and inflating the large one. Keep the device longer first; that decision alone can outweigh every use-phase efficiency measure combined.
Audit Checklist — Common Device-Emissions Reporting Errors
The errors below are the recurring sources of overstated, understated, or unverifiable device-emissions figures. The calculator guards against most of them; spreadsheet-based inventories rarely do.
- Counting electricity but not manufacturing. The most common error. Use-phase electricity is the smaller phase for most devices; omitting embodied carbon understates the footprint by the majority of its value. Report both lines.
- Applying PUE to device electricity. PUE is data-centre overhead. Multiplying a device’s wall-socket draw by a PUE figure inflates the use-phase line with overhead that does not exist for end-user hardware.
- Booking full embodied carbon every year. Embodied carbon is amortised over service life for annual reporting — a four-year laptop carries a quarter of its manufacturing footprint each year, not all of it. The “full at purchase” basis is for acquisition-year accounting, not recurring inventory.
- Using TEC where active-use power is required. ENERGY STAR typical-energy-consumption blends usage states over a year and double-counts assumptions the hours input already handles. Use active-use watts × your own hours.
- Misplacing the scope for home-working devices. A device powered at an employee’s home is Scope 3 Category 7, not Scope 2. Allocating it to Scope 2 misstates both categories.
- Confusing own-fleet and sold-products perspectives. Own-fleet use-phase is Scope 2 and annual; sold-products use-phase is Scope 3 Category 11 and full-life. Mixing the two produces a number that is neither.
- Ignoring refresh-cycle data quality. Default service lives are class averages; your asset register holds the real refresh policy. An auditor will ask which lives you used — state them.
- Double-counting devices across calculators. The cloud and data-centre energy behind a device’s services belongs to those calculators, not here. Counting it in both inflates the total.
Data Sources, Factor Provenance, and Uncertainty
Factor Provenance
All factors are live MasterBrain v2026.284 reads traceable to primary sources:
- Embodied carbon (all device classes) — Lövehagen et al. (2023), a supply-chain-approach study allocated to the ITU-T L.1450 user-equipment categories, AR5-100, cradle-to-distribution.
- Laptop active-use power — Kirkeby & Lagermann (2026), empirically measured median.
- Smartphone and tablet power — DIMPACT (2022).
- Monitor, desktop, and all-in-one power — Digst framework (2025).
- Country grid factors — Ember Yearly Electricity; US via EPA eGRID; GB via DEFRA.
- Transmission & distribution losses — per-country loss rates, applied as an optional gross-up.
Uncertainty
| Input | Nature of uncertainty |
|---|---|
| Embodied carbon | 2020 global shipment-mix averages; a specific model’s PCF may differ. Largest driver of the total. |
| Service life | Class-average defaults; real refresh policy varies widely and directly scales amortised embodied carbon. |
| Active-use power | Representative coefficients; actual draw varies by workload and configuration. |
| Annual active hours | Default usage assumptions; replace with your own where measured. |
| Grid factor | Annual location-based average; real intraday intensity varies. Affects the smaller use-phase phase. |
| GWP basis | Device rows are AR5-100; the data-version footer records the basis. Do not blend with AR6 totals. |
Update Schedule
Grid factors refresh with each Ember, eGRID, and DEFRA release; device factors track updates to the underlying studies. The data version badge in the calculator footer always reflects the live MasterBrain version in use.
Frequently Asked Questions
For a typical office laptop, manufacturing dominates. Building the device emits roughly 200 kgCO₂e, fixed before it is ever switched on, while its annual electricity is comparatively small — especially on a low-carbon grid. Across the device’s life the embodied footprint usually outweighs the use-phase, which is why extending service life cuts more carbon than any efficiency measure. The calculator reports the two phases separately so you can see the split for your own fleet.
It depends on the line and the setting. Embodied (manufacturing) carbon is Scope 3 Category 1 — or Category 2 if you capitalise the assets. Use-phase electricity for devices powered at an office you operate is Scope 2; for devices powered at an employee’s home it is Scope 3 Category 7. If you manufacture and sell devices, the buyer’s electricity is your Scope 3 Category 11. The same laptop can be Scope 2 for the company running it and Scope 3 Category 11 for the OEM that built it.
PUE — Power Usage Effectiveness — is a data-centre metric capturing cooling and power-distribution overhead on top of IT load. An end-user device draws power directly from a wall socket and carries no such facility overhead, so applying PUE would inflate its electricity with overhead that does not exist. PUE belongs on the data-centre and AI-compute calculators, not here.
A lot, because the lever acts on the dominant phase. A 200 kgCO₂e laptop amortised over three years carries about 67 kgCO₂e per year; over five years, 40 kgCO₂e — roughly a 40% cut in annualised embodied carbon. Since embodied carbon is the majority of the footprint, that single decision outweighs realistic use-phase efficiency gains. Keeping devices longer is the highest-leverage reduction available.
TEC (typical energy consumption) blends idle, sleep, and off states across a year into one figure. The calculator instead multiplies active-use power by an explicit annual-hours input, which lets you model your own usage pattern rather than inherit a fixed annual assumption. Combining TEC with an hours input would double-count the idle-time assumptions already baked into TEC, so the model uses active-use watts measured or framework-sourced per device.
No — end-of-life and e-waste treatment are out of scope here and reported through the dedicated end-of-life calculator. The embodied figures are cradle-to-distribution: they cover manufacturing and shipping up to the point of sale, but not disposal, recycling, or recovery. This keeps the two phases this calculator does cover — embodied and use-phase — clean and auditable.
Enter a count for each device class; the calculator multiplies per-device factors by the counts and sums the embodied and use-phase lines separately. The most reliable approach is to feed it your IT asset register — actual device counts and your real refresh policy as service lives — rather than per-employee estimates. A per-employee bundle (laptop, phone, monitor) times headcount gives a defensible first pass before the register is available.
Because the toggle changes what the number means. Own-fleet reports an annual figure with embodied carbon amortised over service life (Scope 3 Category 1) and use-phase electricity as Scope 2. Sold-products reports a per-device, full-life figure with use-phase electricity as Scope 3 Category 11 — the footprint you pass to whoever buys the device. They answer different questions, so the totals legitimately differ.
Methodology Notes and Limitations
Two phases, reported separately. Embodied (manufacturing) and use-phase (electricity) carbon are distinct and never blended into a single hidden total. For most fleets, embodied is the larger phase — treat it as the main line.
Embodied carbon is amortised over years, not hours. End-user devices are whole units owned for whole years, so the calculator divides embodied carbon by service-life years — unlike the data-centre and AI-compute calculators, which amortise shared servers per running-hour. A “full at purchase” basis is available for acquisition-year accounting.
The reporting perspective changes scope and time basis. Own-fleet: Scope 3 Cat 1 (amortised) + Scope 2, annual. Sold-products: Scope 3 Cat 1 + Scope 3 Cat 11, per-device full-life. The headline number’s meaning depends on the toggle.
No PUE; active-use power, not TEC. PUE is data-centre overhead and is never applied. Use-phase energy is active-use watts × annual hours, with standby excluded as de minimis.
Factors are 2020-mix averages. Embodied figures represent the 2020 global shipment mix on an AR5-100 basis; a specific model’s published PCF may differ. Service lives and hours are class-average defaults — replace them with your asset-register data for an audit-grade result.
End-of-life is out of scope. Disposal, recycling, and recovery are reported separately through the end-of-life calculator. The embodied figures here stop at distribution.