
How Many Data Centers Are in the US? Every Count, by State

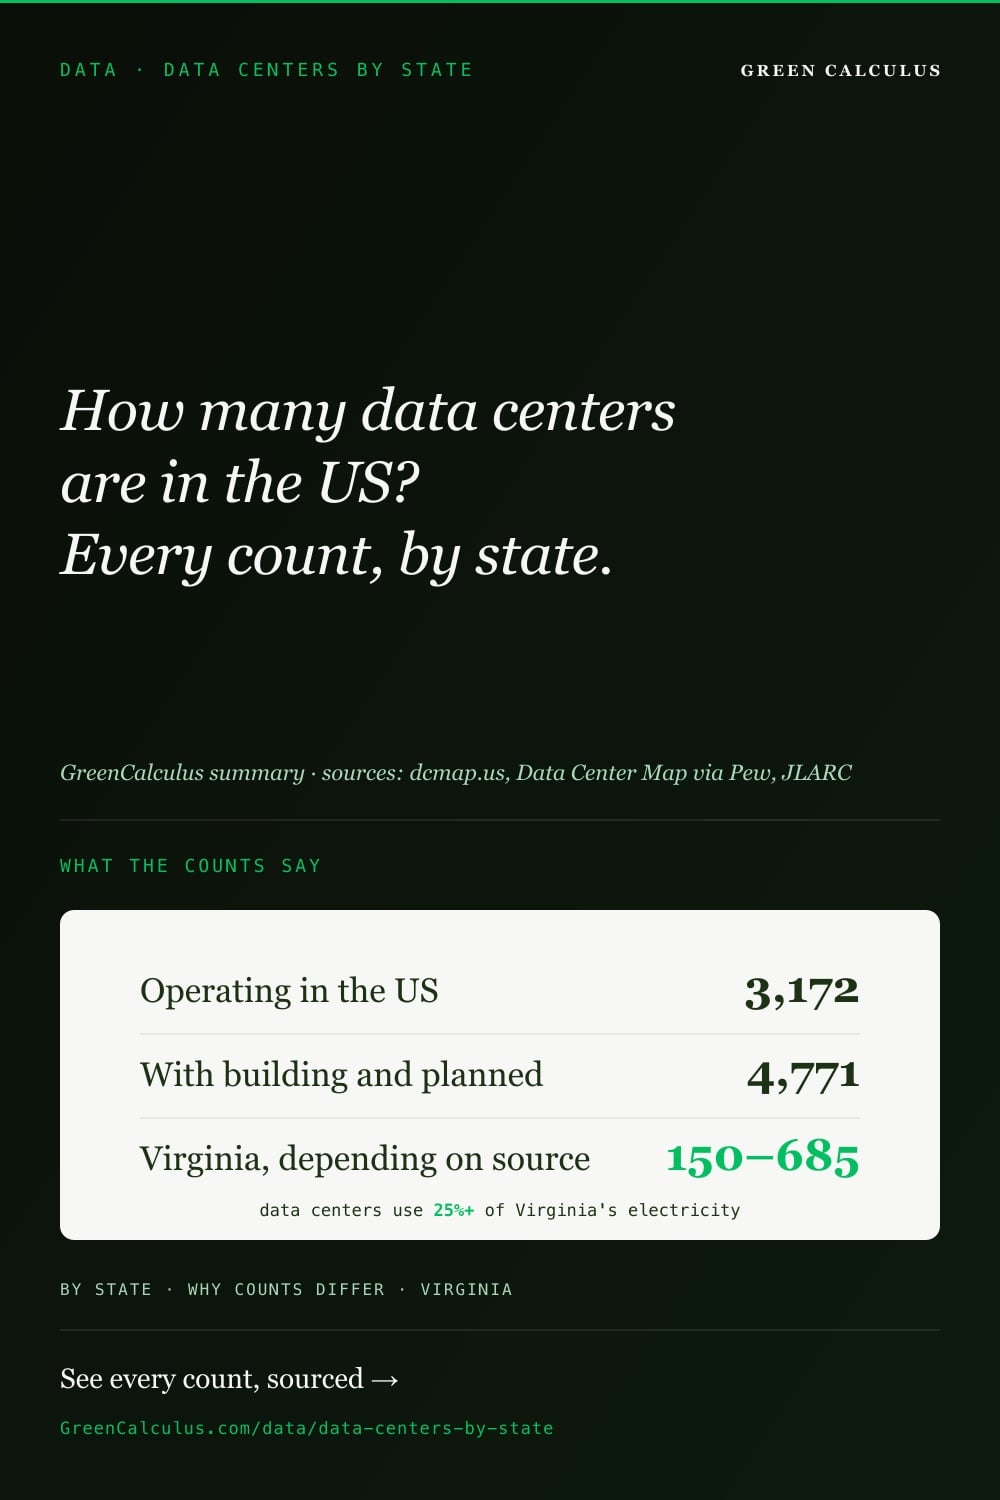
Ask how many data centers the US has and you will get a different answer from every source, because nobody official counts them. The counts disagree by hundreds even for a single state: Virginia has anywhere from 150 to 685, depending on whose list you read and whether a campus counts as one data center or several. This page puts every published count side by side, says what each one counts, and shows where the numbers agree.
The US has about 3,000 to 3,200 operating data centers, and about 4,600 to 4,800 counting those under construction or planned (dcmap.us, October 2026; Data Center Map via Pew Research, February 2026). Virginia has the most on most counts, 320 to 398 operating, followed by Texas and California. Data centers used 4.7% of US electricity in 2024, and use more than 25% of Virginia’s today (EPRI).
How many data centers are in the US?
There is no government count of data centers. The figures people quote come from private trackers that compile listings from operators, planning filings and news. The two that publish US totals agree closely on operating sites and less on the pipeline:
| Source | Operating | Planned or building | As of |
|---|---|---|---|
| dcmap.us | 3,172 | 1,599 | October 2026 |
| Data Center Map, via Pew Research | 3,068 | 1,556 | February 2026 |
| US Census Bureau (hosting businesses) | 18,544 | — | March 2023 |
dcmap.us splits its pipeline into 400 under construction and 1,199 planned, and lists another 79 paused projects. Pew combines “under construction”, “planned” and “land banked” and drops cancelled or uncertain projects; its totals are the sum of its four regions. The Census figure is not a count of data centers at all (see below).
Data centers by state
Pew Research published the fullest state table, from Data Center Map’s listings on 19 February 2026. These are the 15 states with the most data centers, operating plus planned:
| State | Operating | Planned | Total |
|---|---|---|---|
| Virginia | 398 | 287 | 685 |
| Texas | 296 | 170 | 466 |
| California | 277 | 54 | 331 |
| Illinois | 139 | 123 | 262 |
| Georgia | 94 | 141 | 235 |
| Ohio | 166 | 57 | 223 |
| Arizona | 98 | 86 | 184 |
| New York | 148 | 6 | 154 |
| Oregon | 115 | 27 | 142 |
| Washington | 124 | 11 | 135 |
| Pennsylvania | 78 | 51 | 129 |
| Florida | 120 | 8 | 128 |
| North Carolina | 72 | 41 | 113 |
| Iowa | 64 | 41 | 105 |
| Indiana | 38 | 54 | 92 |
Two things stand out. Georgia and Indiana already have more data centers planned than operating, and Illinois nearly so. New York, Florida and Washington have big operating fleets but almost nothing in the pipeline.
Pew published only these 15 states. For any other state, dcmap.us lists counts state by state, and the open dataset below holds the Census count of hosting businesses for all 50 states and DC (a different measure; see why).
Why the counts differ
- What counts as one data center. A campus of eight buildings can be one entry or eight. dcmap.us says a campus, a building or a hall can each be an entry. In Virginia, JLARC counted about 150 sites but around 340 buildings.
- Operating or planned. Some totals include sites that are only land banked or announced. Pew’s Virginia total of 685 includes 287 planned; its operating count is 398.
- Size. Some lists include small server rooms in office buildings; others only colocation and hyperscale sites.
- Date. Hundreds of projects are added each year, so a count from early 2026 is already out of date.
- The Census figure is about businesses. Its 18,544 “establishments” in industry code 518210 are hosting, data processing and cloud businesses, many of them offices with no data hall. That is why California, not Virginia, tops the Census list, with 2,698 establishments against Virginia’s 641.
Where the trackers agree is the ranking: Virginia first, Texas second, then California, and the South taking most of the new building.
Data centers in Virginia
Virginia has more data centers than any other state on most counts, but the number depends on the source:
| Source | Count | What it counts |
|---|---|---|
| JLARC, Virginia’s legislative watchdog (2024) | ~150 | Sites (campuses), operating |
| Visual Capitalist (April 2026) | 320 | Operating |
| JLARC (2024) | ~340 | Buildings on those sites |
| Data Center Map via Pew (February 2026) | 398 | Operating |
| dcmap.us (October 2026) | 591 | Operating, building and planned |
| Data Center Map via Pew (February 2026) | 685 | Operating and planned |
Virginia’s own legislative watchdog, the Joint Legislative Audit and Review Commission (JLARC), reported in December 2024 that Northern Virginia is “the largest data center market in the world”, with 13% of all reported operational data center capacity worldwide and 25% of capacity in the Americas. It counted about 150 data center sites holding around 340 buildings, using about 5,050 MW of power, roughly the electricity needs of 2 million Virginia households. 80% of the industry is in three Northern Virginia localities: Loudoun, Prince William and Fairfax, with Loudoun alone about half. Its other findings:
- Electricity. Unconstrained demand for power in Virginia would double within ten years, driven mainly by data centers. Building enough generation and transmission even for half of that demand would be difficult.
- Bills. Data centers currently pay their full cost of service, but a typical Dominion Energy household could see generation and transmission costs rise by $14 to $37 a month by 2040, in today’s dollars.
- Water. Use is “currently sustainable, but use is growing and could be better managed”. The industry used about 2.1 billion gallons in 2023, just over a third of it reclaimed water. Most data centers use about as much water as a large office building or less, but 11 buildings each used over 50 million gallons, one of them 243 million. Google alone reported that its four Virginia sites (Ashburn, Bristow, Leesburg and Sterling) consumed 711 million US gallons in 2025; see data center water usage.
- Jobs and taxes. The industry contributes an estimated 74,000 jobs and $9.1 billion of GDP a year, mostly from construction. Local tax revenue from data centers ranges from under 1% to 31% of a locality’s total revenue.
- Neighbours. One-third of data centers are near residential areas, and backup diesel generators produce less than 4% of Northern Virginia’s nitrogen oxide emissions.
Where new data centers are going
Pew’s analysis of the same listings found that the next wave is not where the last one was. 87% of operating data centers are in urban areas, but 67% of planned ones are rural, and 39% of planned data centers are in counties that have none today. The South has about half of planned data centers (754 of 1,556) and the South and Midwest together about three quarters. EPRI names Ohio, Indiana, Pennsylvania, Louisiana and Mississippi as states where new capacity is emerging “where there is currently little operating capacity”, as developers look for power and land.
How much electricity data centers use, by state
US data centers used 192 TWh of electricity in 2024, 4.7% of the country’s total, according to Lawrence Berkeley National Laboratory. EPRI puts the share at 4% to 5% and projects 9% to 17% by 2030. The load is far from even:
- Virginia: data centers already use more than 25% of the state’s electricity, the highest share of any state, and EPRI projects 39% to 57% by 2030.
- Other states: in several states the share already exceeds 10%, and in EPRI’s medium scenario eight states pass 20% by 2030. EPRI expects New Mexico, Ohio and Pennsylvania, and states with very little capacity today such as Indiana, Louisiana and Mississippi, to pass 10% by 2030.
To estimate one site’s electricity, cost and emissions in any state, use the calculator on data center energy consumption. For what the companies building AI data centers report, see is AI bad for the environment?
Provenance and data access
| Figures | Source |
|---|---|
| State, regional and US counts; urban and rural shares | Seets and Radde, Most new data centers in the US are coming to rural areas, Pew Research Center (13 April 2026), from Data Center Map listings as of 19 February 2026. US totals are GreenCalculus sums of Pew’s four regions. |
| US, Virginia and Texas counts, October 2026 | dcmap.us (updated October 2026). |
| Virginia, 320 operating | Visual Capitalist, as reported by the Washington Examiner (9 April 2026). |
| Establishments by state | US Census Bureau, County Business Patterns 2023, NAICS 518210. |
| Electricity shares and projections | EPRI, Powering Intelligence 2026 and its summary brief. |
| US electricity 2024 | Lawrence Berkeley National Laboratory, United States Data Center Energy Usage Report: 2025 Update (June 2026). |
| Virginia sites, buildings, power, bills, water, jobs | JLARC, Data Centers in Virginia (Report 598, 9 December 2024), summary and chapters 1 and 5. |
| Google’s Virginia water | Google 2026 Environmental Report, water use by data center location; GreenCalculus sum of four sites. |
All 128 counts and estimates are in the open dataset US Data Centers by State (CSV and JSON, CC BY 4.0, DOI 10.5281/zenodo.23557980; source on GitHub), each with what its source counts and the date it describes. Counts change monthly; we will refresh this page and the dataset every quarter.
Frequently asked questions
About 3,000 to 3,200 operating data centers: dcmap.us counted 3,172 in October 2026, and Data Center Map’s listings gave 3,068 in February 2026. Counting those under construction or planned, the total is about 4,600 to 4,800. There is no official government count.
Virginia, on every data center tracker we checked: 398 operating and 685 including planned (Data Center Map via Pew, February 2026). Texas is second with 296 operating and 466 in total, then California with 277 and 331.
Between 320 and 398 operating, depending on the tracker, and 591 to 685 including those under construction or planned. Virginia’s JLARC counted about 150 sites with around 340 buildings in 2024. Northern Virginia is the largest data center market in the world, with 13% of reported global operational capacity (JLARC, 2024).
Because trackers count different things: a campus can be one entry or several buildings, some totals include planned and land-banked sites, some include small server rooms, and the counts are taken at different dates. The Census count of 18,544 is of hosting and data processing businesses, not data center buildings.
More than 25%, the highest share of any state, according to EPRI, which projects 39% to 57% by 2030. Nationally, data centers used 4.7% of US electricity in 2024 (Lawrence Berkeley National Laboratory).
Mostly in the rural South and Midwest. Pew found 67% of planned data centers are in rural areas, while 87% of operating ones are in urban areas, and the South has about half of the pipeline. Georgia, Indiana and Illinois have nearly as many or more planned than operating.
Version history
- 1.0 (22 October 2026): first published.