
Data Center Water Usage: How Much Water Data Centers Use

Google’s data centers consumed 10.5 billion gallons of water in 2025. Most operators publish far less than that, and almost nobody counts the water used to generate a data center’s electricity, which on an average US grid is larger than the cooling water itself. This page gives the figures operators actually disclose, explains what they measure, and lets you calculate both parts for any site.
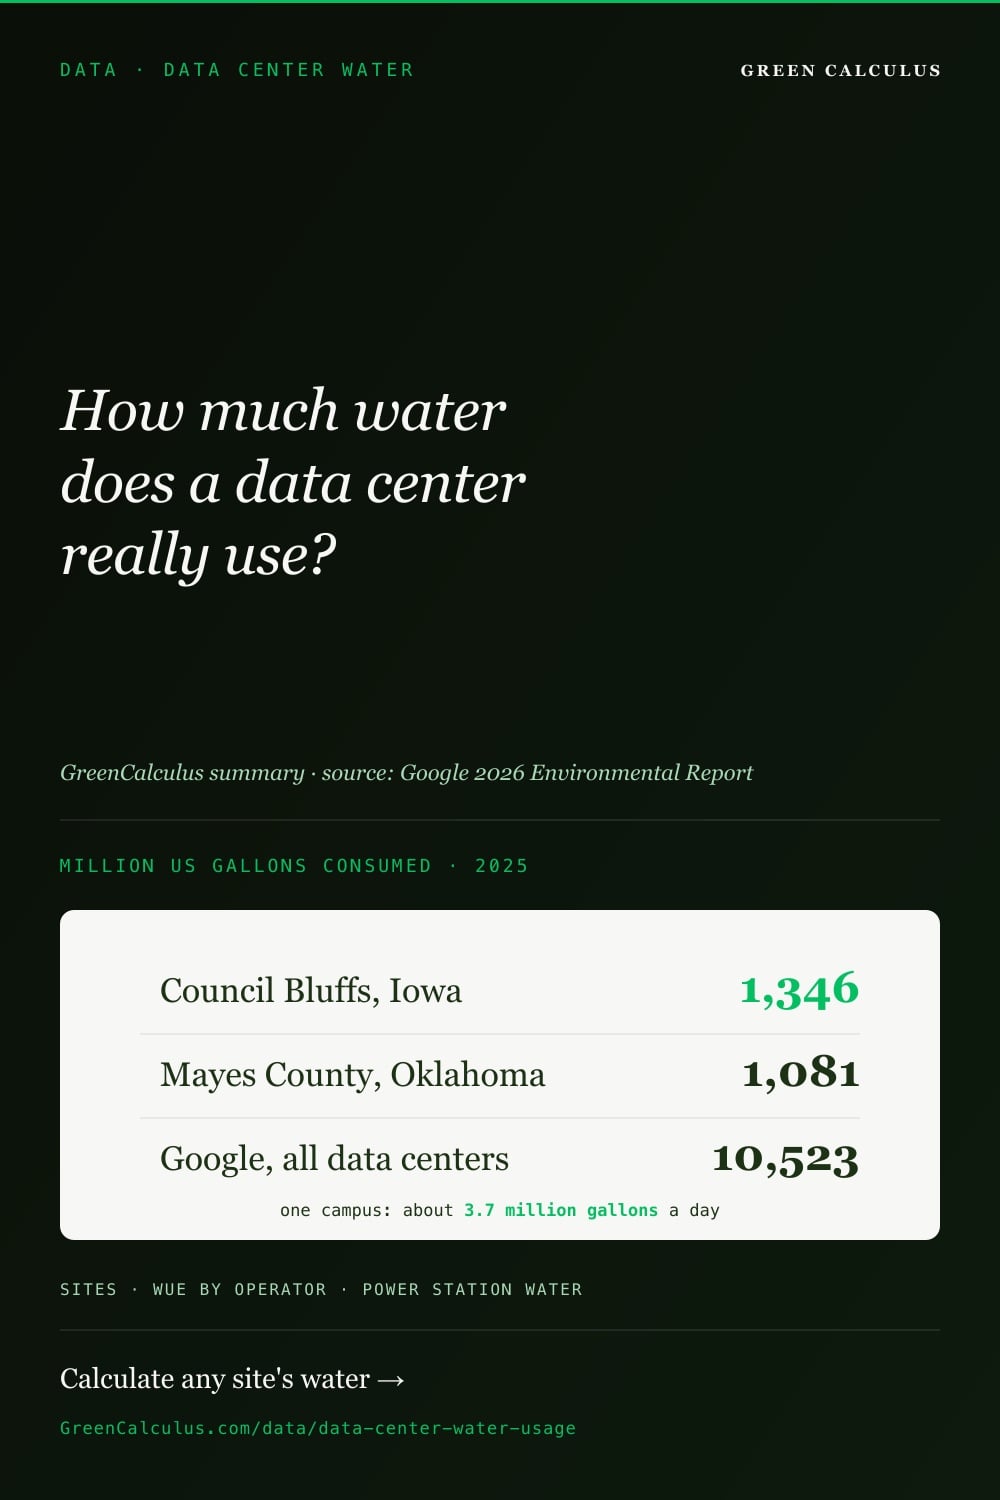
A large data center can consume hundreds of millions to over a billion gallons of water a year. Google’s most water-intensive campus, Council Bluffs, Iowa, consumed 1,346 million gallons in 2025, about 3.7 million gallons a day. Per unit of computing, operators report 0.12 litres per kWh of IT energy (AWS, 2025) to 0.91 (Equinix, 2025); the EU average for reporting sites that use water was 0.58 in 2024. Add the water used to generate the electricity and, on an average US grid, the total rises several times over.
Data center water calculator
Enter the IT load, PUE and cooling, and the calculator splits the yearly water into what the site uses and what its electricity supply uses. Work out the PUE first with the PUE calculator if you need it.
US sites can pick their eGRID subregion for a closer figure.
Enter the IT load above to calculate the site’s water use
Results show on-site and electricity water separately, per year and per day, with a household comparison and the full calculation.
Indicative estimate of a data center’s annual water use in two parts. On-site water = IT energy × WUE (litres per kWh of IT energy, the Water Usage Effectiveness metric of The Green Grid and ISO/IEC 30134); the presets are operators’ own published figures for whole fleets or portfolios, not for any one site. Electricity water = facility energy (IT × PUE) × the grid-average water consumed per kWh, from the World Resources Institute and WSP (2020, CC BY 4.0), based on 2016 generation mixes and including evaporation from hydropower reservoirs. On-site water as reported is mostly withdrawal (water drawn in); electricity water is consumption (water not returned), so the two parts measure slightly different things and are shown separately. The result does not assess local water stress, the water source (potable, reclaimed or seawater) or water embodied in equipment. Reconcile against metered water and energy data.
How much water a data center uses per day
Google is the only large operator that publishes water by site. In 2025 its data centers withdrew 13,562 million US gallons, discharged 3,039 million and consumed 10,523 million. The ten sites that consumed the most:
| Site | Withdrawn | Consumed | Consumed per day |
|---|---|---|---|
| Council Bluffs, IA | 1,746.4 | 1,346.0 | 3.69 |
| Mayes County, OK | 1,396.7 | 1,081.4 | 2.96 |
| Berkeley County, SC | 988.5 | 901.7 | 2.47 |
| New Albany, OH | 1,008.1 | 835.7 | 2.29 |
| Papillion, NE | 677.8 | 548.2 | 1.50 |
| The Dalles, OR | 654.3 | 469.0 | 1.28 |
| St. Ghislain, Belgium | 714.4 | 450.8 | 1.24 |
| Montgomery County, TN | 499.5 | 424.7 | 1.16 |
| Eemshaven, Netherlands | 532.2 | 405.7 | 1.11 |
| Douglas County, GA | 440.6 | 367.1 | 1.01 |
At the other end, several Google sites consumed almost nothing: Dublin, Ireland 0.1 million gallons, Frankfurt, Germany 0.2, and Hamina, Finland 0.4. Climate and cooling design explain most of the gap. All 42 rows, with withdrawal and discharge, are in the open dataset.
WUE: water per kWh, by operator
Water Usage Effectiveness (WUE) divides the litres a site uses by the kWh delivered to its IT equipment. It is defined in ISO/IEC 30134-9 and by The Green Grid. These are the figures the operators publish themselves:
| Publisher | What it covers | Period | WUE |
|---|---|---|---|
| Amazon Web Services | Global average (water withdrawn) | 2025 | 0.12 |
| Meta | Owned data centers (water withdrawn) | 2024 | 0.19 |
| Microsoft | Global, owned datacenters | FY25 (Jul 2024 to Jun 2025) | 0.27 |
| European Commission | Average of EU reporting sites that use water | 2024 | 0.58 |
| Digital Realty | Global portfolio | 2025 | 0.59 |
| Equinix | Global portfolio | 2025 | 0.91 |
AWS regions ranged from 0.02 to 2.85 L/kWh in 2025, with the highest in hot, humid Asia-Pacific regions (Jakarta 2.85, Singapore 1.57, Tokyo 1.22). The Climate Neutral Data Centre Pact targets 0.4 by 2040; the European Commission found most reporting sites above it. Meta’s data centers withdrew 4,145 megalitres (about 1,095 million gallons) in 2024 and consumed 2,974 (about 786 million gallons); its WUE fell from 0.30 in 2020 to 0.19.
Withdrawal, consumption and discharge
Most headlines mix these up. Withdrawal is water drawn in. Discharge is water returned, usually to the sewer or a river. Consumption is the difference: water that does not come back, mostly because it evaporated in cooling towers. For Google in 2025, about 22% of the water withdrawn was returned and 78% was consumed. Consumption is the better measure of the pressure a site puts on local water; withdrawal matters when supply is tight.
WUE figures are usually based on water drawn in, so they are closer to withdrawal than to consumption. Check each publisher’s definition before comparing.
The water you don’t see: electricity
Power stations use water too, mainly for cooling and through evaporation from hydropower reservoirs. The World Resources Institute and WSP (2020) estimate the water consumed per kWh of grid electricity: 3.13 litres in the United States, 2.33 in the United Kingdom, 1.12 in Malta and 18.60 in Brazil, where hydropower dominates. These figures use 2016 generation mixes.
A 10 MW IT load running all year uses 87,600 MWh of IT energy. At the EU-average WUE of 0.58 L/kWh, the site uses 50.8 million litres (13.4 million gallons). At PUE 1.2 the whole site draws 105,120 MWh, and on the average US grid that electricity consumes 329 million litres (87 million gallons). The total is about 100 million gallons a year, and 87% of it is upstream in the electricity supply.
Operators’ published water figures, including Google’s, AWS’s and Microsoft’s, cover on-site water only. Wind and solar power use almost no water to generate, so a site supplied directly by them avoids most of this upstream water. For how much electricity data centers use, and a calculator for any site, see data center energy consumption.
Cooling trades water for energy
Evaporative cooling uses water but saves electricity; Google’s 2026 Environmental Report says water cooling requires less energy than air-cooling technologies. A site that switches to dry cooling lowers its WUE but usually raises its PUE, and with it the electricity water and emissions. Compare both metrics together: see the PUE calculator and its published PUE figures.
Location matters more than litres
A million gallons in a wet basin and in a drought-prone one are different stories. Google reports that in 2025, 72% of its freshwater withdrawal came from sources at low risk of depletion or scarcity, 15% from medium risk and 13% from high risk. The World Resources Institute’s Aqueduct maps water stress for any location; check the basin before judging a site by its volume.
The water source matters as well. Of the 13,562 million gallons Google’s data centers withdrew in 2025, 10,949 million was potable water. Its Douglas County, Georgia campus drew 394.3 of its 440.6 million gallons from reclaimed wastewater.
AI and water
AI adds water through the same two routes: cooling the accelerators and generating their electricity. Google estimates that a median Gemini text prompt consumed 0.26 millilitres of water in May 2025, based on its fleet-average WUE. That figure covers on-site water only. Every published per-prompt figure, why they differ, and a calculator that adds the power station water are on how much water AI uses. For energy and emissions per prompt, see the carbon footprint of AI.
Provenance and data access
| Figures | Source |
|---|---|
| Google site water, 2025 | Google 2026 Environmental Report, table “Water use by data center location” (2025 metrics subject to third-party limited assurance). |
| Operator WUE | AWS Sustainability (2025) and AWS Region table; Microsoft Datacenters: Efficiency (FY24, FY25); Meta 2025 Environmental Data Index; Equinix FY2025 Annual Report; Digital Realty 2025 Impact Report release (27 May 2026). |
| EU average WUE | European Commission, COM(2026) 500 final, section 2.2.2 (21 September 2026). |
| Electricity water | Reig, Luo, Christensen and Sinistore (2020), Guidance for Calculating Water Use Embedded in Purchased Electricity, World Resources Institute and WSP, Appendices 1 and 2. CC BY 4.0. In MasterBrain as section water, 150 rows. |
| Household comparison | US EPA WaterSense: “The average American family uses more than 300 gallons of water per day at home.” |
All 77 operator and EU figures are in the open dataset Data Center Water Benchmarks (CSV and JSON, CC BY 4.0, DOI 10.5281/zenodo.23290085; source on GitHub). The electricity water factors are served by the open factor API:
/wp-json/greencalculus/v1/factors?key_prefix=water.electricity.— 49 countries and 26 US eGRID subregions, consumption and withdrawal
Frequently asked questions
It depends on size and cooling. Google’s most water-intensive campus, Council Bluffs, Iowa, consumed 1,346 million gallons in 2025, about 3.7 million gallons a day. Its 40 named sites ranged from under 0.1 million gallons a year to over a billion. Per unit of computing, operators report 0.12 (AWS, 2025) to 0.91 litres per kWh of IT energy (Equinix, 2025).
Google’s data centers withdrew 13,562 million US gallons in 2025 and consumed 10,523 million, after 3,039 million was returned as discharge. That is one operator; most do not publish site-level water figures at all.
Often, yes. Of the 13,562 million gallons Google’s data centers withdrew in 2025, 10,949 million was potable water. Some sites run on reclaimed wastewater or non-potable sources; Google’s Douglas County, Georgia campus drew 394.3 of its 440.6 million gallons from reclaimed wastewater.
Water Usage Effectiveness: the litres of water a data center uses per kWh of energy delivered to its IT equipment, defined in ISO/IEC 30134-9 and by The Green Grid. Lower is better; air-cooled sites with no evaporative cooling are close to zero.
Mostly for evaporative cooling: water evaporates to carry heat away from the servers. Google’s 2026 Environmental Report says water cooling requires less energy than air-cooling technologies, so cutting water can raise electricity use.
Partly. Google’s data centers discharged 3,039 of the 13,562 million gallons they withdrew in 2025, about 22%. The rest, 10,523 million gallons, was consumed, mostly by evaporation.
Version history
- 1.1 (12 October 2026): correction. Version 1.0 said Meta publishes no data center water figures. It does: its 2025 Environmental Data Index gives annual WUE (0.19 L/kWh in 2024) and water withdrawal and consumption, now in the WUE table and the dataset.
- 1.0 (11 October 2026): first published.