
Digital & IT · IT Asset Lifecycle
IT Asset & E-Waste Lifecycle Emissions Calculator
Cradle-to-grave CO₂e for a fleet of IT hardware — laptops, monitors, desktops, network gear, and servers — across the three stages that make up a device’s footprint: the carbon embodied in manufacturing it, the energy it draws in service, and its end-of-life treatment. Embodied carbon is read live from device-level lifecycle data; the result amortises across each asset’s useful life, separates the avoided-burden benefit of reuse and recycling, and carries an honest uncertainty range — because for most IT hardware, the carbon is in the making, not the using, and a number that hides that is no use to anyone planning a refresh.
Three stages, one inventory. Every asset’s footprint is the sum of three stages — embodied carbon from manufacturing, operational energy in service, and end-of-life treatment — reported as separate lines and a total. A fourth panel reports the circularity benefit of reuse and recycling separately, as an avoided burden, never folded into the inventory total.
Embodied and operational, read live. The embodied figures are device-level lifecycle values read live from Master Brain — drawn from Lövehagen’s 2023 end-user-device dataset (aligned to ITU-T L.1450) for laptops, phones, tablets, monitors, desktops, and network customer-premises equipment, and from a Dell PowerEdge R740 cradle-to-gate LCA for the server node. Operational energy multiplies measured device power by hours in service and the grid factor; server power is modelled from SPECpower idle and peak figures scaled by utilisation and data-centre PUE.
End-of-life, page-pinned and low-confidence. The end-of-life stage multiplies a device’s bill-of-materials mass by a route-weighted treatment factor across recycling, landfill, and incineration (a default mix of 60/25/15, adjustable). These coefficients, the device masses, and the default lifetimes are hardcoded engine defaults, not Master Brain reads, and are explicitly the lowest-confidence inputs in the model. They are not derived from a building-LCA module standard; they are a transparent, documented approximation.
Amortised over life. For an owned estate, embodied, end-of-life, and circularity figures are amortised across each asset’s useful life to give an annual view — so extending a device’s life lowers its annual embodied carbon proportionally. A “full at purchase” toggle instead books the whole embodied stage in the acquisition year. Grid factors are location-based, read live from Master Brain (Ember globally; EPA eGRID for the US, DEFRA for Great Britain).
Scope. IT-asset lifecycle carbon does not sit in one GHG scope — embodied manufacturing, use-phase electricity, and end-of-life waste land in different categories depending on whether you own or sell the hardware. This calculator reports the stages; the scope-mapping section below explains how to place each one.
Own estate → embodied S3 Cat 1 · use-phase S2 · end-of-life S3 Cat 5. Sold products → embodied S3 Cat 1 · use-phase S3 Cat 11 (full life) · end-of-life S3 Cat 12.
One line per asset type — end-user devices, CPE / network gear, or dual-socket servers. Embodied carbon is read per asset from MasterBrain; operational from the asset’s active-use power × your hours × the regional grid factor (servers also × PUE).
Location-based grid factor for the estate’s electricity. Used for the operational (use-phase) component.
Server life is a MasterBrain row; the others are documented defaults (ITU-T L.1450 / Lövehagen). Extending a lifetime is the primary reduction lever for an IT estate — adjust to model your refresh policy.
Route shares of the retired estate (by mass). The avoided burden from recycling and reuse is reported separately in the circularity panel — these shares only drive the end-of-life processing emissions in the inventory.
Reuse rate defaults to 0% (no circularity assumed). Set it to model a refurbishment programme — the avoided embodied burden appears in the circularity panel, fenced out of the inventory total.
Default 8,000 km on an average HGV factor (≈0.11 kg CO₂e per tonne-km) — a documented engine default for overseas manufacture to point of use. Mass per asset is the bill-of-materials default (see method drawer).
Add your IT assets and pick a region above to calculate
Results appear instantly. The whole-life stage split (embodied · operational · transport · end-of-life), per-asset breakdown, GHG Protocol scope mapping, a separately-reported circularity benefit, and the full audit trail appear after calculation.
Results are indicative whole-life estimates for an IT asset estate, summing embodied (cradle-to-distribution / cradle-to-gate manufacturing) carbon, operational use-phase electricity, an optional transport stage, and end-of-life (e-waste) treatment emissions. The reporting perspective sets the GHG Protocol scope: own / operated estate reports embodied as Scope 3 Category 1 (amortised or full), use-phase as Scope 2, and end-of-life as Scope 3 Category 5; sold products reports embodied as Scope 3 Category 1, use-phase as Scope 3 Category 11 over full life, and end-of-life as Scope 3 Category 12. The circularity benefit from reuse and recycling is reported separately and is never added into the inventory total, per the GHG Protocol treatment of avoided emissions. Embodied factors are representative averages — a specific SKU can vary ±20%. Bill-of-materials mass, end-of-life treatment factors, the recovery delta, reuse residual-life, CPE watts, server utilisation, the road-freight factor and end-user-device useful-life years are documented engine defaults, not published MasterBrain factors, and are flagged low-confidence. Router/switch embodied carbon beyond CPE is out of scope in this version. This is a transparent estimate, not a metered reading; confirm asset counts, active-use hours and disposal routes against your IT asset register, and where material proceed to third-party verification.
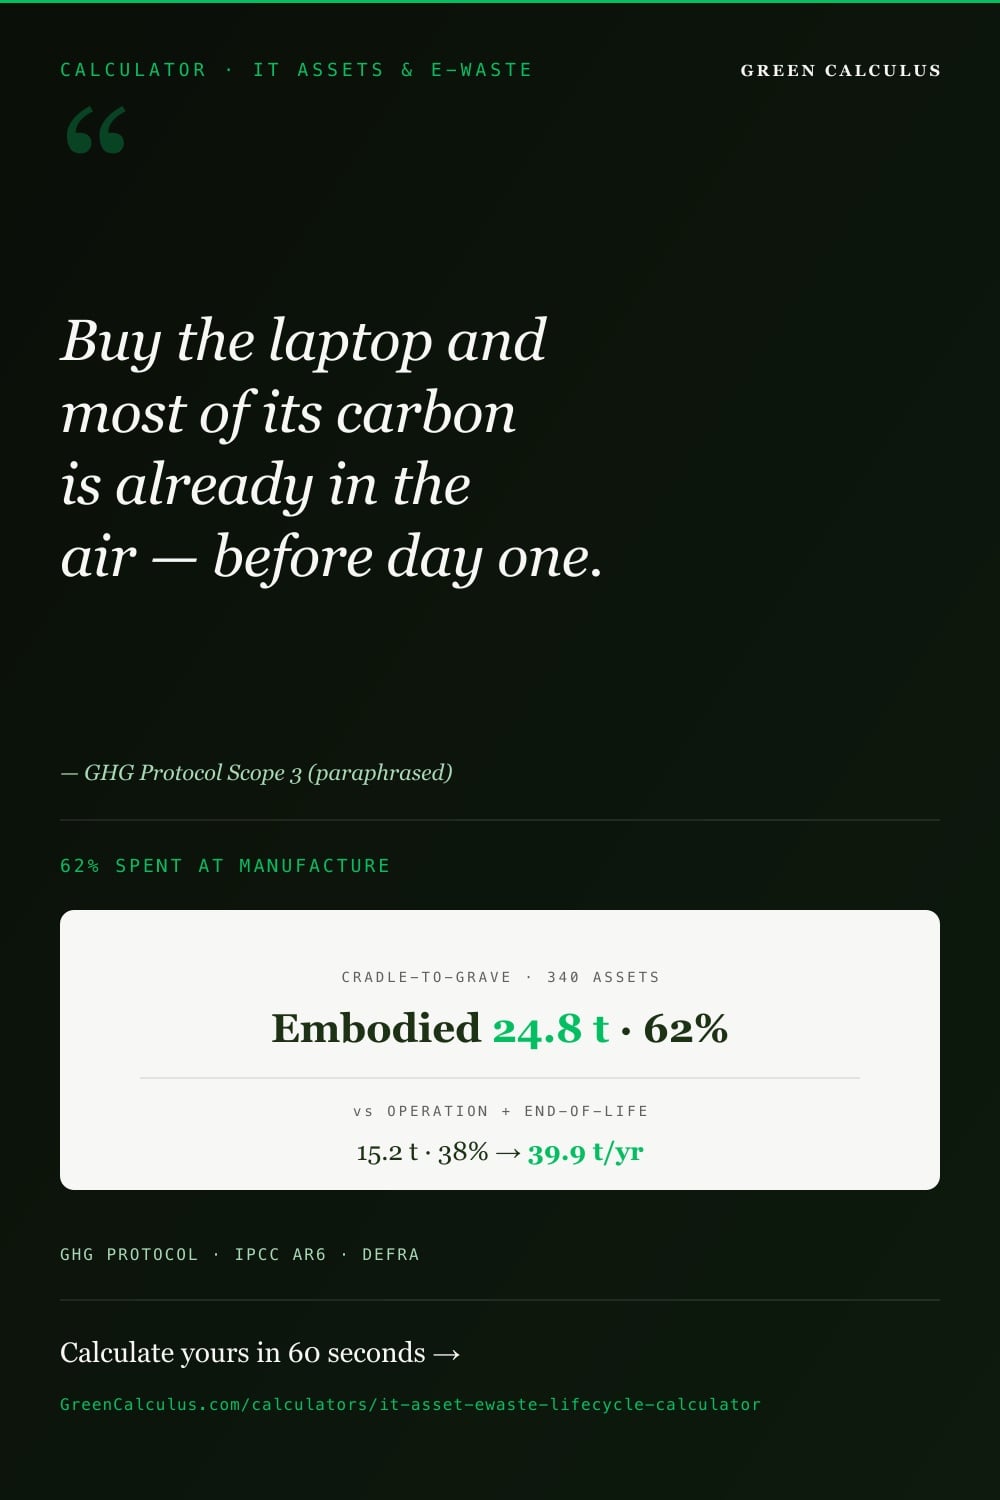
When a company tallies its IT carbon, it usually counts the electricity — the laptops humming, the servers whirring. That is the easy half, and often the smaller half. The larger footprint was spent before the device ever switched on: in the mines, fabs, and assembly lines that built it. By the time you plug a laptop in, most of its lifetime carbon is already in the atmosphere.
This calculator counts the whole life — manufacture, use, and end-of-life — across your fleet, so a refresh decision is made on the full number, not just the part you can see on the electricity bill.
For most end-user IT hardware, manufacturing carbon dominates: a typical laptop carries roughly 200 kg CO2e embodied against tens of kilograms of use-phase energy. Servers are the exception, where year-round duty can rival embodied carbon.
Three lifecycle stages
Embodied (manufacturing) · Operational (use) · End-of-life. Summed into one inventory total, with circularity reported separately.
Embodied, read live
Device-level LCA figures from Master Brain — Lövehagen 2023 (end-user devices, CPE) and a Dell R740 LCA (server node).
Operational basis
Measured device power × hours × grid. Servers from SPECpower idle/peak × utilisation × data-centre PUE.
End-of-life
Mass × route-weighted treatment factor (recycle / landfill / incinerate, default 60/25/15). Page-pinned, low-confidence.
Amortised over life
Embodied spread across useful life for an annual view. Extending device life is the primary reduction lever.
Uncertainty
≈±20%, driven by embodied SKU variation. End-of-life and mass inputs are documented low-confidence defaults.
It is tempting to treat IT carbon as an energy problem — cut the power draw and cut the footprint. For an end-user device that instinct is mostly wrong. A laptop’s manufacturing carbon typically dwarfs the electricity it will ever draw, so the single most effective thing you can do is keep it in service longer, spreading that fixed embodied debt across more years. Servers are the exception: run year-round at high utilisation, their use-phase energy can match or exceed what it took to build them. The calculator shows the split per asset class, so you optimise the stage that actually dominates your hardware.
Model Device Use-Phase in Detail →
What “IT Asset & E-Waste Lifecycle” Covers — Cradle to Grave
IT-asset lifecycle emissions are the greenhouse gases across a device’s entire life — from the raw materials and manufacturing that built it, through the electricity it draws in service, to its treatment when retired. Unlike a use-phase-only estimate, a lifecycle figure follows the whole arc, which is the only way to make an honest refresh or disposal decision.
The Three Stages: Manufacture → Use → End-of-Life
- Embodied (manufacturing). The carbon spent extracting materials and building the device — the largest stage for most end-user hardware, and fixed the moment the device is made.
- Operational (use). The electricity the device draws over its years in service, converted to CO₂e at the grid factor where it runs.
- End-of-life. The treatment of the retired device — recycling, landfill, or incineration — a small carbon share but the stage where toxic and resource harm concentrates.
A separate circularity panel reports the avoided burden of reuse and recycling — the emissions a refurbished device displaces by deferring a new one. It is reported alongside the inventory, never added into it, following the GHG Protocol’s treatment of avoided emissions.
Embodied vs Operational — Why Manufacturing Usually Dominates
The intuition that “using less power” is the main lever holds for always-on infrastructure, but not for a laptop. A laptop’s manufacturing carbon is a large, one-time debt; the electricity it draws over four years is modest by comparison, especially on a clean grid. This inverts the usual framing — and it is why the most powerful reduction lever for end-user hardware is not efficiency but longevity. Servers are the exception, running year-round at high utilisation, where use-phase energy can match or exceed embodied carbon.
Scope Mapping — Where IT Lifecycle Carbon Lands in Your Inventory
A device’s footprint spreads across several GHG categories depending on what you own and sell. The boundary — the device’s life — is the same, but the labels differ. Embodied manufacturing carbon is Scope 3 Category 1 (purchased goods) if the hardware is expensed; for capitalised assets — common for servers and laptops — it moves to Category 2 (capital goods). Use-phase electricity is Scope 2 for hardware you operate, or Category 11 (use of sold products) for hardware you sell. End-of-life treatment is Category 5 (operational waste) for your own retired assets, or Category 12 (end-of-life of sold products) for hardware you put on the market. The calculator gives the stage-resolved figure so you can place each part where it belongs; it currently labels embodied as Category 1, so add a Category 2 note for capitalised hardware.
Included vs Excluded
| Included in this calculator | Excluded — account separately |
|---|---|
| Embodied manufacturing carbon, eight asset types | General network switches and routers beyond customer-premises equipment (no factor row) |
| Operational electricity over each asset’s service life | Software, cloud subscriptions, and data not tied to the hardware |
| End-of-life treatment (recycle / landfill / incinerate mix) | Transport between lifecycle stages unless the optional toggle is on |
| Circularity benefit of reuse and recycling (reported separately) | The full toxicity and resource-depletion impact of e-waste (carbon only here) |
| Optional transmission-and-distribution gross-up on use phase | Peripherals and consumables (cables, cartridges) outside the asset list |
Embodied Carbon of IT Assets — The Manufacturing Footprint
Embodied carbon is the footprint of building a device, and for most IT hardware it is the dominant stage. The calculator reads device-level figures live, covering eight asset types across three groups.
Per-Device Embodied Figures
The end-user and network figures come from Lövehagen’s 2023 dataset (aligned to ITU-T L.1450); the server node is sourced separately to a Dell PowerEdge R740 cradle-to-gate LCA. All are read live from Master Brain.
| Asset | Embodied (kg CO₂e) | Group | Source |
|---|---|---|---|
| Smartphone | 50 | End-user device | Lövehagen 2023 |
| Tablet | 100 | End-user device | Lövehagen 2023 |
| Monitor | 100 | End-user device | Lövehagen 2023 |
| Laptop | 200 | End-user device | Lövehagen 2023 |
| Desktop tower | 350 | End-user device | Lövehagen 2023 |
| All-in-one PC | 350 | End-user device | Lövehagen 2023 |
| CPE / router | 30 | Network | Lövehagen 2023 · ITU-T L.1450 |
| Server (dual-socket node) | 1,313 | Server | Dell R740 LCA (2019) |
General network switches and routers beyond customer-premises equipment are out of scope — there is no representative factor row for them, and inventing one would imply a precision the data does not support.
Why a Short Refresh Cycle Is the Hidden Driver
Because embodied carbon is fixed at manufacture and amortised across service life, the refresh cycle is the lever that quietly governs an estate’s footprint. A laptop replaced every three years books its 200 kg of embodied carbon across three years; the same laptop kept for six years halves the annual figure. Multiply across a fleet and a one-year extension to the standard refresh cycle can outweigh a great deal of operational efficiency tinkering. The calculator amortises embodied carbon over each asset’s useful life precisely so this effect is visible.
The Use Phase — Operational Energy Over a Device’s Life
The operational stage is the electricity a device draws while in service — the part most inventories already count, and the only stage that scales with the grid.
The Operational Chain
Operational carbon follows device power (W) × hours in service ÷ 1000 × grid factor. Device power is read live from Master Brain — a laptop’s measured draw is about 10 watts (Kirkeby’s 2026 measured figure, the default; higher framework figures from DIMPACT and the Danish DIGST framework are selectable), a monitor around 31 watts, a desktop tower around 87. Servers are modelled differently, from SPECpower idle and peak figures scaled by utilisation and multiplied by data-centre PUE, because a server’s draw depends heavily on load and on the efficiency of the facility around it.
When Use Overtakes Embodied
The balance between embodied and operational carbon flips by asset class and by grid. The comparison below shows why a one-size lever does not exist:
Laptop, clean grid
Embodied dominates heavily. A ~10 W device over four years draws little carbon against 200 kg of manufacturing. Longevity is the lever.
Desktop, dirty grid
Use-phase climbs. An ~87 W tower on a coal-heavy grid over five years narrows the gap with embodied considerably.
Server, year-round
Use-phase often leads. A node at sustained utilisation, grossed up by PUE, can draw more carbon in service than its 1,313 kg build.
For the device segment in fine detail — varied duty cycles, multiple device classes, and a deeper power model — the end-user devices calculator models the use phase alone, sharing the same Master Brain rows so the two tools stay consistent.
End-of-Life & E-Waste — The Stage Everyone Omits
Most device-carbon estimates stop at the end of use. The retired device still has a footprint, and — more importantly — an outsized harm that carbon alone does not capture. This is the stage the calculator is named for, and the one it treats with the most caution.
Treatment Routes
End-of-life carbon is the device’s bill-of-materials mass multiplied by a route-weighted treatment factor across three disposal routes — recycling, landfill, and incineration — at a default mix of 60/25/15, adjustable. The per-route factors are small (recycling around 0.40, landfill 0.02, and incineration 0.90 kg CO₂e per kilogram of device), so end-of-life is typically well under 1% of an asset’s lifecycle carbon. These coefficients and the device masses are page-pinned engine defaults, not Master Brain reads, and are the lowest-confidence inputs in the model — stated plainly rather than dressed up.
The carbon of disposing of a device is a rounding error next to the carbon of building it. But carbon is the wrong lens for end-of-life harm. Retired electronics carry heavy metals, flame retardants, and recoverable critical minerals; landfilled or informally burned, they leach toxins and waste scarce resources that the next device will have to mine again. The reason to route IT through responsible recycling — to a standard like R2v3 — is overwhelmingly about toxicity and resource recovery, not the modest carbon line. Do not let a small carbon number justify careless disposal.
The Circularity Benefit — Avoided Burden, Reported Separately
Reuse and recycling displace future emissions: a refurbished laptop that defers a new purchase avoids that new device’s embodied carbon, and recovered materials displace virgin extraction. The calculator quantifies this as a circularity benefit in a separate panel — an avoided burden, fenced off and never added into the inventory total, consistent with how the GHG Protocol treats avoided emissions. Reuse is modelled as a rate (the share of retired assets refurbished rather than disposed of), distinct from the disposal-route mix. Counting an avoided emission as a reduction in your own inventory would double-count; reporting it separately keeps the inventory honest while still crediting the circular choice.
Extending Asset Life & Reuse — The Levers the Tool Exposes
The calculator does not compute a repair-versus-replace payback, but it exposes the two inputs that govern an estate’s lifecycle footprint, and seeing them move is what informs the decision.
Useful-Life Override — the Primary Lever
Each asset class carries a default useful life (a laptop four years, a monitor six, a desktop five, a server four), and the Advanced settings let you override it. Because embodied carbon is amortised across that life, extending it lowers annual embodied carbon proportionally — a laptop kept six years instead of four cuts its annual embodied line by a third. The engine’s own insight text names lifetime extension the primary reduction lever, and for an end-user fleet, where embodied dominates, it usually is. This is not a payback calculation; it is a direct, visible relationship between how long you keep hardware and its annual footprint.
Reuse Rate — Crediting Circularity
The reuse rate sets the share of retired assets that are refurbished and put back into service rather than disposed of. Raising it increases the circularity benefit in the separate avoided-burden panel, without altering the inventory total. It is the lever that quantifies an IT asset disposition (ITAD) or refurbishment programme in carbon terms.
The calculator shows how extending life and raising reuse change the annual footprint and the circularity benefit. It does not compute a break-even — the point at which a new, more efficient device “pays back” its embodied carbon through use-phase savings. For an end-user device on a clean grid, that payback is usually long, which is why longevity tends to win; for a power-hungry old server on a dirty grid, a new efficient unit can pay back faster. If you need that crossover quantified for a specific replacement decision, model the old and new devices separately and compare their annual figures.
Worked Example — A 340-Asset Fleet, Cradle to Grave
This example reproduces the calculator’s default boot: a small owned estate of 200 staff laptops, 100 desk monitors, and 40 on-prem servers, on the UK grid, amortised over each asset’s useful life.
Across the 340-asset fleet the annual lifecycle footprint is 39.9 tCO₂e a year, split embodied 24.8 t (62.1%), operational 15 t (37.5%), and end-of-life 0.16 t (0.4%). Separately — and not counted in that total — the circularity panel reports a recycling-avoided benefit of about 1.0 tCO₂e (roughly 2.5% of the inventory, at a 0% reuse rate). Embodied leads even with servers in the mix, which is the signature of an end-user-heavy estate.
| Stage | Basis | tCO₂e/yr | Share |
|---|---|---|---|
| Embodied | Per-asset embodied ÷ useful life, summed (live MB; grid-independent) | 24.8 | 62.1% |
| Operational | Device power × hours × UK grid, summed (live MB + live grid) | 15 | 37.5% |
| End-of-life | Mass × route-weighted EF (60/25/15), amortised (page-pinned) | 0.16 | 0.4% |
| Inventory total | Sum of the three stages | 39.9 | 100% |
| Circularity (fenced) | Recycling-avoided benefit (reuse 0%) — reported separately | ≈1.0 | not in total |
The Stage Split, Visualised
For this fleet, embodied carbon leads, operational follows, and end-of-life is a sliver. Move to a dirtier grid and only the operational bar grows; extend asset lives and the embodied bar shrinks:
Audit trail note: Factor tiers — live Master Brain reads: embodied (Lövehagen 2023 for the laptops and monitors; Dell R740 LCA for the servers) and operational device power (Kirkeby measured laptop draw; SPECpower server idle/peak × PUE 1.5). Page-pinned engine defaults (low-confidence): the end-of-life route factors and the device masses, and the default useful lives over which embodied is amortised. Grid factor: live UK DEFRA 0.13096 kgCO₂e/kWh — so the operational line and the stage split move if the grid factor re-vintages; embodied and end-of-life are grid-independent. Per-asset annual figures (kg CO₂e): laptops embodied 10,000 / operational 532 / end-of-life 34; monitors 1,667 / 812 / 32; servers 13,130 / 13,629 / 95. Embodied booked as Scope 3 Category 1 (the engine default — capitalised hardware moves to Category 2). The figures are the engine’s default-boot output for the current UK grid factor, recorded on the review date.
Standards and Methodology — How These Numbers Are Grounded
The calculator rests on device-level lifecycle data and a disclosed two-tier factor model. The references fall into three groups.
Lifecycle and Embodied Basis
The embodied figures follow product-lifecycle-assessment practice — the ISO 14067 product carbon footprint standard and the ISO 14040/14044 LCA framework — drawing on Lövehagen’s 2023 end-user-device dataset (aligned to ITU-T L.1450) and a Dell PowerEdge R740 cradle-to-gate LCA for the server. The full derivation, including the amortisation method and the end-of-life treatment, is documented in the IT-asset and e-waste lifecycle methodology page.
End-of-Life and Recycling
The end-of-life stage uses page-pinned, route-weighted treatment factors rather than a building-LCA module standard — a transparent approximation, not a module-level compliance claim. For the disposal route itself, responsible-recycling practice follows standards such as R2v3 and the WEEE framework, whose value lies chiefly in toxicity control and material recovery rather than carbon.
Grid and Energy Basis
Use-phase electricity is converted with location-based grid factors read live from Master Brain — Ember Yearly Electricity globally, EPA eGRID for the US, and DEFRA for Great Britain. Server use-phase additionally applies a data-centre PUE gross-up. GWP values follow IPCC AR6.
Relationship to the Other Digital Models
IT-asset lifecycle carbon overlaps with several digital models. The end-user devices calculator applies the same embodied-plus-use-phase basis to the laptop, phone and monitor fleet, while the data-centre PUE calculator and the cloud compute calculator account for the operational emissions of the server hardware whose embodied and end-of-life carbon this tool captures. They share embodied- and grid-factor lineage, so the estimates stay mutually consistent. See also the AI compute calculator, the Bitcoin emissions calculator and the video streaming calculator for adjacent digital workloads.
Reducing IT Asset & E-Waste Emissions — Levers That Move the Number
The levers are not equal, and which leads depends on the asset class the calculator shows you. Ranked by typical leverage for an end-user fleet:
1 · Extend device life
The primary lever. Amortising embodied carbon over more years cuts the annual figure proportionally — a one-year extension across a fleet is substantial.
2 · Buy refurbished
A refurbished device avoids most of a new unit’s embodied carbon. Raising the reuse rate is the largest circularity benefit available.
3 · Right-size the hardware
Match the device to the task. A laptop where a tablet suffices, or a tower where a thin client works, carries needless embodied carbon.
4 · Cut server over-provisioning
For servers, where use-phase leads, raising utilisation and consolidating onto fewer, better-loaded nodes cuts both stages at once.
5 · Cleaner grid for the use phase
A cleaner grid scales the operational stage down — most material for high-draw, year-round servers on dirty grids.
6 · Responsible disposal
Route retired assets to certified recycling. The carbon gain is small; the toxicity and material-recovery gain is large.
The practical implication: there is no universal first move. An office refreshing laptops every three years should extend the cycle and buy refurbished before anything else; a data-centre team should consolidate servers and clean the grid powering them. The calculator’s stage split per asset class tells you which lever is yours.
Audit Checklist — Common IT-Lifecycle Reporting Errors
The errors below are the recurring sources of understated or unverifiable IT-lifecycle figures. The calculator guards against most; a use-phase-only inventory guards against none.
- Counting only the electricity. The most common and most damaging error. For end-user hardware, embodied manufacturing carbon usually exceeds use-phase energy. A power-only inventory omits the larger stage.
- Netting the circularity benefit into the total. Avoided emissions from reuse and recycling are reported separately, never subtracted from your inventory. Folding them in double-counts and overstates your reduction.
- Misplacing embodied carbon’s scope. Expensed hardware is Scope 3 Category 1; capitalised hardware is Category 2. State which, and be consistent across the estate.
- Ignoring amortisation. Embodied carbon spread over a device’s life gives an annual figure; booking it all in the purchase year gives a spiky one. Pick a basis and state it.
- Treating end-of-life carbon as the whole e-waste story. The carbon line is tiny; the toxicity and resource harm is not. Do not let a small number justify landfill over certified recycling.
- Using one device power for all duty cycles. A server at 30% utilisation and one at 80% draw very differently. Use measured or load-scaled power, not a nameplate figure.
- Forgetting servers in scope. A server’s lifecycle carbon dwarfs a laptop’s. An IT inventory that counts end-user devices but omits on-prem servers misses a large slice.
- Quoting a point value with no range. Embodied figures are representative averages; a specific SKU varies around ±20%. Report the central estimate with the range.
Data Sources, Factor Provenance, and Uncertainty
Factor Provenance — Two Tiers
Live Master Brain v2026.203 reads:
- Embodied carbon — Lövehagen 2023 (end-user devices and CPE, aligned to ITU-T L.1450); a Dell PowerEdge R740 cradle-to-gate LCA for the server node.
- Operational power — measured device draw (Kirkeby 2026), framework figures (DIMPACT, DIGST), and SPECpower idle/peak for servers, with data-centre PUE.
- Grid factors and T&D losses — Ember globally; US via EPA eGRID; GB via DEFRA.
Page-pinned constants (engine defaults, low-confidence):
- End-of-life treatment factors — per-route recycling, landfill, and incineration coefficients and the default route mix.
- Device mass and useful life — bill-of-materials masses and the default service lives over which embodied is amortised.
- Server power model — utilisation and PUE defaults applied to SPECpower figures.
Uncertainty
There is no computed symmetric band on the headline. The honest range is roughly ±20%, driven primarily by the embodied figures — Lövehagen’s representative shipment-mix averages, against which a specific device SKU varies by around ±20%. Since embodied is about 62% of a typical estate total, the estate inherits roughly that range. The end-of-life coefficients, device masses, and lifetime assumptions are additional low-confidence, page-pinned inputs; they should not be presented with false precision.
| Input | Nature of uncertainty |
|---|---|
| Embodied carbon | Representative averages; a specific SKU varies ≈±20%. The dominant uncertainty. |
| Operational power | Class-average or measured draw; actual varies by configuration and load. |
| End-of-life factors | Page-pinned engine defaults; low confidence, route-mix-dependent. |
| Device mass | Page-pinned bill-of-materials estimate; varies by model. |
| Useful life | Default service lives; the amortisation basis, adjustable per asset. |
| Grid factor | Annual location-based average; real intraday intensity varies. |
Update Schedule
Embodied, operational, and grid factors refresh with each Master Brain release; the page-pinned end-of-life and lifetime defaults update when the engine does. The data version badge in the calculator footer always reflects the live MasterBrain version in use.
Frequently Asked Questions
A typical laptop carries roughly 200 kg CO₂e of embodied (manufacturing) carbon, which usually dwarfs the electricity it draws over its life — on the order of tens of kilograms over four years on a clean grid. That makes a laptop a carbon debt repaid through years of service, so the single biggest lever is keeping it longer. The exact figure varies by model by around ±20%. The calculator returns the full cradle-to-grave breakdown for your fleet.
For most end-user hardware, manufacturing — the embodied carbon is fixed at build and typically exceeds the use-phase energy, especially on a clean grid. Servers are the exception: run year-round at high utilisation and grossed up by data-centre PUE, their use-phase energy can match or exceed their embodied carbon. The calculator shows the split per asset class, so you can see which stage dominates your specific hardware.
Less than people expect — end-of-life treatment is typically well under 1% of a device’s lifecycle carbon, because disposal carbon is small next to manufacturing. But carbon is the wrong measure for e-waste harm. Retired electronics carry heavy metals and recoverable critical minerals; landfilled or informally burned, they cause toxic and resource harm that the carbon line does not capture. Route IT through certified recycling for the toxicity and recovery benefit, not the modest carbon gain.
Yes — it is the primary lever for end-user hardware. Because embodied carbon is amortised over a device’s service life, keeping a laptop six years instead of four cuts its annual embodied footprint by a third. Since embodied carbon dominates for most end-user devices, lifetime extension typically beats efficiency gains from new hardware. The calculator’s useful-life override lets you see this directly for your fleet.
It spans several. Embodied manufacturing carbon is Scope 3 Category 1 for expensed hardware, or Category 2 for capitalised assets like servers and laptops. Use-phase electricity is Scope 2 for hardware you operate, or Category 11 for hardware you sell. End-of-life is Category 5 for your own retired assets, or Category 12 for sold products. The calculator gives the stage-resolved figure so you can place each part correctly rather than forcing it into one scope.
No — report it separately. The avoided emissions from reuse and recycling are a real benefit, but the GHG Protocol treats avoided emissions as a separate disclosure, not a subtraction from your own footprint. Folding them into your inventory total would double-count and overstate your reduction. The calculator fences the circularity benefit in its own panel for exactly this reason, so you can credit the circular choice without distorting the inventory.
Not as a single payback number. It does not compute the break-even point where a new, more efficient device repays its embodied carbon through use-phase savings. What it does show is how extending device life and raising the reuse rate change your annual footprint — and because embodied carbon dominates for end-user hardware, that usually points toward keeping devices longer. To compare a specific old-versus-new replacement, model both and compare their annual figures.
Because the embodied figures, which dominate the total, are representative averages — a specific device SKU varies by around ±20%. Presenting a single point value would imply a precision the lifecycle data does not support. The end-of-life coefficients, device masses, and lifetime assumptions are additional low-confidence defaults. The honest framing is a central estimate of roughly ±20%, driven mainly by embodied-figure variation.
Methodology Notes and Limitations
Three stages, plus a fenced circularity panel. Embodied, operational, and end-of-life are summed into the inventory total; the reuse-and-recycling benefit is reported separately as an avoided burden, never netted in.
Two factor tiers, disclosed. Embodied carbon, operational power, and grid factors are live Master Brain reads. End-of-life route factors, device masses, and default lifetimes are page-pinned engine defaults, and are the lowest-confidence inputs.
End-of-life is an approximation, not a module standard. The stage uses route-weighted treatment factors on a bill-of-materials mass; it does not execute a building-LCA module method, and the avoided-burden credit is not a Module D claim.
Embodied usually dominates — except for servers. For end-user hardware, manufacturing exceeds use-phase carbon; for servers at sustained utilisation, use-phase can lead. Lifetime extension is the primary reduction lever.
Amortised by default. Embodied carbon is spread across each asset’s useful life for an annual view, with a full-at-purchase alternative. Servers’ useful life sources separately to Cloud Carbon Footprint 2024.
Multi-scope, conditional framing. Embodied is Category 1 (expensed) or 2 (capitalised); use-phase is Scope 2 or Category 11; end-of-life is Category 5 or 12. There is no single-scope claim. An uncertainty of roughly ±20%, driven by embodied SKU variation, applies.