
Digital Emissions · Sustainable Web Design Model
Website Carbon Calculator — Per-Pageview Emissions Under the Sustainable Web Design Model
Estimate the carbon emissions of a single pageview from its transferred data, using the Sustainable Web Design Model (SWD) v4: the per-byte energy of the data centre, the network, and the end-user device, split into operational and embodied energy, converted to CO₂e at your grid’s carbon intensity, with a green-hosting adjustment and a new-versus-returning caching split — then annualised across your monthly pageviews.
Core estimate (per pageview):
Emissions = Data transferred (GB) × Segment energy intensity (kWh/GB) × Grid carbon intensity (gCO₂e/kWh)
The Sustainable Web Design Model treats a website’s operational carbon as a function of the data it moves. Bytes transferred are the activity unit; every byte consumes energy in three places — the data centre that serves it, the network that carries it, and the device that renders it — and each of those places draws electricity that carries a grid carbon intensity. The calculator multiplies the page’s transfer size by the SWD v4 per-gigabyte energy intensities, sums the segments, and converts the total energy to CO₂e using the grid factor for the chosen region.
Three system segments, each operational and embodied. SWD v4 splits the per-byte energy across three segments: the data centre (serving and storage), the network (transmission across the internet backbone and access networks), and the user device (the phone, laptop, or desktop that loads the page). Each segment carries two energy components — operational energy (the electricity drawn while the byte is served, carried, and rendered) and embodied energy (the manufacturing energy of the hardware, amortised across its throughput). Green hosting is not a fourth segment: it is an adjustment applied to the data-centre operational component only, because only the data centre’s own electricity is under the host’s procurement control.
Data transferred, not page weight on disk. The activity unit is the data actually transferred over the wire to load the page — compressed, cached, and CDN-served bytes as the browser receives them — not the uncompressed size of the source files. A returning visitor whose browser has cached static assets transfers far fewer bytes than a first-time visitor, so the calculator applies a new-versus-returning caching split: a first view loads the full page weight, a return view loads only the uncached remainder. The blended per-pageview figure weights the two by the share of new visitors you set.
Grid carbon intensity converts energy to CO₂e. Segment energy in kWh becomes CO₂e by multiplying by the electricity grid’s carbon intensity. The model’s default is a global-average grid intensity; where you know your data centre’s region, a location-based per-country factor gives a sharper figure. Because the user-device and network segments are consumed wherever your visitors are — not where your server sits — the region choice is a simplification the model makes deliberately, and one the methodology page documents.
Two result components. The calculator reports a per-pageview metric strip (grams of CO₂e per pageview, an efficiency rating, and the segment split) and a separate annualised panel (kilograms or tonnes per year at your traffic volume, and per-thousand-views). The two answer different questions — how heavy one pageview is, and what the book of traffic adds up to over a year.
What this is, and is not. This is a per-byte estimation model, not a metered measurement. It does not instrument your servers or your visitors’ devices; it infers energy from transfer size and published intensity constants. It is the right tool for comparing designs, tracking a page-weight budget, and producing an order-of-magnitude operational figure — and the wrong tool for a metered data-centre inventory, which belongs in a facility-level accounting exercise.
Loads live from MasterBrain. Network + device use this grid; data centre uses it too unless green hosting is on.
Blank = estimate from page weight + caching above.
Enter a page weight and monthly pageviews above to calculate
Results appear instantly: an A+→F carbon rating, grams CO₂e per pageview with a range band, the data-centre / network / device split, a page-weight benchmark, reduction scenarios and the full audit trail. Each factor is tagged MasterBrain-live or page-pinned.
Results are indicative digital-carbon emissions for a website, computed with the Sustainable Web Design model (v4 by default; v3 selectable for legacy parity): the data transferred per pageview is allocated across data-centre, network and end-user device energy (per GB) and multiplied by the selected grid’s carbon intensity. Grid factors and T&D losses are read live from MasterBrain; the SWD per-GB energy intensities, the global grid average, the caching / returning-visitor split, the A+→F rating bands (Sustainable Web Design Digital Carbon Ratings v1, 2023, calibrated to the HTTP Archive distribution) and the page-weight benchmark are page-pinned with citations — each factor is tagged in the audit trail. The headline carries a range band because SWD v4 and v3 can differ 2–3×; always report the model and grid basis, not just the number. International grids (Ember 2025) are CO₂-only; UK (DEFRA) and US (eGRID) are full CO₂e. Green hosting abates only the data-centre operational slice. A website’s footprint does not map cleanly to one GHG Protocol scope — report it as a digital-carbon estimate. Content production, ad-tech beyond the measured page bytes, and end-of-life are out of boundary. This is a transparent attributional estimate, not metered telemetry; confirm page weight and grid factors against your own records, and where material proceed to third-party verification.
A webpage feels weightless. It is not: every pageview moves data across a data centre, a network, and a device, and each of those draws electricity that carries a carbon intensity. Multiplied across a site’s traffic, a heavy page becomes a measurable, recurring emissions line — one that most organisations never see, because nothing on the page tells them it is there.
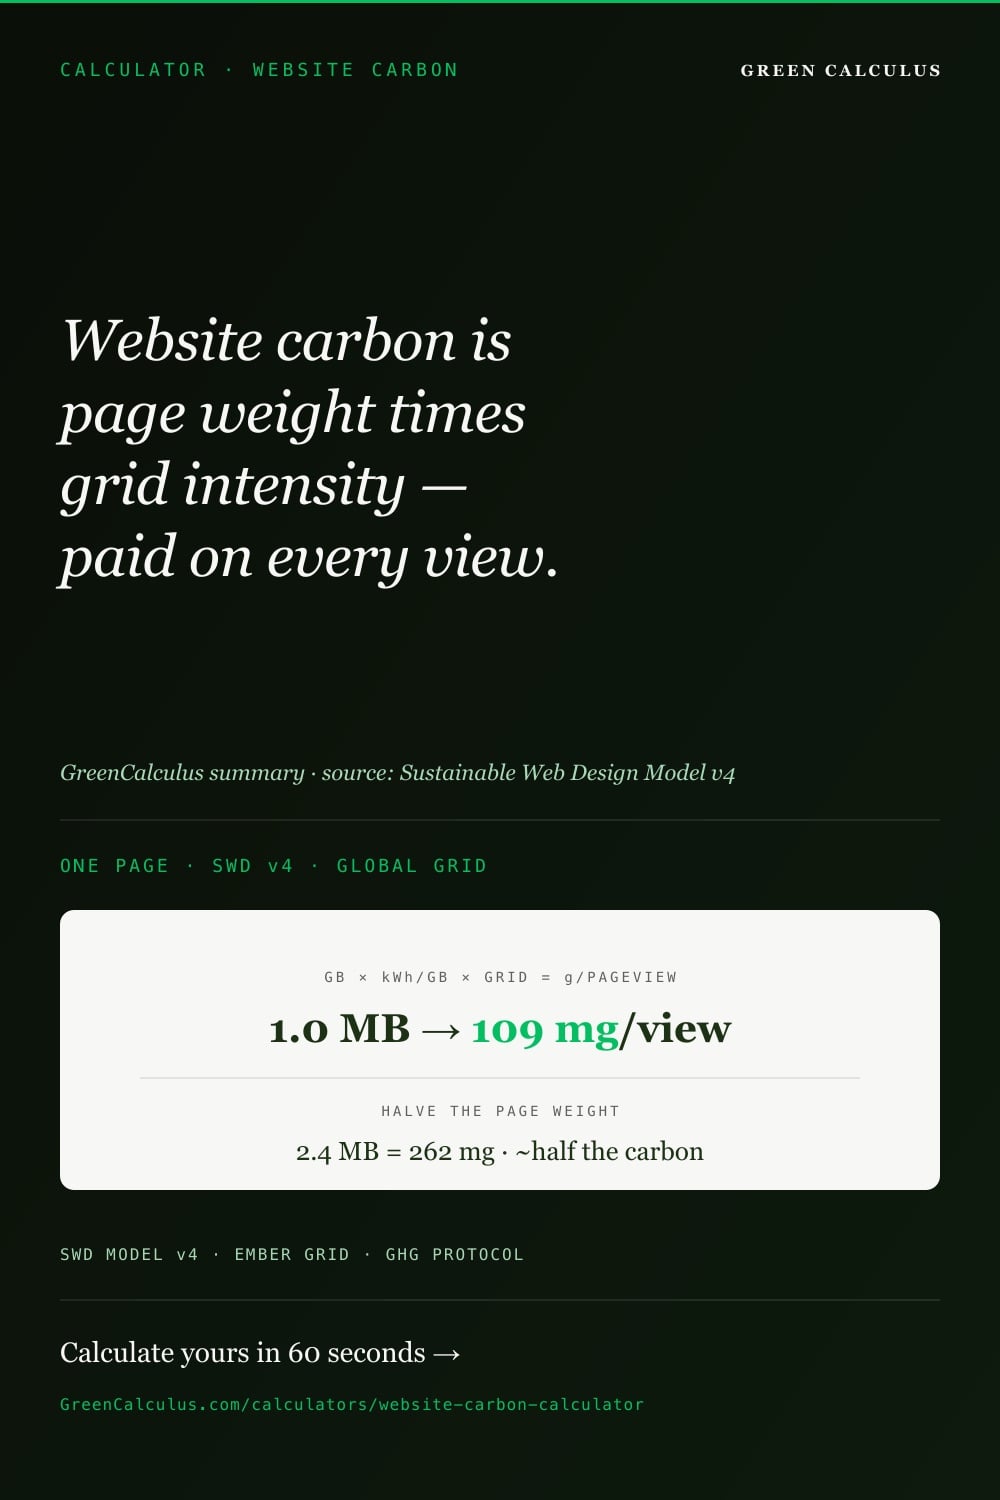
Website carbon is page weight times grid intensity, paid once per view and again on every view after.
A pageview’s carbon equals the data it transfers multiplied by the energy per gigabyte across the data centre, network, and device, converted at the grid’s carbon intensity. Cutting page weight and using low-carbon hosting are the two largest levers.

What this calculator measures — per-pageview digital carbon
This calculator estimates the operational and embodied carbon of a single website pageview from the volume of data that pageview transfers, applying the Sustainable Web Design Model v4 per-byte energy intensities and a grid carbon-intensity factor. It answers a narrow, practical question: how many grams of CO₂e does it cost to serve and render this page once, and what does that come to across a year of traffic?
Where this sits — operational digital emissions in Scope 3
For most organisations, the website is a small but visible slice of a much larger digital footprint. It sits in the operational-digital band alongside cloud compute, streaming, and end-user devices, and maps into the corporate inventory under the GHG Protocol Scope 3 Standard — typically Category 1 (purchased goods and services, where hosting is bought in) or Category 11 (use of sold products, for a product whose use is the website itself). The value of a per-pageview figure is not that it dominates the inventory — it rarely does — but that it is controllable: page weight and hosting are design decisions a team can change this quarter, unlike most Scope 3 lines.
What a “pageview” is — and what it is not
- In scope: the data transferred to load one view of one page — HTML, CSS, JavaScript, images, fonts, and any third-party assets the page pulls in — converted to energy across the data centre, network, and device, and to CO₂e at the grid factor.
- Not the disk size: the activity unit is bytes transferred over the wire (compressed and cached), not the uncompressed weight of the source files. Caching and compression make the transferred figure smaller than the on-disk figure.
- Not the whole session: one pageview, not a multi-page visit. A session that loads five pages is five pageviews, each estimated on its own transfer size.
- Not the server’s full energy draw: this is a per-byte attribution model, not a metered reading of your data centre. It infers energy from transfer size and published intensity constants.
The estimate is only as good as the transfer size you feed it. A page-weight figure taken from a real browser load — with compression, caching, and third-party scripts as they actually fire — produces a defensible estimate. A figure guessed from source-file sizes does not. Measure the transferred bytes on a representative load before trusting the grams.
How the calculation works — the SWD per-byte chain
Each pageview reduces to a short multiplication chain, run per segment and summed:
Per-pageview CO₂e = Data transferred (GB) × Σ segment energy intensity (kWh/GB) × Grid carbon intensity (gCO₂e/kWh)
The data transferred is your input. The segment energy intensities are fixed constants published by the Sustainable Web Design Model. The grid carbon intensity is either the model’s global-average default or a location-based per-country factor you select. Everything else in the calculator is bookkeeping around this core.
The three segments, operational and embodied
SWD v4 distributes the per-gigabyte energy of a byte across three physical segments, and within each segment it separates the electricity drawn in use (operational) from the manufacturing energy of the hardware amortised across its lifetime throughput (embodied):
- Data centre — serving, storage, and the facility overhead that supports them. This is the only segment whose operational energy a green-hosting choice can decarbonise, because it is the only electricity the host procures.
- Network — the backbone and access networks that carry the bytes from the data centre to the visitor. Consumed in transit, wherever the visitor is.
- User device — the phone, laptop, or desktop that receives and renders the page. Its embodied component is the largest single embodied term in the model, because device manufacturing is energy-intensive and amortised across relatively modest data throughput.
Summing the operational and embodied intensities across all three segments gives a total kWh per gigabyte transferred. Multiplying by the page’s transfer size gives the energy for one pageview; multiplying that by the grid carbon intensity gives grams of CO₂e. The exact per-segment intensities the engine uses, and their sources, are set out in the data-sources section below.
The new-versus-returning caching split
A first-time visitor’s browser holds none of the page’s assets, so it downloads the full page weight. A returning visitor’s browser has cached the static assets — stylesheets, scripts, fonts, logos — and re-downloads only what has changed, transferring far fewer bytes. The model captures this with a caching split: it estimates a full-weight figure for new views and a reduced figure for return views, then blends them by the new-visitor share you provide. A site with heavy repeat traffic has a materially lower blended per-pageview figure than its first-load weight alone would suggest.
If you do not know your new-versus-returning split, your analytics platform does — it is a standard dimension. Feeding the real ratio in, rather than assuming all views are first loads, is one of the cheapest accuracy gains available, and it rewards good caching configuration in the number rather than hiding it.
The Sustainable Web Design Model — v4, segments, and version drift
The Sustainable Web Design Model is the per-byte estimation methodology this calculator implements. Understanding what it is — and how its constants shift between versions — is central to reading the number honestly, because a per-byte model is an evolving estimate, not a fixed physical constant.
What the model does
SWD converts data transferred into energy using published per-gigabyte intensities, then into carbon using a grid factor. It is deliberately simple: it does not require server instrumentation, device telemetry, or network measurement, only a transfer size and a grid intensity. That simplicity is why it has become the de-facto standard for website carbon estimation — it is reproducible from data any team can obtain — and it is also the source of its limitations, which the model’s authors are explicit about. The full methodology, segment derivations, and caching assumptions are documented on the website pageview SWD methodology page.
Why versions matter — the constants move
SWD v4 restructured the model around the three-segment, operational-plus-embodied split described above. Earlier versions used a single blended energy-per-gigabyte figure applied to total transfer, without separating segments or embodied energy. The calculator keeps that earlier approach available as a v3 legacy toggle, for continuity with figures computed under the older model, but defaults to v4.
The reason the version is not a cosmetic detail is that the per-byte intensities fall over time as two things improve: electricity grids decarbonise, and data-centre, network, and device hardware become more energy-efficient per byte handled. A page whose transfer size never changes will show a falling carbon figure across model versions purely because the constants tracked those efficiency gains. This is why the calculator stamps every result with the model version and the MasterBrain data version it was computed against — so a figure from one vintage and the same page computed on a later vintage are distinguishable in any restatement.
Do not compare a v4 figure against a v3 figure and read the difference as a real-world improvement. Much of any cross-version change is the model’s constants being updated, not the page getting cleaner. Hold the model version fixed when you track a page over time, and treat a version change as a restatement — re-baseline, note it, and compare like with like.
Inputs this calculator needs — and where to source them
Website carbon estimation is a measurement exercise more than a calculation exercise: the arithmetic is fixed, and the accuracy lives entirely in the transfer size you supply. The inputs below drive every result.
| Input | Unit | Primary source | Fallback source |
|---|---|---|---|
| Data transferred per pageview (page weight) | MB or KB | Browser DevTools Network panel (transferred column) on a representative load, or a page-speed / web-performance testing tool | Site-average transfer from your CDN or analytics real-user-monitoring |
| Monthly pageviews | Views/month | Analytics platform pageview count for the page or site | Server access-log request count for the URL |
| New-visitor share | % | Analytics new-versus-returning dimension | Model default (all views treated as new — a conservative upper bound) |
| Green hosting | Off / 100% / Custom % | Your host’s renewable-energy declaration, verified at the Green Web Foundation directory | Off (no green adjustment — the conservative default) |
| Grid region | Country / global | The country your data centre operates in | Global-average grid intensity (the model default) |
Getting the transfer size right — the critical path
Browser DevTools (the reliable route)
Open the page in a private/incognito window (no cache), open DevTools, go to the Network panel, and read the total transferred figure at the bottom — not the resources figure, which is the uncompressed size. The transferred figure is what the model wants: compressed bytes over the wire, with third-party scripts included as they actually load. Reload once with cache primed to see the return-visitor figure.
Web-performance tools (repeatable at scale)
A page-speed or synthetic-monitoring tool returns a transfer-size figure per load and can run on a schedule, which is the right basis for tracking a page-weight budget over time. Confirm the tool reports transferred (post-compression) bytes and captures third-party requests, or it will understate the page.
Real-user monitoring (the truest, if you have it)
RUM data from your CDN or analytics reflects the transfer sizes your real visitors experienced, across their real devices and connections — the most representative basis of all. Use the median rather than the mean if a few heavy loads skew the average.
Third-party scripts (do not omit them)
Tag managers, analytics, chat widgets, ad tags, and embedded media are part of the page’s transfer and often a large part. A transfer size that excludes them flatters the page and misstates the carbon. Measure the page as a visitor loads it, with everything firing.
Green hosting and grid intensity — the two biggest levers
After page weight, the two inputs that move the result most are the grid carbon intensity and the green-hosting setting. Both act on the conversion from energy to carbon rather than on the energy itself, and understanding exactly what each one does — and does not — touch is what keeps the estimate honest.
Grid carbon intensity — where the electricity is generated
Energy becomes carbon at the grid’s intensity, and grids vary enormously — a low-carbon grid can be several times cleaner per kilowatt-hour than a coal-heavy one. The calculator defaults to a global-average intensity for full-population comparability; where you know your data centre’s country, a location-based per-country factor sharpens the data-centre portion of the estimate. The grid factors are drawn from the same electricity-intensity data used across the platform — see the grid electricity emission factors reference for the underlying values and their basis.
Selecting a country grid factor sharpens only the segments consumed at your data centre. The network and user-device segments are consumed wherever your visitors are, on their grids, not yours — so a country selection is a simplification, not a precise geographic attribution. Treat a location-based figure as a better estimate of the hosting portion, not a fully geo-resolved footprint.
Green hosting — a self-declared adjustment to the data-centre segment
The green-hosting control is a user-set switch: Off, 100%, or a custom percentage. When set, it reduces the carbon of the data-centre operational component only — because that is the only electricity the host itself procures, and therefore the only portion a renewable-energy purchase can decarbonise. It does not touch the network segment, the user-device segment, or any embodied energy: those are consumed by hardware the host does not own and cannot green.
Critically, this is a self-declared setting, not a live verification. The calculator does not check your host against any registry; it applies the adjustment you enter. The honest way to use it is to confirm your host’s renewable status first — the Green Web Foundation maintains a public directory of verified green hosts — and only then set the control to match. Setting it to 100% without verification produces a number that looks clean but cannot be defended.
Green hosting is a real lever, but a bounded one: it can only decarbonise the data-centre operational slice, which is a minority of the total per-byte energy in SWD v4. The device and network segments — including all embodied energy — are unaffected. A green host on a heavy page is still a heavy page. Page-weight reduction is the lever with no ceiling; green hosting is the lever with a cap.
The efficiency rating — what the grade and percentile mean
Alongside the grams figure, the calculator assigns a letter rating from A+ to F, banded on grams of CO₂e per pageview under the SWD v4 rating scale. The rating exists to make an abstract gram figure legible: a grade communicates “how does this page compare to the web” in a way a raw number does not.
The v4 rating bands
| Rating | Threshold (gCO₂e/pageview) | Approximate percentile | Reading |
|---|---|---|---|
| A+ | ≤ 0.040 | ~95th | Cleaner than roughly 95% of pages tested |
| A | ≤ 0.079 | ~90th | Cleaner than roughly 90% |
| B | ≤ 0.145 | ~80th | Cleaner than roughly 80% |
| C | ≤ 0.209 | ~70th | Cleaner than roughly 70% |
| D | ≤ 0.278 | ~60th | Cleaner than roughly 60% |
| E | ≤ 0.359 | ~50th | Around the median page |
| F | > 0.359 | Below median | Heavier than the median page tested |
The percentiles are the useful half of the rating: an A+ page sits at roughly the 95th percentile of pages tested, an A at the 90th, a B at the 80th, and so on down to E at the median. The letter is a shorthand for that position. The bands tightened when the model moved to v4 — the same page can carry a lower grade under v4 than it did under the earlier bands, because v4 sets a stricter bar at each threshold — so a grade is only meaningful when read against the model version that produced it.
Chase the grams, not the grade. The rating is a coarse band; two pages inside the same letter can differ by nearly a factor of two. For tracking progress on one page over time, the gram figure is the sensitive metric — the grade will only move at a threshold crossing, and can sit still through real improvement.
Worked example — one page at three optimisation states
This example reproduces exactly against the live calculator. Rather than three different pages, it takes one page and computes it at three optimisation states, to show the single dynamic that defines website carbon: the same page, changed only in weight and hosting, moves across several rating bands. All three assume 10,000 pageviews per month for the annual figure.
The three states
| State | Change made | Page weight | Grid | Green hosting |
|---|---|---|---|---|
| State 1 — baseline | Unoptimised page as built | 2.4 MB | Global average | Off |
| State 2 — lighter page | Image compression, script pruning, font subsetting | 1.0 MB | Global average | Off |
| State 3 — lighter + clean hosting | Same lighter page, moved to a verified green host on a low-carbon grid | 1.0 MB | UK (location-based) | 100% |
State-by-state result
| State | Per pageview | Rating (SWD v4) | Annual @ 10k/month |
|---|---|---|---|
| State 1 — 2.4 MB, global grid, no green | 262.2 mg | D | 31.5 kg/yr |
| State 2 — 1.0 MB, global grid, no green | 109.3 mg | C | 13.1 kg/yr |
| State 3 — 1.0 MB, UK grid + 100% green | 23.7 mg | A+ | 2.84 kg/yr |
The per-pageview figures are shown in milligrams and the annual totals in kilograms, matching the calculator’s own grams-first display, which scales the unit up as the total grows. The v4 rating bands place 262.2 mg (0.2622 g) in band D, 109.3 mg (0.1093 g) in band C, and 23.7 mg (0.0237 g) in band A+ — three different grades for one page, driven only by weight and hosting.
Reading the result — where the savings come from
Two patterns are worth drawing out, because both define how website carbon responds to change.
The first is that page weight is the dominant lever. Going from State 1 to State 2 — cutting transfer from 2.4 MB to 1.0 MB with no change to hosting or grid — drops the per-pageview figure from 262.2 mg to 109.3 mg, a 58% reduction, purely from moving fewer bytes. Weight scales the entire estimate linearly across all three segments and both energy components, so every kilobyte removed cuts data-centre, network, and device energy together. There is no ceiling on this lever: a lighter page is lighter everywhere.
The second is that clean hosting and a clean grid compound on top of a light page, but only on the portion they can touch. Going from State 2 to State 3 — same 1.0 MB page, now on a low-carbon UK grid with 100% green hosting — takes the figure from 109.3 mg to 23.7 mg. That is a large further cut, but note what produced it: a cleaner grid factor applied to the whole estimate, plus the green-hosting adjustment applied to the data-centre operational slice only. Green hosting did not touch the network or device segments or any embodied energy. The lesson generalises: optimise weight first because it scales everything, then clean the grid and hosting to convert the remaining energy at a lower carbon intensity.
Across the three states the same page spans from a D to an A+ — a better-than-tenfold cut in per-pageview carbon and in the annual total, from 31.5 kg to 2.84 kg a year at the same traffic. Weight reduction did most of the first step; grid and hosting did the second. A team that only switches to green hosting, without cutting weight, captures a fraction of what is available — the biggest wins are in the bytes.
Website carbon vs other digital footprints
“Digital carbon” is an umbrella over several distinct footprints, and website carbon is only one of them. Confusing them leads to double-counting or to applying the wrong model, so it is worth drawing the boundaries — especially because the same organisation often needs several of these estimates and they must not overlap.
| Footprint | Activity unit | Right model / tool | Boundary against website carbon |
|---|---|---|---|
| Website carbon (this page) | Data transferred per pageview | Sustainable Web Design Model | The page-serving byte chain: data centre, network, device |
| Video streaming / conferencing | Hours streamed × bitrate | Video streaming & conferencing calculator | Sustained high-bitrate transfer, not a discrete pageload — a different consumption profile |
| Cloud compute | Instance-hours, region, PUE | Digital cloud compute calculator | Back-end processing behind the app, not the bytes delivered to the browser |
| AI inference / training | Compute per query or per run | AI compute calculator | Model compute, distinct from page delivery even when an AI feature sits on the page |
| End-user devices | Device count × lifecycle | End-user devices calculator | Whole-device lifecycle, versus the per-byte device slice SWD amortises into a pageview |
The most common overlap error is counting the same energy twice — for example, adding a full cloud-compute figure for the servers and a website-carbon figure that already includes a data-centre segment for the same requests. Decide which model owns the data-centre energy for a given workload and hold to it. Website carbon owns the page-delivery bytes; cloud compute owns the back-end processing. Draw the line and do not let the segments overlap.
The two result components — per-pageview strip and annualised panel
The calculator reports results in two components, because a website’s carbon answers two different questions: how heavy is one pageview, and what does a year of traffic add up to. The first is the per-pageview metric strip; the second is the annualised panel.
Component one — the per-pageview metric strip
| Metric | Units | What it answers |
|---|---|---|
| Per-pageview emissions | mg or g CO₂e (auto-scaling) | The headline figure — the carbon of loading the page once, blended across new and returning views. |
| Efficiency rating | A+ to F | Where the page sits against the web, banded on the SWD v4 scale. |
| Segment split | % across three segments | How the per-byte energy divides across data centre, network, and user device — showing which segment dominates. |
| New / returning split | mg CO₂e each | The full-weight first-view figure versus the cached return-view figure, before blending. |
Component two — the annualised panel
The annualised panel scales the per-pageview figure across the traffic volume, turning a per-view abstraction into a figure that lands in an inventory:
- Annual emissions (kg or t CO₂e/yr) — the per-pageview figure times your monthly pageviews times twelve, auto-scaling from kilograms to tonnes as the total grows.
- Per-1,000 pageviews — a normalised figure for comparing pages or sites of different traffic on the same basis.
- Optimisation headroom note — a qualitative indication of how much of the total is weight-driven (addressable by page-weight reduction) versus grid-driven (addressable by hosting and region), pointing at the larger lever for this page.
The per-pageview figure is the design metric — the one a team optimises against, sensitive to every kilobyte. The annual figure is the reporting metric — the one that enters a Scope 3 line and lands with stakeholders. Track the per-pageview grams to drive improvement; report the annual kilograms to show what it came to. They are the same estimate at two scales, and both belong in the story.
Reducing website carbon — the levers that actually move it
Because the estimate is page weight times grid intensity, every reduction lever acts on one or the other. The levers below are ordered by how much they typically move the result — weight first, because it scales the entire estimate, then the conversion factors.
Cut image and media weight
Images and video are usually the largest share of page weight. Modern compressed formats, correct sizing for the display, lazy-loading below-the-fold media, and replacing autoplay video with a poster image cut transfer sharply. This is almost always the single biggest available reduction, and it scales all three segments at once.
Prune and defer JavaScript
Unused scripts, oversized frameworks, and third-party tags inflate transfer and often block rendering. Remove what is unused, defer what is non-critical, and audit third-party tags — each one is someone else’s bytes on your page. Script weight is frequently the second-largest lever after media.
Improve caching and the returning-visitor share
Aggressive cache headers on static assets mean returning visitors transfer almost nothing beyond the changed content. This does not cut the first-load figure, but it lowers the blended per-pageview figure in proportion to your repeat traffic — and the calculator rewards it directly through the new-versus-returning split.
Subset fonts and trim the critical path
Web fonts can carry a surprising amount of weight; subsetting to the characters actually used, and limiting the number of weights and styles loaded, trims it. Combined with removing render-blocking resources, this lightens the page a visitor actually receives.
Move to a low-carbon grid and verified green host
Hosting in a low-carbon region and on a verified renewable-powered host cuts the carbon intensity applied to the data-centre segment. It is a real lever, but a capped one — it acts on the conversion factor for one segment, not on the bytes — so it belongs after weight reduction, not instead of it.
GreenCalculus itself runs on Cloudways managed cloud hosting, which lets you pick the cloud provider and data-centre region when you launch a server, so you can put a site on a lower-carbon grid. Check the region’s grid intensity in the grid emission factors before you choose. Referral link: if you sign up through it, GreenCalculus may receive hosting credit. It does not change any number on this page. How we handle referral links.
Set a page-weight budget and hold it
The durable move is governance: set a transfer-size budget per template, measure it in CI or synthetic monitoring, and block regressions before they ship. Weight creeps back without a budget; the calculator’s per-pageview figure is the metric to hold the budget against over time.
Reporting context — SWD, SCI, GHG Protocol Scope 3
Website carbon sits inside the broader digital-emissions and corporate-reporting landscape. The frameworks below cover the standards a team estimating website carbon will typically encounter, and how each relates to the SWD figure this calculator produces.
| Framework | Role for website carbon | Relationship to this calculator |
|---|---|---|
| Sustainable Web Design Model | The estimation methodology. Defines the per-byte segment energy intensities and the conversion to CO₂e. | The model this calculator implements (v4 default, v3 legacy toggle). |
| ISO/IEC 21031 — Software Carbon Intensity (SCI) | An ISO-grade methodology for the carbon intensity of a software function, per functional unit, spanning operational and embodied emissions. | A parallel, more general software-carbon standard. This calculator implements SWD, not SCI — SCI is the route for a rigorous per-function software footprint beyond page delivery. |
| GHG Protocol Scope 3 Standard | The corporate-accounting standard. Website and hosting emissions land in Category 1 (purchased services) or Category 11 (use of sold products). | Where the annualised figure from this calculator is reported in a corporate inventory. |
The distinction between SWD and SCI is worth holding: SWD is a fast, transfer-based estimate purpose-built for websites, while SCI is a general software-carbon-intensity standard that measures per functional unit and demands more instrumentation. This calculator implements SWD. For a page-delivery estimate SWD is the pragmatic choice; for a rigorous, assurance-facing software footprint that spans compute as well as delivery, SCI is the standard to graduate to.
Methodology-integrity checklist — what makes an estimate defensible
A website-carbon figure is easy to produce and easy to produce badly. The findings below are the issues that most often make a per-pageview estimate indefensible — they centre on the transfer-size measurement, the honest use of the green-hosting control, and version discipline, which is where the methodological pressure sits for a per-byte model.
01 — Uncompressed size used instead of transferred bytes
Feeding the uncompressed resource size rather than the transferred (compressed) figure overstates every result. The model’s activity unit is bytes over the wire. Read the transferred figure, not the resources figure, and confirm compression is actually enabled on the live server.
02 — Third-party assets excluded from the page weight
Measuring only first-party assets and omitting tag managers, ad tags, embeds, and chat widgets understates a page that visitors experience in full. Measure the page as it loads for a real visitor, with all third parties firing, or disclose that the figure is first-party only.
03 — Green hosting claimed without verification
Setting the green-hosting control to 100% without confirming the host’s renewable status produces a clean-looking number that cannot be defended. The control is self-declared; verify the host at the Green Web Foundation directory first, and record the verification date in the audit trail.
04 — Model version not recorded
A figure without its SWD version and MasterBrain data version cannot be reconciled later, because the per-byte constants move between versions. Record the model version (v4 or v3) and the data version stamped on the result, so a future restatement can compare like with like.
05 — Cross-version change read as real improvement
Attributing a fall in the figure to optimisation when part of it was a model-version constant update overstates progress. Hold the model version fixed when tracking a page over time; treat a version change as a restatement and re-baseline rather than claiming the delta as a saving.
06 — All views assumed first loads
Treating every pageview as a full-weight new load, when much of the traffic is cached returning visitors, overstates the blended figure. Feed the real new-versus-returning share from analytics; the default all-new assumption is a conservative upper bound, not an accurate one.
07 — Country grid factor read as full geographic attribution
Selecting a data-centre country and treating the whole result as geographically precise ignores that the network and device segments are consumed on visitors’ grids. A country selection sharpens the hosting portion only; do not present it as a fully geo-resolved footprint.
08 — A single page taken as the whole site
Estimating one page and multiplying by total site traffic assumes every page weighs the same, which is rarely true. Estimate representative templates separately, or use a site-average transfer size weighted by each template’s share of traffic, rather than projecting one page across the whole site.
Data sources, factor versioning, and update transparency
Per-byte energy intensities — SWD v4
The calculator reads the SWD v4 segment energy intensities from the MasterBrain and cites the exact figures on each result. The v4 constants, in kilowatt-hours per gigabyte transferred, are:
| Segment | Operational (kWh/GB) | Embodied (kWh/GB) |
|---|---|---|
| Data centre | 0.055 | 0.012 |
| Network | 0.059 | 0.013 |
| User device | 0.080 | 0.081 |
The v3 legacy model, available via the toggle, uses a single blended intensity of 0.81 kWh per gigabyte across all transfer rather than the segmented v4 breakdown. These figures are the intensities behind the worked example above and are surfaced on every result the calculator produces; they update when the model or the underlying MasterBrain data version updates.
Grid carbon intensity
| Factor | Value | Basis | Source |
|---|---|---|---|
| Global-average grid intensity (default) | 494 gCO₂e/kWh | Global average, location-based | Ember global electricity data |
| Per-country grid intensity | Read by country code | National average, location-based | Per the platform grid-factor set |
The global-average default gives a full-population-comparable figure; selecting a country applies that country’s location-based intensity to the data-centre segment. The underlying values and their basis sit in the grid electricity emission factors reference.
Rating bands and versioning
The A+-to-F rating bands are the SWD v4 thresholds and are read from the MasterBrain alongside the energy intensities, so a result and its grade share one data version. The energy intensities, grid factors, and rating bands update on the MasterBrain release cycle; the calculator stamps each result with the MasterBrain version it was computed against, so a figure from one vintage and the same page on a later vintage are distinguishable in restatement work. The SWD model version (v4 or v3 legacy) is independent of the data version and is recorded separately on each result. The full methodology and constant derivations are on the website pageview SWD methodology page.
What’s next — the rest of your digital footprint
Website carbon is one slice of an organisation’s digital emissions. The adjacent footprints below use different activity units and their own models, and together they build a fuller digital picture without overlapping.
Video & streaming
Video Streaming & Conferencing
Hours × bitrate — the sustained-transfer profile that a pageload model does not fit.
Cloud compute
Digital Cloud Compute
Instance-hours, region, and PUE — the back-end processing behind the app.
AI compute
AI Compute — Training & Inference
Compute per run or per query — distinct from page delivery.
End-user devices
End-User Devices
Whole-device lifecycle — the fuller device picture SWD only amortises a slice of.
AI search queries
AI Search Carbon
Per-query footprint of AI-assisted search — an adjacent digital-consumption estimate.
Data-centre efficiency
Data Centre PUE
The facility-overhead multiplier behind the data-centre segment.
The full methodological deep-dive on the per-byte model — segment derivations, the caching split, and the v3-to-v4 changes — is on the paired website pageview SWD methodology page. For the accounting standard that website emissions report into, see the GHG Protocol Scope 3 Standard.
Frequently asked questions
It is the data transferred to load the page multiplied by the energy per gigabyte across three segments — data centre, network, and user device, each with an operational and an embodied component — then converted to CO₂e at the electricity grid’s carbon intensity. The Sustainable Web Design Model v4 supplies the per-gigabyte energy intensities; you supply the transfer size and, optionally, your grid region and hosting status. A new-versus-returning caching split blends the full-weight first view with the lighter cached return view.
Under the SWD v4 bands, A+ (≤0.040 gCO₂e/pageview) is cleaner than roughly 95% of pages tested, A (≤0.079) than ~90%, and B (≤0.145) than ~80%; C, D, and E run down to the median page at E. An A or A+ is a strong target for a content page. The grade is a coarse band, though — for tracking one page over time, watch the gram figure, which moves with every optimisation, rather than the letter, which only changes at a threshold.
Transferred bytes — the compressed data actually sent over the wire, including cached and CDN-served assets, as the browser receives them. Not the uncompressed size of the source files. In browser DevTools, read the transferred total in the Network panel, not the resources total. Using the uncompressed figure overstates every result, because it counts bytes that compression never sends.
No. Green hosting reduces the carbon of the data-centre operational segment only — the electricity the host itself procures — because that is the only portion a renewable-energy purchase can decarbonise. It does not touch the network segment, the user-device segment, or any embodied (hardware manufacturing) energy, which are consumed on hardware the host does not own. A green host on a heavy page is still a heavy page. Cutting page weight is the lever without a ceiling; green hosting is capped to one segment.
No — the green-hosting control is self-declared. You set it to Off, 100%, or a custom percentage, and the calculator applies that adjustment; it does not check your host against any registry. Verify your host’s renewable status first at the Green Web Foundation directory, then set the control to match. Setting it to 100% without verification produces a number that looks clean but cannot be defended in an audit.
SWD v4 splits the per-byte energy across three segments (data centre, network, device), each with an operational and an embodied component, whereas the v3 legacy model applies a single blended energy-per-gigabyte figure to total transfer. The calculator defaults to v4 and keeps v3 as a toggle for continuity with older figures. The per-byte constants also fall between versions as grids and hardware get more efficient, so do not read a v4-versus-v3 difference as a real-world improvement — hold the version fixed when tracking a page over time.
The rating bands tightened when the model moved to SWD v4 — the thresholds are stricter, so the same gram figure can carry a lower grade than it did under the earlier bands. The grams did not change; the bar did. This is why a grade is only meaningful read against the model version that produced it, and why the calculator records the model and data version on every result so grades can be reconciled across a rebanding.
Feed the real new-versus-returning share from your analytics. The calculator computes a full-weight figure for first views (nothing cached) and a reduced figure for return views (static assets already cached), then blends them by your new-visitor percentage. A site with heavy repeat traffic has a materially lower blended per-pageview figure than its first-load weight suggests, and this is where good caching configuration shows up in the number. The default treats all views as new — a conservative upper bound.
Use the global-average default (494 gCO₂e/kWh) for a full-population-comparable figure, or select your data centre’s country for a sharper estimate of the hosting portion. Note the limitation: a country selection only sharpens the segments consumed at your data centre — the network and user-device segments are consumed on your visitors’ grids, wherever they are, so a country choice is a better hosting estimate rather than a fully geo-resolved footprint.
Under the GHG Protocol Scope 3 Standard, website and hosting emissions typically land in Category 1 (purchased goods and services) where hosting is bought in, or Category 11 (use of sold products) where the website is itself the product whose use is being accounted. The annualised figure from this calculator is the number that enters that line. Decide which category owns the workload and avoid double-counting the same energy against a separate cloud-compute figure.
No. This calculator implements the Sustainable Web Design Model, a transfer-based estimate purpose-built for websites. ISO/IEC 21031 Software Carbon Intensity is a broader, ISO-grade standard that measures the carbon intensity of a software function per functional unit and demands more instrumentation. For a fast page-delivery estimate, SWD is the pragmatic tool; for a rigorous software footprint spanning compute as well as delivery, SCI is the standard to graduate to.
It is an order-of-magnitude estimate, not a metered measurement. The model infers energy from transfer size and published intensity constants rather than instrumenting servers and devices, so the constants carry real uncertainty and the segment allocations are population averages, not your specific infrastructure. That makes it well-suited to comparing designs, holding a page-weight budget, and producing a defensible operational figure — and not a substitute for a metered data-centre inventory. Its accuracy depends most on feeding a real transferred page weight rather than a guessed one.
Methodology notes and limitations
Model version. Calculator implements the Sustainable Web Design Model v4 as the default, with the v3 blended-intensity model available as a legacy toggle. Each result carries a model-version stamp and a MasterBrain data-version stamp so figures are auditable against the version under which they were computed. The v4 rating bands are used for the letter grade.
Estimation, not measurement. This is a per-byte estimation model. It infers energy from transfer size and published intensity constants; it does not instrument servers, networks, or devices. The per-segment intensities are population averages with genuine uncertainty, not measurements of your specific infrastructure. Use the figure for design comparison, budgeting, and order-of-magnitude reporting — not as a metered inventory.
Transfer size taken at face value. The calculator uses the page weight you enter and does not independently measure it. You are responsible for supplying the transferred (compressed) size as a real visitor receives it, with third-party assets included. A wrong transfer size is the largest source of error in the result.
Grid attribution is simplified. Selecting a country applies that country’s grid intensity, but the network and user-device segments are physically consumed on visitors’ grids, not the data centre’s. A country selection sharpens the hosting portion only and is not a fully geo-resolved footprint.
Green hosting is self-declared. The green-hosting control applies the adjustment you set to the data-centre operational segment only; it does not verify your host and does not affect the network, device, or embodied components. Verify renewable status at the Green Web Foundation before claiming it, and record the verification in the audit trail.
Scope boundary. The calculator estimates operational and embodied energy of page delivery per the SWD segments. It does not cover back-end compute beyond the data-centre serving slice, AI-feature compute, or whole-device lifecycle — those belong in the adjacent digital calculators. Deciding which model owns a given workload’s energy is the reader’s responsibility, to avoid double-counting.
No assurance opinion. Results are estimates and do not constitute an assurance opinion. Before use in a corporate inventory, an IFRS S2 or CSRD disclosure, or an external report, the inputs — transfer size and its measurement basis, traffic volume, new-versus-returning share, grid region, and hosting verification — should be documented and reviewed. The full methodological deep-dive is on the paired website pageview SWD methodology page.