
Electricity Emission Factor

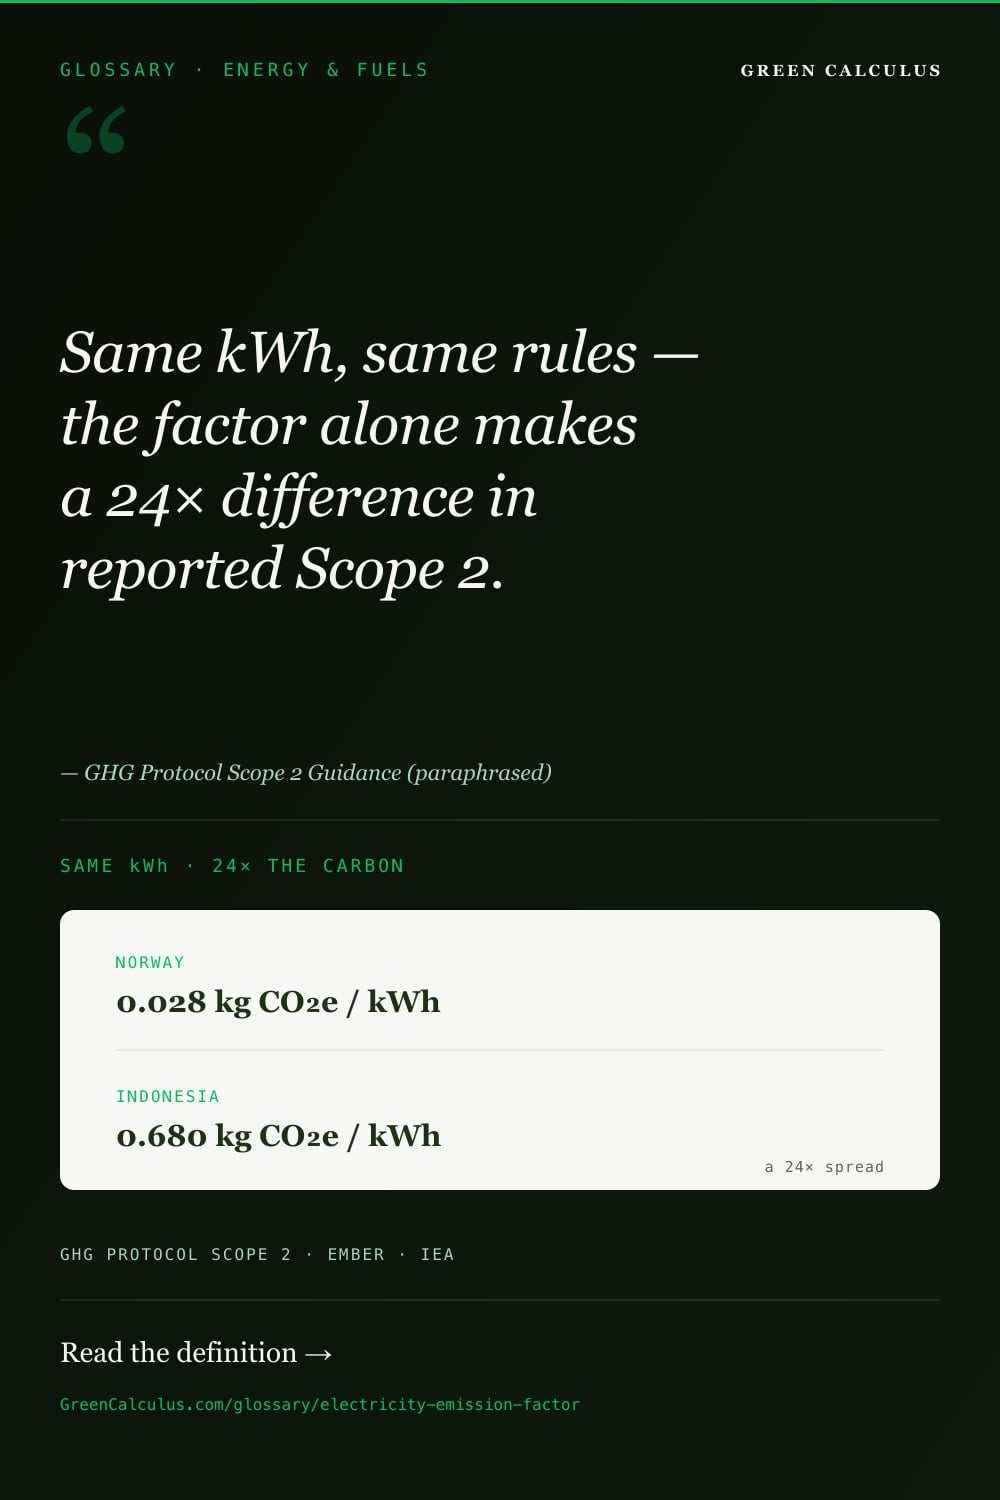
One kilowatt-hour consumed in Norway emits 0.028 kg CO₂. The same kilowatt-hour consumed in Indonesia emits 0.680 kg CO₂. The formula is identical, the consumption is identical, the GHG Protocol rules are identical — the emission factor alone produces a 24× difference in reported Scope 2 emissions on the same load. For a 1 GWh data centre, that is the difference between 9 tCO₂e and 751 tCO₂e annually. The factor is the entire story.
This article delivers the canonical reference for electricity emission factors as they apply to Scope 2 reporting under the GHG Protocol Corporate Standard, CSRD/ESRS E1, CDP Climate Change, and SBTi Corporate Net-Zero Standard. It defines the three distinct factor types (grid average, supplier-specific, residual mix) and when each applies; maps the factor source hierarchy by geography (DEFRA, Ember, EPA eGRID, AIB) including the vintage-match rule; provides a 30-country reference table sorted ascending by intensity; and surfaces the six selection errors that recur at independent verification — including the units-mismatch error specific to electricity (kg CO₂e/kWh vs kg CO₂e/GBP) that breaks Scope 2 figures by orders of magnitude.
An electricity emission factor is the greenhouse gases emitted per unit of electricity, in kg CO₂e/kWh. Three types apply: grid-average (location-based Scope 2), supplier-specific or EAC-backed (market-based), and residual mix. National values span about 24×.
Definition and Unit Basis
An electricity emission factor is a coefficient that converts a quantity of consumed electricity into its associated greenhouse gas emissions. The standard unit is kg CO₂e/kWh (kilograms of carbon dioxide equivalent per kilowatt-hour), with two equivalent expressions in common use: g CO₂e/kWh (multiply kg by 1,000) and tCO₂e/MWh (numerically identical to kg CO₂e/kWh).
The factor aggregates emissions across all generation technologies in the scope of measurement — coal, natural gas, oil, nuclear, hydro, solar, wind, geothermal, biomass — weighted by each technology’s share of generation in the period and geography under consideration. Most published factors aggregate the seven Kyoto Protocol gases (CO₂, CH₄, N₂O, HFCs, PFCs, SF₆, NF₃) into a single CO₂e value using Global Warming Potential at GWP-100. The reporting basis matters: DEFRA 2025 and Ember 2025 use IPCC AR6 GWP-100 values; EPA eGRID 2023 (release year) still uses AR5 GWP-100 — a consequential mismatch documented in §8.
The factor is multiplied by consumed kilowatt-hours to produce the emissions associated with that consumption: tCO₂e = kWh × factor (kg CO₂e/kWh) ÷ 1,000. The simplicity of the multiplication conceals the depth of methodological choice in the factor itself — which generation pool, which gases, which GWP basis, which year, which boundary.
An electricity emission factor is not a single number — it is one of three structurally distinct types applied in three different reporting contexts. The grid-average factor answers “what did the grid emit on average?”. The supplier-specific or EAC factor answers “what did the contracted generation emit?”. The residual mix factor answers “what is left over after EACs are claimed by other parties?”. Using the wrong type for the reporting context — defaulting to grid average when residual mix is required, or claiming a supplier-zero factor without verified EAC retirement — is the single most common Scope 2 methodology error and is caught at first independent verification.
Three Types of Electricity Emission Factor
The GHG Protocol Scope 2 Guidance (2015) and the Scope 2 dual-reporting requirement under CSRD/ESRS E1 distinguish three factor types that apply in three non-interchangeable contexts. Mixing them produces the silent compliance failures that emerge at SBTi target validation and CSRD assurance.
| Type | What it represents | When it applies | Source | Can it be zero? |
|---|---|---|---|---|
| Grid average most common | Average emissions intensity of the grid at the point of consumption — every MWh on the grid carries the same factor regardless of who paid for which generator | Location-based Scope 2; CSRD primary disclosure figure under E1-6 | DEFRA (UK) · Ember (most countries) · EPA eGRID (US, sub-national) · ECCC (Canada, provincial) | No — always positive while any fossil generation remains in the mix |
| Supplier-specific / EAC factor | Emissions intensity of the specific contracted generation source — utility-disclosed mix or zero-factor backed by retired Energy Attribute Certificates | Market-based Scope 2 when a valid contractual instrument is held and retired in the company’s name | Utility annual disclosure · EAC registry retirement statement (Ofgem REGO, AIB Hub, NERC NAR, I-REC operators) | Yes — zero if 100% of consumption is matched by retired EACs from zero-emission generation meeting all eight Quality Criteria |
| Residual mix | Grid average minus the cleaner generation that has already been claimed by EAC retirements — the dirtier remainder allocated across uncovered consumption | Market-based Scope 2 fallback when no qualifying EAC is held for the consumption period | AIB (EU member states, annual) · Ofgem (UK, annual) · Green-e (US voluntary market) · I-REC operators (international) | No — typically higher than the grid average for the same geography, because cleaner generation has been EAC-claimed |
The three types are non-substitutable. Defaulting to grid average when no EAC is held silently understates market-based emissions; claiming a supplier-zero factor without verified EAC retirement fails Quality Criterion 7. The taxonomy holds across all geographies — only the registry operators and publication cadences vary.
Factor Sources by Geography
Grid-average factors are published by national or regional regulators on annual or biennial cadences. The factor selection hierarchy applies geographic specificity first, then vintage match — use the most localised credible factor, matched to the consumption year.
Source by region
| Geography | Authoritative source | Granularity | Cadence | GWP basis |
|---|---|---|---|---|
| United Kingdom | DEFRA UK Government GHG Conversion Factors | National | Annual (June release) | AR6 GWP-100 |
| European Union (each MS) | Ember Yearly Electricity 2025 · AIB residual mix (market-based) | National | Annual | AR6 GWP-100 |
| United States use sub-national | EPA eGRID (national + 26 NERC subregions) | Sub-national (NERC subregion) | Biennial (release year ≠ data year) | AR5 GWP-100 (eGRID 2023 release) |
| Canada | ECCC National Inventory Report | Sub-national (provincial) | Annual | AR6 GWP-100 |
| India, China, ASEAN | Ember Yearly Electricity 2025 | National | Annual | AR6 GWP-100 |
| Rest of world | Ember country averages (~150 countries) | National | Annual | AR6 GWP-100 |
Vintage match — the often-skipped second-tier rule
The Scope 2 Quality Criteria require not just the right source but the right vintage: the factor must correspond to the consumption year, or — where same-year data is not yet available at the time of disclosure — the most recent published factor. Vintage errors are the most-overlooked compliance failure on this page. A 2026 consumption figure paired with a DEFRA 2024 factor is a Quality Criteria failure even if the result happens to be conservative; the assurance team will request the source publication at audit and find the mismatch.
EPA eGRID adds a disambiguation wrinkle: each annual release lags its data year (the eGRID 2023 release, published January 2025, covers 2023 data-year operations). The MasterBrain stores both the release year (used for citation) and the data year (used for factor matching to consumption). Verifiers may request either — audit-grade attribution carries both.
Grid factors decarbonise year-on-year in most markets as renewables grow. The DEFRA UK grid factor fell from 0.20705 kg CO₂e/kWh (DEFRA 2024) to 0.131 [GreenCalculus grid.gbr.electricity.location_based · DEFRA 2026 'UK electricity'!E25 · v2026.203] (DEFRA 2025) — a 15% reduction in one annual cycle reflecting cleaner UK grid mix. Companies still using the DEFRA 2024 factor in their 2026 disclosure overstate Scope 2 by 17% (the inverse delta). The vintage Quality Criterion is binding; failing to update annually is a verification finding regardless of which direction the factor moves.
Reference Table — 30 Country Factors
The table below lists 30 representative grid-average factors, sorted ascending by intensity, with the [gc_grid] shortcode key for runtime live-reference lookup. Values are read directly from MasterBrain v2025.6 and update automatically when the next Ember Yearly Electricity Data release, DEFRA conversion factors release, or EPA eGRID release lands.
| Country / Region | Scope 2 (kg CO₂e/kWh) | Lifecycle (kg CO₂e/kWh) | Scope 2 source | Grid mix note | [gc_grid] key |
|---|---|---|---|---|---|
| Norway cleanest | — | 0.028 | — none published | ~99% hydropower | NO |
| Sweden | — | 0.035 | — none published | Hydro + nuclear | SE |
| Switzerland | — | 0.039 | — none published | Hydro + nuclear | CH |
| France | 0.035 | 0.041 | — none published | ~70% nuclear | FR |
| Austria | — | 0.117 | — none published | Hydro-dominant | AT |
| Brazil | — | 0.110 | — none published | Hydro dominant | BR |
| Finland | — | 0.057 | — none published | Nuclear + hydro + bio | FI |
| Denmark | — | 0.100 | — none published | Wind-led mix | DK |
| US — Upstate NY (NYUP) | 0.110 | — | EPA eGRID 2023 | Hydro 31% + nuclear 31% | US_NYUP |
| Canada (national avg) | 0.111 | 0.191 | ECCC (consumption basis) | Use provincial — 30× spread | CA |
| Portugal | — | 0.128 | — none published | Renewables-led mix | PT |
| Belgium | — | 0.109 | — none published | Nuclear-heavy | BE |
| Spain | — | 0.154 | — none published | Renewables + nuclear | ES |
| United Kingdom | 0.131 | 0.217 | DEFRA 2025 | −15% vs DEFRA 2024 (was 0.20705) | GB |
| US — California (CAMX) | 0.195 | — | EPA eGRID 2023 | Gas + solar | US_WECC_CAMX |
| Chile | — | 0.291 | — none published | Mixed; solar growing | CL |
| US — Pacific Northwest (NWPP) | 0.288 | — | EPA eGRID 2023 | Hydro 44% | US_WECC_NWPP |
| Argentina | — | 0.343 | — none published | Gas-heavy with hydro | AR |
| Netherlands | 0.200 | 0.254 | — none published | Gas + growing wind | NL |
| Ireland | — | 0.256 | — none published | Gas + wind | IE |
| Italy | — | 0.285 | — none published | Gas-heavy mix | IT |
| US — Mid-Atlantic (RFCE) | 0.272 | — | EPA eGRID 2023 | Gas 50% + nuclear 36% | US_RFCE |
| US — Texas (ERCT) | 0.334 | — | EPA eGRID 2023 | Gas 47% + wind 23% + coal 16% | US_ERCT |
| Germany | — | 0.330 | — none published | Coal phase-out in progress | DE |
| UAE | — | 0.468 | — none published | Gas + nuclear ramp | AE |
| US — Florida (FRCC) | 0.356 | — | EPA eGRID 2023 | Gas 74% + nuclear 12% | US_FRCC |
| US (national average) | 0.350 | 0.384 | EPA eGRID 2023 | Use NERC subregion for accuracy | US |
| Singapore | — | 0.497 | — none published | Gas-dominant | SG |
| South Korea | — | 0.417 | — none published | Gas + nuclear + coal | KR |
| Mexico | — | 0.474 | — none published | Gas-heavy | MX |
| Japan | — | 0.477 | — none published | Gas + LNG-heavy post-Fukushima | JP |
| US — Ohio Valley (RFCW) | 0.416 | — | EPA eGRID 2023 | Gas 32% + coal 31% + nuclear 28% | US_RFCW |
| Australia (national avg) | 0.620 | 0.525 | DCCEEW NGA 2025 | Coal-heavy declining | AU |
| China | — | 0.526 | — none published | Declining as solar/wind scales | CN |
| Malaysia | — | 0.603 | — none published | Gas + coal | MY |
| Philippines | — | 0.595 | — none published | Coal-heavy | PH |
| US — SERC Midwest (SRMW) | 0.566 | — | EPA eGRID 2023 | Coal 59% + nuclear 15% | US_SRMW |
| Poland | — | 0.591 | — none published | Coal-heavy mix | PL |
| India | — | 0.671 | — none published | Coal-dominant | IN |
| Indonesia highest | — | 0.681 | — none published | Coal-dominant | ID |
| UK residual mix (illustrative) | ~0.200 | — | Ofgem / AIB — annual | Not in MasterBrain — registry source required | n/a |
All factor values read live from MasterBrain v2025.6. The final row (UK residual mix) is hardcoded and italicised — residual mix factors are excluded from MasterBrain by design (see §6 below) and must be sourced annually from the registry of issuance. Values are kg CO₂e/kWh; multiply by 1,000 to convert to g CO₂e/kWh, or use numerically as tCO₂e/MWh.
A 1 GWh annual data centre load — modest by hyperscale standards — produces 28 tCO₂e in Oslo (Norway grid factor 0.028 kg CO₂e/kWh) and 680 tCO₂e in Jakarta (Indonesia grid factor 0.680 kg CO₂e/kWh) — both Ember 2025 lifecycle intensity, frozen here as a worked example per the audit-record convention. Same workload. Same uptime. Same servers. The factor alone is the entire emissions story. For multinational enterprises whose Scope 2 footprint depends on where compute, manufacturing, and offices are physically located, the location decision precedes every other decarbonisation decision in marginal impact. The location-based figure is what surfaces this — and it is precisely the figure that does not respond to procurement.
How to Select the Correct Factor
Factor selection follows a four-step decision process. Apply in order; do not skip steps.
- Step 1 — Reporting context. Determine which Scope 2 method you are calculating. Location-based requires a grid-average factor. Market-based requires either a supplier-specific / EAC factor (Tier 1–4) or a residual mix factor (Tier 5 fallback). The dual-reporting rule means most companies calculate both — and therefore select two different factors for the same kWh.
- Step 2 — Geographic specificity. Use the most localised credible factor. For US consumption, this means the EPA eGRID NERC subregion factor — not the national average — wherever the consumption ZIP code is known. For Canadian consumption, ECCC provincial factors over the national average (hydro provinces differ ~30× from coal provinces). For EU consumption, Ember country factors per member state. For UK consumption, the DEFRA UK national factor (no sub-national tier published).
- Step 3 — Vintage match. Use the factor for the consumption year, or the most recent published factor where same-year data is not yet available. DEFRA 2025 for 2025 UK consumption; Ember 2025 for 2025 international consumption; EPA eGRID 2023 release (2023 data-year) for 2023–2024 US consumption — and so on. The vintage Quality Criterion binds in both directions: an older factor that happens to be conservative is still a verification finding.
- Step 4 — T&D losses are NOT in the factor. Published grid factors (DEFRA, Ember, EPA eGRID) are gross-generation factors. Transmission and distribution losses for purchased grid electricity are reported under Scope 3 Category 3b (Fuel- and energy-related activities, T&D losses) — not by grossing-up the Scope 2 figure. The frequent question “do I add 8% for T&D?” has a single answer: no, that figure goes in Scope 3 Cat 3b at consumed kWh × loss percentage × grid factor. The Scope 2 figure uses the published grid factor unchanged.
For a UK office consuming 50,000 kWh, T&D losses contribute approximately 50,000 × 0.08 × 0.177 / 1,000 ≈ 0.71 tCO₂e — and that 0.71 tonnes belongs in Scope 3 Category 3b, not stacked onto the 8.85 tCO₂e Scope 2 figure. MasterBrain v2025.6 grid factors are explicitly gross-generation factors and do not pre-bake T&D losses into Scope 2; the §6 methodology section documents why this is the correct boundary placement under the GHG Protocol.
How Electricity Emission Factors Are Calculated
A grid-average emission factor is built by aggregating the emissions of every generator in the scope of measurement, dividing by the electricity output of those generators in the same period, and converting to a common unit. The mechanics matter because three methodological choices — generation pool, gas coverage, and gross-vs-net basis — determine whether two factors from different sources are comparable.
Generation pool — what generators are included
National factors include all generators connected to the national grid in the measurement year, weighted by share of generation. Sub-national factors (EPA eGRID NERC subregions, ECCC provincial) restrict the pool to generators within the sub-national footprint. Cross-border imports are typically attributed to the importing country’s mix at the import-weighted average of the exporting country’s factor — a methodology documented in the underlying dataset metadata but rarely material below 5% net imports.
Gas coverage and GWP basis — the AR5/AR6 question
Most published factors aggregate the seven Kyoto Protocol gases (CO₂, CH₄, N₂O, HFCs, PFCs, SF₆, NF₃) using Global Warming Potential at GWP-100. The choice of GWP basis materially affects the factor: AR6 GWP-100 values (CH₄ fossil = 29.8, N₂O = 273) replace AR5 GWP-100 values (CH₄ fossil = 30, N₂O = 265). DEFRA 2025 and Ember 2025 use AR6; EPA eGRID 2023 release still uses AR5 — the AR6 transition for eGRID is expected in a future release. The mismatch is small (typically 1–3% on aggregate factors) but documented; it is one reason multinational reporters cannot directly compare DEFRA-sourced and EPA-sourced sub-totals without a methodology footnote.
Gross-vs-net basis — the denominator question
Three denominators produce numerically different factors from the same emissions data. Gross generation divides emissions by total generator output before subtracting on-site auxiliary consumption — the basis used by EPA eGRID. Net generation divides by output sent to the transmission system after auxiliary loads — the basis used in some national-inventory presentations. Consumption-based divides by metered demand, accounting for transmission and distribution losses — used by AIB residual mix calculations. The differences are 2–8% depending on geography. MasterBrain v2025.6 grid factors are stored at gross-generation basis throughout, mirroring EPA eGRID convention, with T&D losses handled separately under Scope 3 Cat 3b. Mixing factors of different basis across sources without normalisation produces a 2–8% error — usually undetected at corporate reporting level but flagged at high-precision use cases (24/7 CFE matching, hourly carbon accounting).
Why residual mix is excluded from MasterBrain
The residual mix factor is structurally distinct from grid-average factors and is not published by MasterBrain v2025.6. Three reasons. First, residual mix updates on registry-specific cadences (AIB annual per EU member state, Ofgem annual for UK, Green-e annual for US voluntary market, I-REC operators per market) — bundling them into MasterBrain would force near-continuous MasterBrain version bumps inconsistent with the deliberate version-bump model. Second, attribution must be to the original publication for audit traceability; MasterBrain abstraction would obscure which Ofgem disclosure year produced which value. Third, the values are bilateral by design — a UK residual mix figure from Ofgem is structurally different from a UK residual mix figure derived independently. The /glossary/residual-mix/ page and the calculator runtime ingest registry data directly. The illustrative ~0.200 kg CO₂e/kWh used on this page is for methodology demonstration only.
Factors and Scope 2 Reporting — Formula and Worked Examples
Every Scope 2 calculation reduces to the same multiplication, applied with the factor selected per §5.
tCO₂e = kWh consumed × factor (kg CO₂e/kWh) ÷ 1,000
Factor type matched to reporting context: grid average → location-based; supplier/EAC → market-based; residual mix → market-based fallback.
Worked examples — same 50,000 kWh load, three contexts
| Scenario | Factor type | Factor (kg CO₂e/kWh) | Calculation | Result (tCO₂e) |
|---|---|---|---|---|
| 1 — UK office, location-based | Grid average | 0.177 (DEFRA 2025) | 50,000 × 0.177 / 1,000 | 8.85 |
| 2 — UK office, market-based with retired REGO | Supplier / EAC zero-factor | 0.000 (REGO retired) | 50,000 × 0.000 / 1,000 | 0.00 |
| 3 — Germany office, location-based | Grid average | 0.330 (Ember 2025) | 50,000 × 0.330 / 1,000 | 16.50 |
Examples 1 and 3 demonstrate the geographic-driver effect within a single reporting method: the same 50,000 kWh produces 8.85 tCO₂e in the UK and 16.50 tCO₂e in Germany — both location-based, both compliant, identical input. Example 2 shows the procurement-driver effect: same UK consumption, same year, but a retired REGO covering the full load drops the market-based figure to zero while the location-based figure (Example 1, 8.85 tCO₂e) is unchanged. The dual-reporting rule under CSRD/ESRS E1 requires both numbers wherever market-based instruments are claimed.
Apply the correct factor for your country — and run location-based vs market-based Scope 2 in the same calculation.
The Scope 2 Electricity Calculator selects the right factor by geography and vintage, validates each market-based claim against the eight Quality Criteria, and produces both location-based and market-based figures with full source provenance — ready for CSRD E1-6, CDP C6.3, and SBTi target submission.
Six Common Mistakes
- Wrong factor type for the reporting context. Using a grid-average factor in market-based Scope 2 when no EAC is held is the most common error. The market-based fallback is residual mix — not the grid average. UK residual mix is illustratively ~0.200 kg CO₂e/kWh against the DEFRA 2025 grid factor of 0.177 — a 13% delta. Reporting market-based equal to location-based on uncovered consumption silently understates emissions every year and is caught at first independent verification. See /glossary/scope-2-market-based/ for the full instrument hierarchy.
- Stale factor vintage. Grid factors decarbonise year-on-year — the DEFRA UK factor fell from 0.20705 (DEFRA 2024) to 0.177 (DEFRA 2025), a 15% reduction in one cycle. Companies still using the 2024 factor in their 2026 disclosure overstate Scope 2 by 17% (the inverse delta). The vintage Quality Criterion is binding regardless of which direction the factor moves; failing to update annually is a verification finding.
- National factor where sub-national is published. Using the EPA eGRID national average (0.350 kg CO₂e/kWh [GreenCalculus grid.usa.national.location_based · EPA EGRID 2023 'US23'!X3]) for a US site in Upstate NY (0.110 [GreenCalculus grid.usa.subregion.nyup.location_based · EPA EGRID 2023 'SRL23'!Z17]) overstates emissions roughly 3×. Using the same national average for a SERC Midwest site (0.566 [GreenCalculus grid.usa.subregion.srmw.location_based · EPA EGRID 2023 'SRL23'!Z26]) understates by 38%. Both errors trip the geographic-specificity Quality Criterion. Where EPA eGRID, AIB, ECCC, or another regulator publishes a sub-national factor, the sub-national factor is required.
- T&D losses double-counted into Scope 2. Published grid factors are gross-generation — they do not pre-bake T&D losses, but they also do not require grossing-up. T&D losses for purchased grid electricity belong in Scope 3 Category 3b, calculated as consumed kWh × loss percentage × grid factor. Companies that gross-up Scope 2 by 8% for “transmission losses” double-count, since the actual T&D number belongs separately under Cat 3b.
- GWP basis mismatch between sources. DEFRA 2025 and Ember 2025 use IPCC AR6 GWP-100 values (CH₄ fossil = 29.8, N₂O = 273). EPA eGRID 2023 release still uses AR5 GWP-100 (CH₄ fossil = 30, N₂O = 265). The aggregate factor difference is small (1–3%) but real, and the methodological footnote is required at CSRD assurance for multinational reporters using both DEFRA-sourced UK factors and EPA-sourced US factors. Mixing the two without disclosing the AR5/AR6 boundary is a methodology gap. See AR6 GWP values for the full transition matrix.
- Wrong DEFRA factor — kWh vs GBP units. DEFRA publishes both an electricity grid factor in kg CO₂e/kWh (the value used in Scope 2 throughout this article) and a separate electricity supply chain spend factor in kg CO₂e/GBP for use in Scope 3 Cat 1 and Cat 3 spend-based calculations. The two factors share the word “electricity” and the source DEFRA but are unit-incompatible. Applying the spend-based factor to a kWh figure (or vice versa) breaks the calculation by orders of magnitude — and the error is silent because both factors look like reasonable DEFRA electricity numbers in a methodology footnote. The check is unit-based: Scope 2 uses kg CO₂e/kWh against metered consumption; Scope 3 spend uses kg CO₂e/GBP against accounts-payable spend. Confirm the unit before applying.
The AR5 → AR6 transition is unevenly adopted. DEFRA 2025 and Ember 2025 are AR6; EPA eGRID 2023 release is AR5. The numerical impact on aggregate CO₂e factors is small (1–3% for typical electricity mixes) but cumulative across a large multinational footprint and it is a documented audit finding. CSRD/ESRS E1 requires “latest IPCC” — currently AR6 — for all gases reported in CO₂e, including indirect emissions from purchased electricity. Companies relying on EPA eGRID factors for US consumption should disclose the AR5 basis in the methodology footnote and recalculate to AR6 where the comparison materially affects the number.
Regulatory Context
Electricity emission factors underpin Scope 2 disclosure under every major framework. The factor type and source must match the reporting requirement.
| Framework | Factor requirement | GWP basis | Reference |
|---|---|---|---|
| GHG Protocol Corporate Standard | Grid factor for location-based; supplier/EAC/residual for market-based | Latest IPCC (AR6) | View standard → |
| GHG Protocol Scope 2 Guidance (2015) | Defines factor hierarchy and Quality Criteria for both methods | Latest IPCC (AR6) | View standard → |
| CSRD / ESRS E1 most prescriptive | Datapoint E1-6 — both LB and MB factors required where instruments claimed | AR6 GWP-100 (latest IPCC) | View standard → |
| CDP Climate Change | C6.3 — both factors disclosed; vintage and source per Quality Criteria | AR6 GWP-100 (from 2023 cycle) | CDP guidance v2024+ |
| SBTi Corporate Net-Zero v1.1 | Market-based factor is operative for Scope 2 progress; additionality overlay | AR6 GWP-100 | SBTi guidance v1.1+ |
| ISO 14064-1:2018 | Indirect emissions from imported energy; factor source disclosure required | Latest IPCC (AR6) | View standard → |
Dataset — the full factor set behind this term, versioned with source provenance and downloadable as CSV with a citable Zenodo DOI, is published as the Google Cloud region carbon-intensity dataset.
Related Terms, Standards, Data, and Tools
Frequently Asked Questions
An electricity emission factor is the greenhouse gas emissions associated with one unit of electricity, expressed in kilograms of CO₂-equivalent per kilowatt-hour (kg CO₂e/kWh). Three distinct types apply: grid-average factors for location-based Scope 2 (DEFRA, Ember, EPA eGRID); supplier-specific or EAC-backed factors for market-based Scope 2 when valid EACs are retired in the company’s name; and residual mix factors for the market-based fallback when no EAC is held (Ofgem, AIB). Values range from 0.028 kg CO₂/kWh in Norway to 0.680 in Indonesia — a 24× spread on identical kilowatt-hours. The factor multiplies consumed kWh to produce emissions in tonnes of CO₂e: tCO₂e = kWh × factor / 1,000.
For the UK, use DEFRA’s annual GHG Conversion Factors (0.131 kg CO₂e/kWh [GreenCalculus grid.gbr.electricity.location_based], DEFRA 2025). For the United States, use EPA eGRID at the NERC subregion level — the national average (0.350 [GreenCalculus grid.usa.national.location_based]) is a fallback only; subregion factors range from 0.110 [GreenCalculus grid.usa.subregion.nyup.location_based] (Upstate NY) to 0.566 [GreenCalculus grid.usa.subregion.srmw.location_based] (SERC Midwest), a 5× spread inside one country. For Canada use ECCC provincial factors, and for Australia the DCCEEW NGA national factor. For the European Union and most of the rest of the world there is no published national location-based factor — report that absence rather than substituting one. Ember Yearly Electricity 2025 publishes a lifecycle intensity for those countries (Germany 0.330 [GreenCalculus grid.deu.electricity.lifecycle_intensity · EMBER 2025], France 0.041 [GreenCalculus grid.fra.electricity.lifecycle_intensity · EMBER 2025], India 0.671 [GreenCalculus grid.ind.electricity.lifecycle_intensity · EMBER 2025], Indonesia 0.681 kg CO₂e/kWh) [GreenCalculus grid.idn.electricity.lifecycle_intensity · EMBER 2025], which is a different instrument and is not a Scope 2 factor. Match the factor vintage to the consumption year per the Scope 2 Quality Criteria. The §4 reference table on this page covers 30+ countries and US subregions sorted ascending by intensity.
The factor reflects the generation mix of the grid in the measurement period. Measured on lifecycle intensity — the only series covering every country — grids dominated by hydropower (Norway ~99% hydro, 0.028 kg CO₂e/kWh) [GreenCalculus grid.nor.electricity.lifecycle_intensity · EMBER 2025], nuclear (France ~70% nuclear, 0.041 [GreenCalculus grid.fra.electricity.lifecycle_intensity]), or wind (Denmark, 0.100 [GreenCalculus grid.dnk.electricity.lifecycle_intensity · EMBER 2025]) sit below 0.13 kg CO₂e/kWh. Grids dominated by coal (Indonesia 0.681 [GreenCalculus grid.idn.electricity.lifecycle_intensity], India 0.671 [GreenCalculus grid.ind.electricity.lifecycle_intensity], Poland 0.591 [GreenCalculus grid.pol.electricity.lifecycle_intensity · EMBER 2025]) sit above 0.6 kg CO₂e/kWh. The 24× spread between the cleanest and dirtiest grids reflects 50+ years of accumulated infrastructure decisions — generation capacity built decades ago continues to set the marginal emissions intensity until retired and replaced. For corporate reporters, this means the location of physical operations is often the single largest driver of Scope 2 emissions, ahead of energy efficiency and procurement combined. Consumption decisions made today inherit emissions from generation infrastructure built decades earlier.
It depends on which Scope 2 method you are calculating. For location-based Scope 2 — always use the grid average from DEFRA, Ember, EPA eGRID, or your regional regulator. The dual-reporting rule means this figure is required for every Scope 2 disclosure regardless of procurement. For market-based Scope 2 — the answer depends on whether you hold a qualifying contractual instrument. If yes, the supplier-specific or EAC factor applies (typically zero for retired renewable EACs meeting all eight Quality Criteria). If no, use the residual mix factor — not the grid average. UK residual mix is illustratively ~0.200 kg CO₂e/kWh against the DEFRA 2025 grid factor of 0.131 [GreenCalculus grid.gbr.electricity.location_based] — a 13% delta in the wrong direction. Using grid average as the market-based fallback silently understates emissions every year and is caught at first verification. See /glossary/scope-2-market-based/ for the full instrument hierarchy.
Annually for most major sources. DEFRA publishes UK conversion factors annually in June. Ember refreshes its Yearly Electricity Data annually. EPA eGRID releases annually each January with a data-year lag (the eGRID 2023 release published January 2025 covers 2023 data-year operations). AIB publishes EU residual mix factors annually each spring. Ofgem publishes UK residual fuel mix annually. Year-on-year changes can be material: the DEFRA UK grid factor fell 15% in one cycle (DEFRA 2024 = 0.20705 kg CO₂e/kWh → DEFRA 2025 = 0.177 kg CO₂e/kWh) reflecting cleaner grid mix; in volatile years, factors can move 10–20% reflecting fossil-vs-renewable generation share shifts. The Scope 2 Quality Criterion on vintage match is binding — use the factor for the consumption year, or the most recent published factor where same-year is unavailable. Failing to update annually is a verification finding regardless of which direction the factor moves.
Build your Scope 2 disclosure on the right factor for the right context.
GreenCalculus tools select the factor type by reporting method, match vintage to consumption year, and produce both location-based and market-based figures with full source provenance — DEFRA 2025, Ember Yearly Electricity 2025, EPA eGRID 2023, AR6 GWP-100. Built directly on the GHG Protocol Scope 2 Guidance and the eight Quality Criteria — audit-grade by default.
Need someone who does this? 6 carbon accounting & inventory providers in our directory →