EU CBAM Calculator — Embedded Emissions in Imported Goods
Compute the embedded emissions of imported CBAM goods for your CBAM report — direct and indirect, per good and per country — on the EU CBAM Annex I default values, with an optional estimate of the certificates due and their cost.
This calculator builds the embedded-emissions figures for a CBAM report; it is not the report submission. The CBAM transitional-phase report is filed through the EU CBAM registry. This tool computes the embedded emissions of each imported good — the number the report turns on — so you can assemble, sanity-check, and cost the figures before you file. It does not submit on your behalf and does not replace the official guidance.
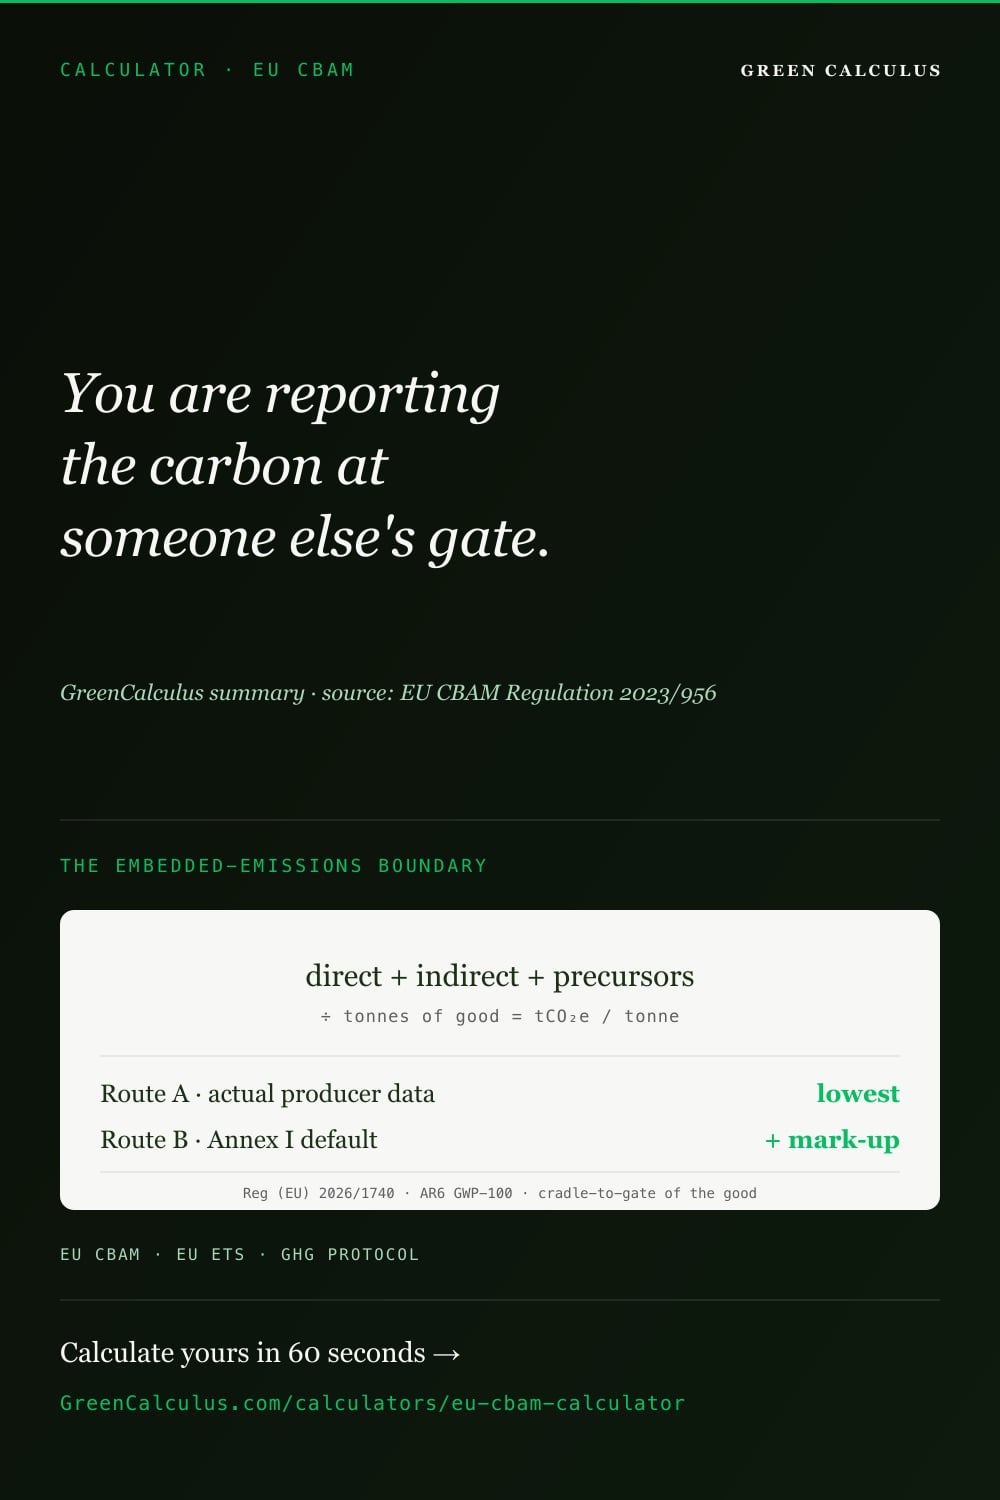
Embedded emissions are the emissions of the goods, not of your own operations. CBAM reports the emissions released in producing the imported good, at the production installation abroad — its direct process and combustion emissions, the indirect emissions of the electricity consumed, and the embedded emissions of any precursor inputs (such as the steel embedded in a steel product). This is cradle-to-gate of the good, measured in tonnes of CO2e per tonne of good. It is a different quantity from your company’s own Scope 1 and 2 inventory.
Built on the EU’s default values. CBAM allows two data routes: verified actual emissions from the overseas installation, or the EU’s published default values. This calculator uses the default values — Annex I of Implementing Regulation (EU) 2026/1740, per country of production and Combined Nomenclature (CN) code, for all 121 listed countries — and the Annex II grid factors for imported electricity. It does not yet take verified actual data. For the certificate count, defaults carry a mark-up that rises from 10 % in 2026 to 30 % from 2028, so a report built on defaults costs more than one built on verified data; the optional certificate estimate applies the right mark-up for the import year.
Factor basis. Default values are read live from the Master Brain, sourced from Commission Implementing Regulation (EU) 2025/2621 as corrected by (EU) 2026/1740, which replaced the Annex I direct and embedded defaults in full; the Annex II indirect grid factors are unchanged. Both are on an AR6 GWP-100 basis. CBAM default values are regulatory-reporting-tier figures for CBAM declarations only — they are not GHG-Protocol scope-aligned emission factors and should not be reused in a corporate Scope 1/2/3 inventory.
What the calculator does not encode. The submission deadlines, the precise scope of who must report, the de-minimis and exemption thresholds, penalty amounts, and the registry submission mechanics are set by the regulation and its guidance, change as the mechanism phases in, and are deliberately not fixed here. For those, consult the EU CBAM guidance and the CBAM standard reference directly — this tool computes the embedded-emissions numbers, not the procedural rules.
Annex I default values per EU CBAM Implementing Regulation (EU) 2026/1740 · AR6 GWP-100. Quantities in tonnes (or MWh for electricity).
Audit mode exposes per-line factor provenance.
Indicative only — not an official CBAM liability. Certificates per tonne = default total emissions plus that year’s default-value mark-up, minus the free allocation adjustment (CBAM benchmark × CBAM factor × cross-sectoral correction factor), per Implementing Regulations (EU) 2025/2620 and 2026/1740.
Commission price for Q1 2026 imports.
Add CBAM import lines above and click Calculate
Embedded-emissions total, direct/indirect split, by-sector and by-country breakdowns, audit trail, an optional certificate-cost estimate, and a declaration-shaped export appear after calculation.
Results are indicative, intended for EU CBAM embedded-emissions preparation, internal tracking, and decision support — not a substitute for the official CBAM declaration submitted via the EU CBAM Registry. Default values (Annex I/II of Implementing Regulation (EU) 2025/2621, as corrected by (EU) 2026/1740) carry conservative mark-ups and are intended for use where verified producer-specific data is unavailable; confirm classification (CN code), country of origin, and the applicable default value against the latest Implementing Regulation. CBAM emission factors are regulatory-reporting-tier values — do not sum them into a GHG Protocol Scope 1/2/3 inventory. Any certificate-cost figure is an indicative estimate only.
The optional certificate cost estimate used to apply the free allocation phase-in as a share of embedded emissions (2.5% in 2026). It now follows Commission Implementing Regulation (EU) 2025/2620: per tonne, the total default plus that year’s mark-up, minus the CBAM benchmark for the product and production route × the CBAM factor × the cross-sectoral correction factor. For 1,000 t of hot-rolled flat steel from China in 2026 that moves the estimate from 79.7 to 2,170 certificates. The calculator also now covers all 121 countries listed in Implementing Regulation (EU) 2026/1740. Embedded emissions results did not change. Details on our changelog.
The hard part of a CBAM report was never the arithmetic. It is that the number you must report belongs to a factory you do not own, in a country whose grid you did not choose, for a process you did not run.
You are accounting for someone else’s carbon — and if you cannot get their data, the regulation prices the gap for you. This tool covers the EU regime; the UK introduces its own CBAM from 2027.
CBAM reports state the embedded emissions of imported goods — the carbon released producing them abroad. Verified producer data is the preferred basis; the EU’s Annex I default values apply where it is missing. This calculator works on the default values, in tCO2e per tonne of good, and estimates the certificates they lead to.

What CBAM reporting is
The EU Carbon Border Adjustment Mechanism requires importers of certain carbon-intensive goods to report the greenhouse-gas emissions embedded in those goods. During the transitional phase the obligation was a quarterly report — no payment, but a disclosure of embedded emissions for each consignment of covered goods. The mechanism exists to put imported goods on the same carbon-cost footing as goods produced inside the EU under the EU Emissions Trading System, so that the EU’s carbon price is not undercut by production shifting to jurisdictions with weaker constraints.
Who reports, and what the report contains
The reporting obligation falls on the importer (or an indirect customs representative acting for them) bringing covered goods into the EU. For each quarter, the report states the quantity of each good imported, the country of production, and the embedded emissions of those goods — split into direct emissions from the production process and indirect emissions from the electricity consumed in production. Where the goods incorporate precursor materials that are themselves CBAM goods, the embedded emissions of those precursors carry through into the finished good. The exact submission window, the goods scope, and the thresholds are set by the regulation and its guidance and shift as the mechanism phases in.
Why a calculator helps before you file
The embedded-emissions figure is the part of the report that is genuinely hard to assemble: it depends on data from an overseas installation the importer does not control, and where that data is missing the importer must fall back on the EU’s default values — which differ by country and CN code and carry a mark-up. A calculation pass before filing lets the importer assemble the figures on the default values and see what they will cost. That is what this tool does: it computes the embedded emissions per line and, optionally, the certificates due once the mark-up and the free allocation adjustment are applied.
CBAM reports the carbon embedded in the imported good — not the importer’s own operational emissions. The figure is measured in tonnes of CO2e per tonne of good, at the production installation abroad, and combines that installation’s direct process emissions, the indirect emissions of its electricity, and the embedded emissions of any precursor inputs. It is a supply-chain disclosure about the good, distinct from a corporate Scope 1/2 inventory.
What “embedded emissions” means under CBAM
CBAM embedded emissions are a regulatory boundary, not the same as life-cycle embodied carbon. For cradle-to-gate embodied carbon under EN 15804, see the methodologies for steel and aluminium and concrete and cement.
Embedded emissions are the emissions released in producing a good, expressed per tonne of that good. Under CBAM the boundary is cradle-to-gate of the imported good at the production installation: the direct emissions of the production process, the indirect emissions of the electricity it consumes, and — carried in through precursors — the embedded emissions of any CBAM input materials. Understanding this boundary is the difference between reporting the right quantity and double-counting or under-counting it.
Direct versus indirect embedded emissions
Direct embedded emissions
The emissions from the production process itself — fuel combustion in furnaces and kilns, and process emissions such as the calcination of limestone in cement. Reported per tonne of good, these are the installation’s on-site emissions attributable to the good.
Indirect embedded emissions
The emissions of the electricity consumed in producing the good. Computed from the electricity used per tonne and the grid emission factor of the production country — the Annex II indirect factors in this calculator. Their treatment varies by goods group.
You are not reporting the carbon at your own gate.
You are reporting the carbon at someone else’s — the factory that made the good, on the grid that powered it.
Precursors — why a steel screw carries a steel mill’s carbon
Many CBAM goods are made from other CBAM goods. A finished steel product embeds the emissions of the crude steel it was formed from; a fastener embeds the emissions of its steel input. CBAM accounts for this by carrying the embedded emissions of precursor materials into the finished good, so the reported figure reflects the whole production chain up to the EU border, not just the final processing step. This is why the embedded emissions of a lightly processed good can be dominated by the carbon of its raw material rather than by the final conversion.
Specific values beat defaults, but only with verification. Where the overseas installation provides actual, verified emissions data, that is the preferred basis and almost always lower than the default. Where it does not, the EU default values apply — and they are set deliberately conservative, so that the absence of data is never the cheaper option. The reporting choice is therefore as much about data collection from suppliers as about calculation.
How this calculator works — imports to embedded emissions
You enter what you imported — the good, its CN code, the country of production, and the quantity. The calculator computes the embedded emissions per good and in total from the Annex I default values (Annex II for electricity), and can estimate the certificates due and their cost for the import year you choose.
Enter the consignment
For each line, give the good and its CN code, the country of production, and the tonnage imported in the quarter. The CN code and country select the right default value; the tonnage scales it.
Choose the data route
Pick the country where each good was made. The calculator applies that country’s Annex I default for the CN code, or the “other countries and territories” value where the country has none, as the regulation requires. Electricity uses the Annex II grid factor for the country.
Read the embedded total
The result gives direct and indirect embedded emissions per good and summed across the report. Open the certificate estimate to see the certificates due and their cost: each tonne’s default plus that year’s mark-up, minus the free allocation adjustment.
Embedded emissions per line = quantity (t) × emission factor (tCO2e/t of good).
Factor = the Annex I default for that country and CN code (Annex II for electricity).
Certificates per tonne = factor × (1 + mark-up) − CBAM benchmark × CBAM factor × correction factor.
Run the report on defaults first to get a complete figure fast: it tells you the worst-case embedded total and certificate cost. Then chase verified data from suppliers for the lines that drive the most certificates — the highest tonnage times factor — because that is where the default mark-up costs the most.
The six CBAM goods groups — and what each needs
CBAM covers six groups of carbon-intensive goods, identified by Combined Nomenclature (CN) code. The groups differ in whether indirect (electricity) emissions are reported alongside direct, and in how much of the embedded figure comes from precursors. The indicative default values below are read from the Master Brain on the Annex I basis as replaced by Reg (EU) 2026/1740; the value that applies to a given line depends on its exact CN code and country of production.
| Goods group | Example CN headings | Indirect reported? | Sample default (tCO2e/t) |
|---|---|---|---|
| Iron & steel | 72, 73 | Yes | Pig iron (CN 7201, China): 1.66 |
| Aluminium | 76 | Yes | Unwrought aluminium: 3.198 (per kg basis: see below) |
| Cement | 2523, 2507 | Yes | Grey clinker (India): 1.39; (Korea): 0.88 |
| Fertilisers | 28, 31 | Yes | Anhydrous ammonia: 4.36 (per kg basis) |
| Hydrogen | 2804 | Varies | Compressed hydrogen: 26.64 (per kg basis) |
| Electricity | 2716 | n/a | Per-country grid factor (Annex II), tCO2e/MWh |
Sample default values from the Master Brain (CBAM_DEFAULT_2026 — Annex I as replaced by Reg (EU) 2026/1740, AR6 GWP-100). Per-tonne figures (cbam.country.*) are stated in tCO2e per tonne of good; the aluminium, ammonia, and hydrogen figures shown are the materials-section per-kilogram defaults (materials.cbam.*) and convert to per-tonne by ×1,000. The applicable value depends on the exact CN code and production country; the calculator selects it from the entered line.
Country of production and the catch-all
Default values vary by country of production: the Master Brain holds per-country defaults for the major EU import partners — China, India, Türkiye, Russia, and South Korea — plus a catch-all “other” set used when the production country is not separately listed. An importer sourcing from a country without its own default row uses the catch-all value for that CN code. Selecting the wrong country, or defaulting to the catch-all when a specific country value exists, changes the reported figure, so the production country on each line matters as much as the CN code.
Selected Annex I default values, tCO2e per tonne of good, illustrating the spread across goods and countries. Bars are proportional to the largest value shown. Aluminium plotted at its per-tonne equivalent (3.198 kgCO₂e/kg × 1,000 = 3,198 kgCO₂e/t = 3.198 tCO₂e/t). Values from the Master Brain (Annex I as corrected by Reg (EU) 2026/1740); the value on any line depends on its CN code and production country.
Actual data versus default values — the data-quality choice
Every reported line rests on one of two bases: verified actual emissions data from the production installation, or the EU’s default value. The choice is not neutral — defaults are set conservatively and carry a mark-up that escalates over time, so a report built on defaults attributes more embedded emissions, and costs more in the definitive period, than one built on actual data.
Actual producer data
Verified emissions from the installation, determined on the CBAM monitoring rules. Preferred wherever available, usually lower than the default, and the only route that reflects a specific producer’s real performance. Requires the supplier to measure and share the data.
Annex I/II default values
The EU’s published per-country, per-CN-code defaults, used when actual data is missing. Always available, never require supplier cooperation — but conservative by design and carrying a mark-up, so they are the more expensive basis once the definitive period begins.
The default-value mark-up does not stop — it escalates. The Master Brain carries distinct mark-up tiers for 2026, 2027, and 2028 onwards, so the penalty for relying on default values grows year on year rather than holding flat or expiring. A reporting strategy that leans on defaults today becomes progressively more expensive as the mechanism matures. Treat the default route as a transitional fallback while you build supplier data collection, not as a permanent basis. (The mark-up is 10% in 2026, 20% in 2027 and 30% from 2028, or 1% for fertilisers, applied to the default when counting certificates under Implementing Regulation (EU) 2026/1740. The calculator’s certificate estimate applies the right tier for the import year.)
The data-quality choice is a procurement project, not a calculation setting. Lowering the reported figure — and the eventual cost — depends on getting verified emissions data out of overseas installations, which takes supplier engagement, monitoring alignment, and lead time. The calculator shows what the default route costs and which lines drive it; closing the gap happens in the supply chain, well before the report is due.
Inputs this calculator needs — and where to source them
The calculator needs the goods you imported, their CN codes and production countries, and quantities. It applies the default value for each line automatically. The table also lists the verified data your suppliers will need to provide if you move off defaults; the calculator does not take that data yet.
| Input | Required? | What it is | Primary source |
|---|---|---|---|
| Good and CN code | Required | The 8-digit Combined Nomenclature code identifying the imported good | Customs declaration / commercial invoice |
| Country of production | Required | Where the good was produced — selects the per-country default | Supplier / installation operator |
| Quantity imported | Required | Tonnage of the good imported in the quarter (MWh for electricity) | Customs / import records |
| Actual embedded emissions | Not used by this calculator yet | Verified direct and indirect emissions per tonne from the installation | Installation operator’s CBAM communication |
| Electricity consumed (indirect) | Not used by this calculator yet (the default value already includes indirect emissions where they are in scope) | Electricity per tonne of good, for the indirect component | Installation operator; grid factor from Annex II |
Build the supplier data request around the CBAM communication template the installation operator is expected to provide. The actual-data route needs direct emissions, electricity consumption, and — for goods made from precursors — the embedded emissions of those inputs, all per tonne of good. Requesting exactly those fields, early, is what lets you replace default lines with actual ones before the report is due. Your own Scope 1 and Scope 2 calculators do not feed this figure — CBAM emissions belong to the producer, not the importer.
The result components — direct, indirect, total and certificates
The calculator reports four things: direct embedded emissions, indirect embedded emissions, the total per good and across the report, and — if you open the estimate — the certificates due and their cost. Together they answer not just “how much embedded carbon” but “what it will cost, and which lines drive it.”
Direct embedded emissions
The process and combustion emissions of producing each good, per tonne and scaled by quantity. The core of the report — present for every goods group.
Indirect embedded emissions
The electricity-related emissions in the Annex I default, where indirect emissions are in scope (cement and fertilisers). For imported electricity, the country’s Annex II grid factor.
Embedded total
Direct plus indirect, per good and summed across all lines — the headline embedded figure for the quarter.
Certificates and cost (optional)
Per tonne: the default plus that year’s mark-up (10 % in 2026, 20 % in 2027, 30 % from 2028; 1 % for fertilisers), minus the CBAM benchmark × the CBAM factor × the correction factor (Implementing Regulation (EU) 2025/2620). Priced at the Commission’s published certificate price.
The total tells you what to report; the certificate estimate tells you what it costs and which lines to chase. Two goods with similar embedded emissions can need very different numbers of certificates, because the free allocation adjustment depends on each product’s benchmark. The per-line figures turn the abstract “get supplier data” into a number, so the data-collection effort can be prioritised by where it pays back the most.
Worked example — a steel importer’s CBAM report
This example is illustrative; the per-tonne factors are the Master Brain Annex I defaults and the line totals reconcile against them. A fabricator imports two steel lines from China in a quarter and runs the report on default values, having no verified producer data yet.
The consignment and the default-value report
| Line | CN / good | Country | Quantity (t) | Default factor (tCO2e/t) | Embedded (tCO2e) |
|---|---|---|---|---|---|
| 1 | 7201 — pig iron | China | 800 | 1.66 | 1,328 |
| 2 | 7202 60 00 — ferro-nickel | China | 150 | 6.15 | 922.5 |
| Quarter total (default basis) | 2,250.5 | ||||
Component one — the embedded total
On default values, the quarter’s two steel lines carry 2,250.5 tonnes of embedded CO2e — 1,328 from the pig iron and 922.5 from the ferro-nickel. Note that the ferro-nickel, at a fifth of the tonnage of the pig iron, contributes nearly as much embedded carbon, because its default factor is almost four times higher. The line that dominates the report is not the largest by weight but the largest by factor-times-tonnage.
Component two — the certificates
Imported in 2026, each tonne needs certificates for its default plus the 10 % mark-up, minus the free allocation adjustment (the CBAM benchmark × 97.5 %). Pig iron: 1.66 × 1.10 − 1.21 × 0.975 = 0.646 certificates a tonne, 517 for 800 tonnes. Ferro-nickel: 6.15 × 1.10 − 2.39 × 0.975 = 4.435 a tonne, 665 for 150 tonnes. The ferro-nickel line is where verified producer data would pay back most: it needs 56 % of the certificates on 16 % of the imported tonnage. If the fabricator can obtain verified data for one line this quarter, ferro-nickel is the one to chase.
Reading the result — tonnage is not the priority signal
The instinct is to chase data for the biggest line by weight. The report says otherwise. The ferro-nickel line, at 16% of the tonnage, drives 41% of the embedded total, so the marginal value of replacing its default with verified data is far higher per tonne than for the pig iron. The calculator surfaces this by showing embedded emissions and certificates per line, not just the total — making it obvious where supplier engagement converts into the largest reduction in both reported emissions and cost.
Prioritise data collection by embedded emissions, not by tonnage or invoice value. A small-volume, high-factor good can dominate a CBAM report, and it is exactly the line where a marked-up default costs the most. Running the report on defaults first, then reading the per-line embedded figures, points the supplier-data effort at the lines where it pays back — usually not the ones a procurement team would flag by spend.
Common reporting errors — what gets a report queried
The recurring CBAM reporting errors are not arithmetic — they are boundary and classification mistakes that misstate the embedded figure. The ones below most often force a correction or a query.
01 — Wrong CN code
The default value is keyed to the 8-digit CN code. A code that is close but wrong pulls a different default — sometimes from a different goods group — and misstates the embedded emissions. The CN code on the customs declaration is the anchor for the whole line.
02 — Wrong production country
Defaults vary by country, with a catch-all for unlisted ones. Reporting the country of dispatch or the supplier’s head office rather than the country of production pulls the wrong default. It is the installation’s location that matters.
03 — Omitting indirect emissions
For goods groups where indirect (electricity) emissions are reported, leaving them out understates the embedded figure. The indirect component uses the production country’s grid factor, not the importer’s own electricity.
04 — Missing precursor emissions
Reporting only the final processing step for a good made from CBAM precursors omits the carbon carried in from the input material — often the larger share. The embedded figure must include the precursors up the chain.
05 — Mixing actual and default inconsistently
Using actual data for the direct component but a default for indirect (or vice versa) without a clear basis produces a figure that reconciles to neither route. Each component should have a stated, consistent basis.
06 — Reusing the corporate inventory
Pulling figures from the importer’s own Scope 1/2 inventory rather than the producer’s embedded emissions reports the wrong entity’s carbon entirely. CBAM is about the good’s production abroad, not the importer’s operations.
CBAM and the wider compliance stack — EU ETS and the definitive period
CBAM does not stand alone — it is the import-side mirror of the EU Emissions Trading System. The ETS prices the carbon of goods produced inside the EU; CBAM is designed to apply an equivalent cost to imported goods, so that the carbon price is not avoided by producing outside the bloc. During the transitional phase the obligation is disclosure only. In the definitive period, importers will surrender CBAM certificates corresponding to the embedded emissions of their imports, priced against the ETS allowance price, with an adjustment for any carbon price already paid in the country of production and for the free allocation still held by EU producers.
| Aspect | EU ETS (EU production) | CBAM (imports) |
|---|---|---|
| What it covers | Emissions of installations inside the EU | Embedded emissions of covered goods imported into the EU |
| The carbon price | ETS allowance price (auction/market) | CBAM certificate price, referenced to the ETS price |
| Transitional phase | Established system | Quarterly embedded-emissions reporting, no payment |
| Definitive period | Free allocation phasing down | Certificate surrender begins; free-allocation phase-down mirrored |
| Foreign carbon price | n/a | Deductible where already paid in the production country |
The link to the ETS is also why the embedded-emissions figure matters well before any payment is due: it is the quantity the future certificate liability is built on. A report assembled now on conservative default values previews a higher definitive-period cost than one built on verified actual data — so the transitional-phase reporting is, in effect, a rehearsal for the cost that follows. The free-allocation phase-down schedule that governs how EU producers’ free allowances taper is mirrored in how the CBAM obligation ramps, tying the two mechanisms together over the same timeline.
Treat transitional-phase reporting as definitive-period preparation. The embedded-emissions figure is disclosure-only now but becomes the basis of a financial liability later, priced against the ETS. The importers who fare best in the definitive period are the ones who used the reporting phase to build verified supplier data and replace conservative defaults — lowering both the reported figure and the eventual certificate cost before it became payable.
Reporting context — declarants, the registry, and the timeline
The obligation sits with the importer of record — the declarant — or an indirect customs representative acting on their behalf. Reports are filed through the EU’s CBAM registry, the central system through which declarants submit embedded-emissions data each quarter and, in the definitive period, manage certificates. The registry, the submission windows, the goods scope, and the thresholds are defined by the regulation and its implementing acts and continue to be refined as the mechanism phases in.
Because the precise procedural rules — deadlines, exemptions, de-minimis thresholds, and penalties — are set by the regulation and change as it matures, this page does not assert specific dates or figures for them; consult the EU CBAM guidance and the CBAM standard reference for the current procedural detail. What is stable, and what this calculator addresses, is the embedded-emissions methodology: the cradle-to-gate boundary, the direct/indirect split, the precursor carry-through, and the actual-versus-default data choice. Those are the parts of the report that demand calculation rather than lookup.
Separate the calculable from the procedural and tackle them on different tracks. The embedded-emissions figures — what this tool computes — can be assembled and refined continuously as supplier data arrives. The procedural requirements — registration, submission windows, representative arrangements — are lookups against current guidance that change less often per line but more often per cycle. Keeping the two workstreams distinct stops a deadline question from blocking the data work, and vice versa.
Data sources, default-value basis, and update transparency
Default values from the implementing regulation
The Annex I direct and embedded default values, and the Annex II indirect grid factors, are read live from the Master Brain, sourced from Commission Implementing Regulation (EU) 2025/2621 of 16 December 2025, which implements Regulation (EU) 2023/956 (the CBAM Regulation). The Annex I values are those substituted by Commission Implementing Regulation (EU) 2026/1740, which replaced Annexes I and IV in full — adopted 20 July 2026, in force 3 August 2026, and applying retroactively from 1 January 2026; the Annex II indirect factors are unchanged by the correcting act. The defaults are held per country of production and per CN code, at 10-digit TARIC level where the corrected annex distinguishes goods at that level, on an AR6 GWP-100 basis. The calculator selects the applicable value from the CN code and country entered on each line.
CBAM values are reporting-tier, not inventory factors
The CBAM default values carry a regulatory-reporting classification — they sit outside the GHG-Protocol scope framework and are intended for CBAM declarations only. They should not be reused as emission factors in a corporate Scope 1, 2, or 3 inventory; the boundaries, the GWP treatment, and the purpose differ. This calculator uses them solely to build the CBAM embedded-emissions figure.
The default mark-up escalates
The default values carry a mark-up that rises across successive tiers — 2026, 2027, and 2028 onwards — so the cost of relying on defaults grows over time rather than holding flat. Implementing Regulation (EU) 2026/1740 sets the mark-up at 10% for 2026, 20% for 2027 and 30% from 2028 (1% for fertilisers), applied to the total default when the number of certificates is calculated. The certificate estimate applies the tier for the import year you choose.
Versioning
Default values are read from the Master Brain (v2025.57), which stamps each result with the dataset version, so reports produced under different vintages are distinguishable. The CBAM regulation and its annexes are themselves revised by the Commission; a new implementing act may change the default values, the goods scope, or the mark-up schedule this calculator reads. Re-run reports against the current dataset and confirm the goods scope against the current regulation.
Frequently asked questions
For each quarter, the report states the quantity of each covered good imported, its CN code, the country of production, and the good’s embedded emissions — split into direct emissions from the production process and indirect emissions from the electricity consumed in production. Where a good is made from CBAM precursor materials, the embedded emissions of those precursors carry through. During the transitional phase it is a disclosure only; no payment is due. The precise submission window is set by the regulation and changes as the mechanism phases in.
Embedded emissions are the greenhouse-gas emissions released in producing a good, expressed per tonne of that good. Under CBAM the boundary is cradle-to-gate at the production installation: the direct process and combustion emissions, the indirect emissions of the electricity consumed, and the embedded emissions of any CBAM precursor inputs. It is the carbon of the good’s production abroad — a different quantity from the importer’s own Scope 1 and 2 operational emissions.
CBAM covers six groups of carbon-intensive goods, identified by Combined Nomenclature code: iron and steel, aluminium, cement, fertilisers, hydrogen, and electricity. Each group is defined by a set of CN codes, and the exact scope — which specific codes are in and out — is set by the regulation and refined as the mechanism develops. This calculator computes embedded emissions for all six groups, selecting the default value from the CN code and production country on each line.
Actual data is the verified emissions of the specific production installation, determined on the CBAM monitoring rules and supplied by the producer — the preferred basis, and usually lower. Default values are the EU’s published per-country, per-CN-code figures, used when actual data is unavailable. Defaults are always accessible but set conservatively and carry a mark-up that escalates over time, so a report built on defaults attributes more embedded emissions, and costs more in the definitive period, than one built on actual data.
The default values are the EU’s Annex I direct and embedded defaults and Annex II indirect grid factors, published in Commission Implementing Regulation (EU) 2025/2621, which implements the CBAM Regulation (EU) 2023/956 — with Annex I as replaced in full by Commission Implementing Regulation (EU) 2026/1740, applying retroactively from 1 January 2026. This calculator reads them live from the Master Brain on an AR6 GWP-100 basis, held per country of production and per CN code. They are regulatory-reporting-tier values for CBAM declarations only and should not be reused as factors in a corporate GHG inventory.
No — it escalates. The default values carry a mark-up that rises across successive tiers, with distinct levels for 2026, 2027, and 2028 onwards, so the penalty for relying on defaults grows year on year rather than holding flat or expiring. This is by design: it pushes importers toward obtaining verified actual data over time. The current calculator surfaces the 2026 and 2027 tiers, with the later tier scheduled for a future update.
No. The CBAM report is submitted through the EU’s CBAM registry. This tool computes the embedded-emissions figures the report turns on — direct, indirect and totals on the default values — and estimates the certificates and their cost, so you can assemble, check, and cost them before filing. It does not submit on your behalf and does not encode the procedural rules such as deadlines, exemptions, or registration; for those, consult the EU CBAM guidance and the CBAM standard reference.
CBAM is the import-side counterpart of the EU Emissions Trading System. The ETS prices the carbon of goods produced inside the EU; CBAM is designed to apply an equivalent cost to imported goods so the carbon price is not avoided by producing outside the bloc. In the definitive period, importers surrender CBAM certificates for the embedded emissions of their imports, priced against the ETS allowance price, with deductions for any carbon price already paid abroad and for EU producers’ remaining free allocation as it phases down.
Yes, where the good is made from CBAM precursor materials. CBAM carries the embedded emissions of precursor inputs into the finished good, so the reported figure reflects the whole production chain up to the EU border, not just the final processing step. For a lightly processed good, the precursor carbon — for example the crude steel embedded in a steel product — can be the larger share of the embedded total, so omitting it materially understates the report.
They overlap but are not the same and should not be substituted for each other. CBAM embedded emissions are a regulatory-reporting quantity for specific imported goods, with their own boundary, default values, and GWP treatment, classified outside the GHG-Protocol scope framework. A corporate Scope 3 Category 1 (purchased goods) figure covers a different population on different rules. The imported goods may appear in both, but the numbers are computed differently — use the CBAM figure for the CBAM report and the inventory figure for the corporate inventory.
Methodology notes and limitations
Embedded-emissions builder, not the submission. The calculator computes the embedded-emissions figures for a CBAM report — direct, indirect and totals — and an optional certificate and cost estimate. It does not submit the report, which is filed through the EU CBAM registry, and does not encode the procedural rules.
Default values from the implementing regulation. The Annex I direct and embedded defaults and Annex II indirect grid factors are read from the Master Brain, sourced from Commission Implementing Regulation (EU) 2025/2621 (implementing Regulation (EU) 2023/956), with Annex I as replaced by Commission Implementing Regulation (EU) 2026/1740, per country and per CN code, on an AR6 GWP-100 basis.
CBAM values are reporting-tier. The default values sit outside the GHG-Protocol scope framework and are for CBAM declarations only. They are not interchangeable with corporate Scope 1/2/3 emission factors and should not be reused in a GHG inventory.
Default values only, for now. Verified producer data, determined on the CBAM monitoring rules, takes precedence over defaults in a real declaration and is usually lower. This calculator does not yet accept it, so its figures are the default-value case: the upper end of what a line will cost.
The default mark-up escalates. The default-value mark-up rises across the 2026, 2027, and 2028-onwards tiers rather than holding flat. The certificate estimate applies the 10%, 20% and 30% tiers (1% for fertilisers) by import year. Treat default reliance as a transitional fallback.
Procedural rules are not asserted here. Submission deadlines, the precise goods scope, de-minimis and exemption thresholds, penalty amounts, and registry mechanics are set by the regulation and change as the mechanism phases in. This page does not state specific dates or figures for them; consult the EU CBAM guidance and the CBAM standard reference for current detail.
Worked example is illustrative. The steel-importer example uses real Master Brain Annex I default factors and the line totals reconcile against them, but the consignment is constructed for illustration. The definitive-period cost implications are described qualitatively; no CBAM certificate or ETS allowance price is asserted.
The dataset and the regulation both change. The Master Brain default values are versioned, and the CBAM regulation and its annexes are periodically revised by the Commission. A new implementing act may change the defaults, the goods scope, or the mark-up schedule. Re-run reports against the current dataset and confirm scope against the current regulation. The full methodological treatment is on the paired EU CBAM methodology page.