
GHG Protocol Corporate Standard — The Definitive Reference

The GHG Protocol Corporate Accounting and Reporting Standard is the operative methodology behind the majority of corporate greenhouse gas inventories worldwide and the implicit benchmark against which third-party verifiers, CDP scorers, CSRD auditors, and SBTi validators assess the credibility of disclosed emissions data.
If your inventory were audited tomorrow, this is the standard it would be tested against.
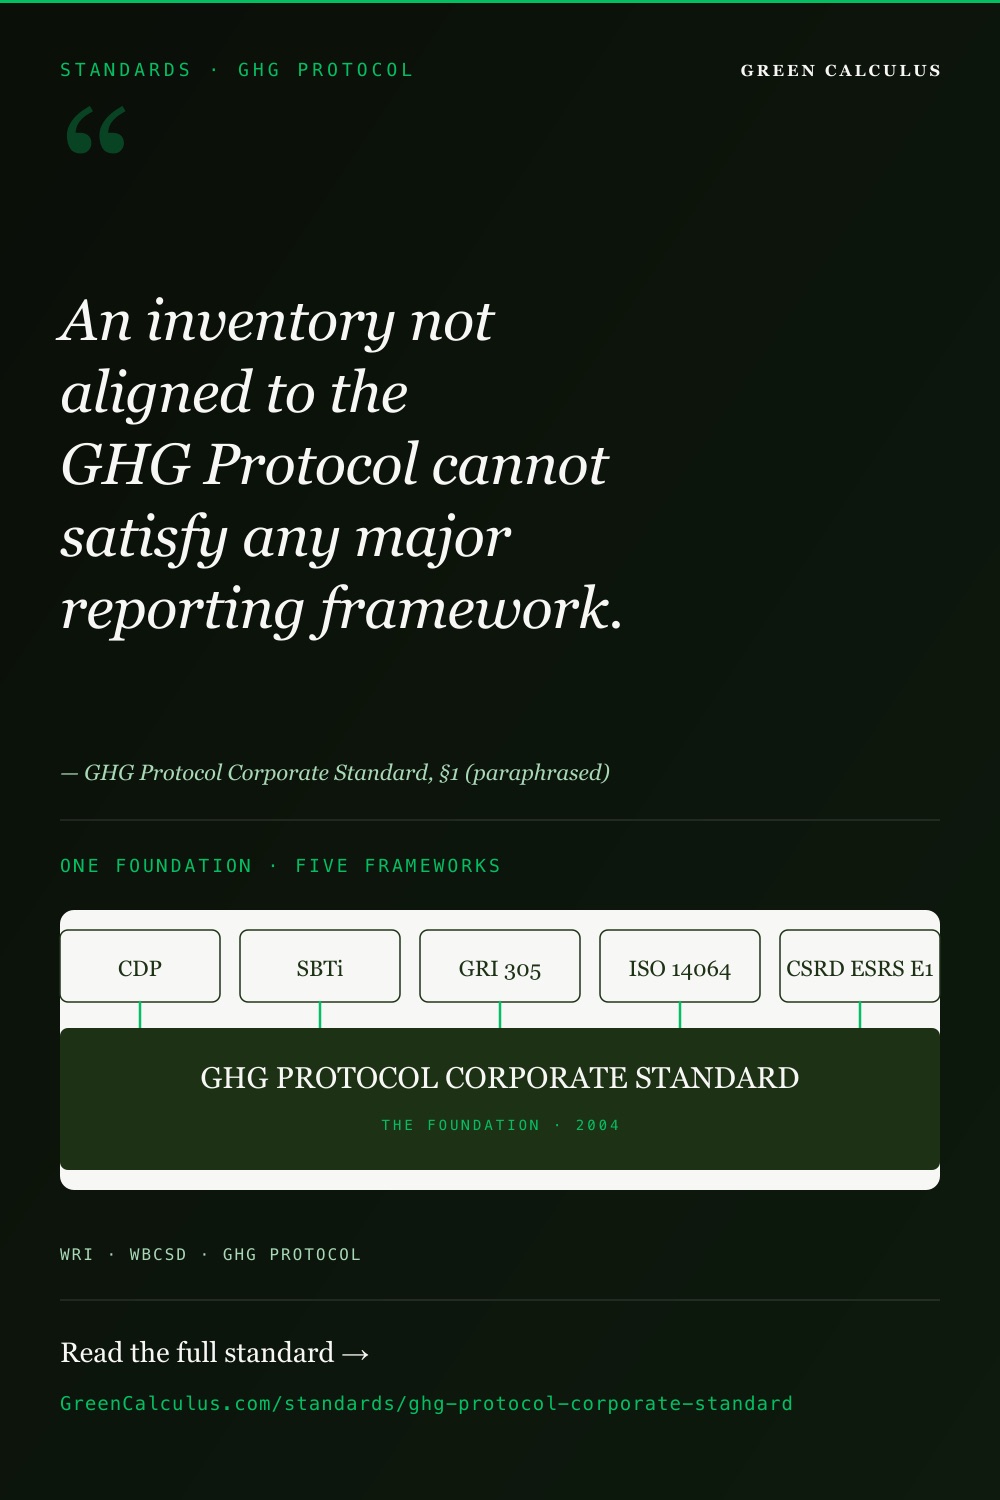
Executive summary. The GHG Protocol Corporate Standard (WRI / WBCSD, 2001; revised edition, 2004) governs the construction, classification, and disclosure of organisational GHG inventories across Scope 1 (direct), Scope 2 (purchased energy), and Scope 3 (value chain) emissions. It establishes five reporting principles — relevance, completeness, consistency, transparency, accuracy — that operate as audit criteria, not aspirations. Compliance requires explicit boundary selection, gas-level disaggregation, dual Scope 2 reporting where contractual instruments exist, base-year recalculation under defined structural change, and disclosure of the IPCC GWP basis applied. Properly executed, an inventory built to the Corporate Standard satisfies the methodological requirements of CDP, GRI 305, ISO 14064-1, and CSRD ESRS E1.
This page is for: sustainability managers, ESG controllers, climate accountants, internal audit, and external assurance providers preparing or reviewing inventories that must withstand independent verification.
This page is not for: a basic introduction to corporate carbon footprints. For an entry-level overview, see carbon footprint.
1. Standard Overview & Historical Context
The GHG Protocol Corporate Accounting and Reporting Standard was developed jointly by the World Resources Institute (WRI) and the World Business Council for Sustainable Development (WBCSD), first published in 2001 and revised in 2004. The 2004 revised edition remains the operative version. No subsequent full revision has superseded it; the supplementary GHG Protocol Scope 2 Guidance (2015), the Corporate Value Chain (Scope 3) Standard (2011), and the Land Sector and Removals Standard (2024) extend — rather than replace — the Corporate Standard’s foundational architecture.
The Standard requires that organisational GHG inventories satisfy five principles: relevance, completeness, consistency, transparency, and accuracy. These are not best-practice suggestions. They function operationally as audit criteria against which third-party verifiers and assurance providers test methodological adequacy. Failure on any one principle — for example, omitting a material Scope 3 category without justification (completeness), or reporting a single CO2e total without gas disaggregation (transparency) — constitutes a methodological deficiency, not a stylistic preference.
Why It Became the Global Default
The Corporate Standard achieved universal adoption through two reinforcing mechanisms. First, it was the earliest publicly available, methodologically rigorous framework for corporate GHG accounting; first-mover advantage cemented its position before competing standards matured. Second, downstream frameworks — CDP, the UN Global Compact, the Science Based Targets initiative (SBTi), GRI 305, and most recently the EU’s CSRD ESRS E1 — built their reporting requirements on top of the Corporate Standard rather than alongside it. The result is a self-reinforcing compliance ecosystem: an organisation that does not produce a GHG Protocol-aligned inventory cannot, in practice, satisfy the disclosure obligations of any major reporting framework.
Scope of This Page
This reference covers the Corporate Standard exclusively. It does not address the methodology of the Scope 3 Standard in detail (see Scope 3 Standard), the Project Protocol, or the Land Sector and Removals Standard (see Land Sector Standard). Where Scope 3 categories are referenced below, the treatment focuses on classification and boundary placement under the Corporate Standard rather than the calculation methodologies in the Scope 3 Standard itself.
Provider directory
Now it has to hold up all year.
See who does this work — chosen by us, never paid placement, with the standards each one works to. Including Small World Consulting and Anthesis Group.
Browse 4 carbon accounting & inventory providers →Do this work? A listing is $390 a year. Get listed →
2. The GHG Protocol Standards Hierarchy
The Corporate Standard sits at the apex of a layered standards architecture. Each subsequent document presupposes alignment with the foundational Standard.
| Layer | Standard | Year | Function | Relationship |
|---|---|---|---|---|
| Foundation | Corporate Standard | 2004 (rev.) | Core inventory architecture: principles, boundaries, scopes, calculation framework | Operative for all Scope 1 & 2; identifies but does not detail Scope 3 |
| Extension | Scope 2 Guidance | 2015 | Mandates dual reporting (location-based and market-based) where contractual instruments exist | Supplements Corporate Standard; does not replace it |
| Extension | Corporate Value Chain (Scope 3) Standard | 2011 | Defines 15 Scope 3 categories and detailed quantification methodology | Builds on Corporate Standard’s identification of Scope 3 |
| Extension | Land Sector and Removals Standard | 2024 | Land use, land-use change, biogenic carbon flows, and CO2 removals | Sectoral overlay on Scopes 1 and 3 |
| Application | Product Standard | 2011 | Product-level life-cycle GHG accounting | Distinct unit of analysis; methodologically aligned |
| Application | Project Protocol | 2005 | Project-level emission reductions and removals | Distinct accounting boundary; outside corporate inventory |
Begin with the Corporate Standard. Add the Scope 2 Guidance for any organisation purchasing electricity. Add the Scope 3 Standard for any inventory disclosing value-chain emissions. Add the Land Sector Standard only for entities with material land use, agriculture, forestry, or biogenic carbon flows. The Product Standard and Project Protocol are distinct accounting units and should not be conflated with corporate inventory work.
3. Organisational Boundaries
Boundary definition is where most inventories fail and where most audits concentrate scrutiny. The Corporate Standard offers three approaches; selecting the wrong one — or applying the correct one inconsistently across the inventory — is the single most common cause of material misstatement in corporate GHG reporting.
3.1 The Three Boundary Approaches
| Approach | Definition | Typical Application | Principal Audit Risk |
|---|---|---|---|
| Equity Share | Emissions reported in proportion to the reporting entity’s equity ownership in the operation | Investment-heavy portfolios; financial sector reporting; complex joint-venture structures | Minority stakes misclassified; joint-venture shares understated; shifts in equity not reflected in inventory |
| Financial Control | 100% of emissions reported where the reporting entity has the ability to direct the financial and operating policies of the operation with a view to gaining economic benefit | Finance-led reporting; entities with significant financial influence but limited day-to-day operational involvement | Joint-venture exposure missed; leased-asset boundary ambiguous; passes accounting test but fails practical control test |
| Operational Control | 100% of emissions reported where the reporting entity has the full authority to introduce and implement operating policies at the operation | The default for most corporate applications — manufacturing, retail, logistics, real estate, professional services | Leased assets incorrectly excluded; outsourced operations omitted; ownership confused with control |
3.2 Decision Logic
The correct approach is determined by operational structure, not editorial preference. Apply this sequence and document the determination:
- Operational control test. Does the reporting entity have the authority to introduce and implement operating policies at the facility or operation? If yes, include 100% of emissions under the operational control approach.
- Financial control test. If operational control is absent: does the reporting entity have the ability to direct the financial and operating policies of the operation with a view to gaining economic benefit? If yes, include 100% under financial control.
- Equity share fallback. Where neither control test is met: include emissions in proportion to ownership percentage.
- Consistency rule. Once an approach is selected, it must be applied to all operations within the inventory boundary. Mixed-method reporting within a single inventory is non-compliant and will fail verification.
3.3 Boundary Scenarios
Leased Office Building
Under operational control, the tenant who controls HVAC operation reports the associated Scope 1 (gas boilers) and Scope 2 (purchased electricity) emissions — ownership of the building is irrelevant. If the landlord controls HVAC, those emissions fall outside the tenant’s Scope 1/2 boundary and are captured as Scope 3 Category 8 (Upstream Leased Assets). Among the most frequently misclassified boundaries in commercial real estate.
50/50 JV, Single Operator
The operating partner includes 100% of JV emissions under operational control. The non-operating partner excludes them from Scope 1/2 and may include the proportional share as Scope 3 Category 15 (Investments). Both parties must explicitly disclose their boundary treatment to prevent verification challenge.
Third-Party Logistics
The 3PL provider has operational control over fleet and facilities; the contracting company does not. Outsourced logistics emissions are Scope 3 Category 4 (Upstream Transportation and Distribution) for the contracting company — not Scope 1. Misclassification as Scope 1 is a recurring error in FMCG and retail inventories.
Data Centre Tenant
The colocation operator controls HVAC, power infrastructure, and cooling. The tenant does not have operational control over facility emissions. Electricity used by tenant equipment is Scope 2 (location- and market-based as applicable); facility overhead emissions sit outside the tenant’s Scope 1/2 boundary under the operational control approach.
GreenCalculus calculators apply operational control as the default boundary approach. Users reporting under equity share or financial control should adjust inputs accordingly — see boundary-adjustment guidance within each calculator’s methodology panel. Related: operational control — glossary · equity share · financial control.
4. Scope Classification
4.1 Scope 1 — Direct Emissions
Scope 1 covers GHG emissions from sources owned or controlled by the reporting organisation. The Corporate Standard divides Scope 1 into four operational source categories:
- Stationary combustion — boilers, furnaces, turbines, and on-site generators burning fossil or biomass fuels
- Mobile combustion — company-owned or operationally controlled road vehicles, aircraft, vessels, and rolling stock
- Process emissions — chemical or physical industrial processes not involving combustion (cement clinker calcination, primary aluminium smelting, ammonia synthesis, refrigerant production)
- Fugitive emissions — intentional or unintentional releases: refrigerant leaks from HVAC and refrigeration; methane from coal mining and natural gas distribution; SF6 from electrical switchgear; HFCs from foam blowing
Biogenic CO2 treatment. CO2 from combustion of biomass (wood, biogas, biofuel, biogenic municipal waste) is excluded from the Scope 1 total but must be reported separately as a memo item. Failing to disclose biogenic CO2 as a supplementary figure is a Corporate Standard compliance failure, not an editorial choice. The non-CO2 biogenic emissions (CH4, N2O) remain in Scope 1.
Refrigerant fugitives. Fugitive emissions from HVAC and refrigeration systems are Scope 1. They are routinely missed because they require equipment-level records, annual leak detection logs, and refrigerant-specific GWP application — not utility meter readings. In commercial real estate and food retail, refrigerant fugitives commonly represent 15–40% of total Scope 1 emissions and are a focal point of verification scrutiny.
→ Scope 1 Stationary Combustion Calculator · Refrigerant Fugitive Emissions Calculator · Scope 1 methodology
4.2 Scope 2 — Indirect Energy Emissions
Scope 2 covers emissions from the generation of purchased electricity, steam, heat, or cooling consumed by the reporting organisation. The 2015 Scope 2 Guidance mandates dual reporting wherever contractual instruments exist.
| Method | Emission Factor Basis | When Required |
|---|---|---|
| Location-based | Average grid emission factor for the geography in which consumption occurs (e.g. EPA eGRID for the US, IEA national factors, AIB residual mix for Europe, AEMO for Australia) | Always required, regardless of contractual instruments held. The location-based figure is the unconditional disclosure. |
| Market-based | Emission factor derived from contractual instruments: Renewable Energy Certificates (RECs), Guarantees of Origin (GOs), International REC Standard (I-REC), Power Purchase Agreements (PPAs), supplier-specific rates, residual mix factors | Required where contractual instruments exist. Both methods must then be reported in parallel. |
Critical decision point. A company holding RECs, GOs, or a PPA must report both location-based and market-based figures. Reporting only the market-based zero-emission figure without the corresponding location-based disclosure is non-compliant with the 2015 Scope 2 Guidance and is increasingly flagged by CDP scorers and CSRD assurance providers. The location-based disclosure ensures market-based zero claims do not obscure underlying grid-driven emissions.
Quality criteria for market-based instruments. The Scope 2 Guidance specifies eight quality criteria that contractual instruments must meet to qualify for market-based reporting: attribute conveyance, exclusivity (no double-counting), tracking and redemption, vintage proximity to the reporting period, geographic relevance to the consumption market, and explicit retirement or cancellation in the consumer’s name. Instruments failing these criteria default to location-based treatment.
→ Scope 2 Electricity Emissions Calculator · Market vs Location Methods · IEA Grid Emission Factors
4.3 Scope 3 — Value Chain Emissions
Scope 3 covers all indirect emissions not captured in Scope 2 — spanning upstream and downstream activities across the value chain. The Corporate Standard does not classify Scope 3 reporting as optional in the colloquial sense: organisations are required to identify all relevant categories, account for material categories, and explicitly justify any exclusions. An inventory that excludes Scope 3 without documented rationale is incomplete by the Corporate Standard’s own definition (the completeness principle).
Detailed quantification methodology resides in the separate Corporate Value Chain (Scope 3) Standard (2011). The classification table in Section 5 is authoritative under the Corporate Standard; calculation methodologies fall to the Scope 3 Standard.
5. Scope 3 Category Reference
| # | Category | Direction | Typical Sources | Materiality Indicators |
|---|---|---|---|---|
| 1 | Purchased Goods & Services | Upstream | Raw materials, components, packaging, professional services | High for manufacturers, retailers, and product companies. Frequently the largest single Scope 3 category. |
| 2 | Capital Goods | Upstream | Machinery, buildings, vehicles, IT infrastructure | High for capital-intensive sectors: construction, heavy manufacturing, hyperscale data centres. |
| 3 | Fuel- & Energy-Related Activities | Upstream | Well-to-tank emissions of fuels and electricity consumed in Scope 1 and Scope 2 | Applies universally. Routinely overlooked. Captures upstream supply-chain emissions of energy already counted at point-of-consumption. |
| 4 | Upstream Transportation & Distribution | Upstream | Third-party logistics, freight, shipping of purchased goods (paid by reporting entity) | High for complex supply chains and outsourced logistics models. |
| 5 | Waste Generated in Operations | Upstream | Disposal and treatment of solid waste and wastewater from operations | Moderate for most organisations; high for food processing, chemical manufacturing, and construction. |
| 6 | Business Travel | Upstream | Flights, rail, hotel stays, rental cars — employee travel not in Scope 1 | High for professional services, consulting, finance. Material for any global operation. |
| 7 | Employee Commuting | Upstream | Travel between home and regular workplace, including teleworking energy where included | Moderate. Increases with headcount and car-dependent commute patterns. |
| 8 | Upstream Leased Assets | Upstream | Operation of assets leased by the company but operationally controlled by the lessor | Applies where the company leases assets it does not operationally control. Verify boundary classification first. |
| 9 | Downstream Transportation & Distribution | Downstream | Transport of sold products from company to end customer (paid by customer) | High for manufacturers selling physical goods. Requires customer logistics data. |
| 10 | Processing of Sold Products | Downstream | Further processing by intermediate customers prior to final use | Material for sellers of intermediate goods: chemicals, primary metals, components. |
| 11 | Use of Sold Products | Downstream | Direct use-phase emissions from products that consume energy or emit GHGs in operation | Dominant category for automotive, consumer appliances, electronics, and fuel companies. |
| 12 | End-of-Life Treatment of Sold Products | Downstream | Disposal, recycling, landfill, incineration of products at end-of-life | High for packaging-intensive industries, electronics, and single-use goods. |
| 13 | Downstream Leased Assets | Downstream | Operation of assets owned by the company but leased to others | Material for real estate, equipment leasing, and vehicle fleet leasing. |
| 14 | Franchises | Downstream | Scope 1 and Scope 2 emissions of franchisee operations | Applies to franchisors: quick-service restaurants, retail, hospitality. A frequent omission. |
| 15 | Investments | Downstream | Equity investments, project finance, debt — financed emissions | Critical for the financial sector; PCAF methodology applies. Increasingly material under CSRD ESRS E1. |
Sector application note. The Scope 3 Standard requires materiality assessment across all 15 categories. The categories most likely to be material differ sharply by sector. Scope 3 Standard — sector materiality matrix documents typical materiality patterns for nine major sectors.
6. GWP Values & Gas Disaggregation
6.1 GWP Reference Table — IPCC AR6 (100-year)
| Gas | Formula | AR6 GWP-100 | AR5 GWP-100 | AR6 vs AR5 | Common Source |
|---|---|---|---|---|---|
| Carbon dioxide | CO2 | 1 | 1 | — | Fossil combustion, industrial processes |
| Methane (fossil) | CH4 | 29.8 | 28 | +6.4% | Natural gas combustion, oil & gas fugitives, coal mining |
| Methane (biogenic)† | CH4 | 27.9 | 28 | −0.4% | Landfill, livestock enteric fermentation, rice cultivation, anaerobic wastewater |
| Nitrous oxide | N2O | 273 | 265 | +3.0% | Agricultural soils, combustion, wastewater treatment |
| HFC-134a | CH2FCF3 | 1,526 | 1,430 | +6.7% | Mobile AC, light commercial refrigeration |
| HFC-32 | CH2F2 | 771 | 677 | +13.9% | Lower-GWP AC refrigerant |
| HFC-410A (blend) | HFC blend | 2,088 | 2,088 | — | Building AC systems |
| HFC-404A (blend) | HFC blend | 3,922 | 3,922 | — | Supermarket refrigeration (in phase-out) |
| HFC range (full)‡ | HFCs | 148–14,600 | 4–12,400 | — | Refrigerants, aerosols, foam blowing |
| PFC (range, e.g. CF4) | PFCs | 7,380–12,400 | 6,630–11,100 | +11.3% (CF4) | Primary aluminium smelting, semiconductor manufacturing |
| Sulphur hexafluoride | SF6 | 25,200 | 23,500 | +7.2% | Electrical switchgear, magnesium processing |
| Nitrogen trifluoride | NF3 | 17,400 | 16,100 | +8.1% | Semiconductor manufacturing, photovoltaic production |
† AR6 publishes distinct GWP-100 values for fossil CH4 (29.8) and biogenic CH4 (27.9) for the first time; AR5 (Table 8.7) published a single GWP-100 of 28 for both source types. Apply 29.8 to all combustion and fossil-fuel fugitive emissions. Apply 27.9 only to confirmed biogenic sources (landfill gas, livestock, rice cultivation, anaerobic digestion) where biological origin is documented. Source: IPCC AR6 WGI Table 7.SM.7. See Land Sector and Removals Standard for biogenic methane treatment in agricultural inventories.
‡ The HFC range covers the full AR6 spectrum across all reported HFC compounds. GreenCalculus implements the four most common refrigerant HFCs in corporate inventories (HFC-134a, HFC-32, HFC-404A, HFC-410A) plus less common compounds where activity data warrants. See the complete AR6 GWP dataset for all reported gases including HFOs.
6.2 The AR5 → AR6 Transition
The IPCC Fifth Assessment Report (AR5, 2013) was the operative basis for corporate inventories from approximately 2014 through 2021. AR6 (2021) updates GWP values across most gases. The most consequential shifts for corporate inventories:
- N2O: 265 → 273 (+3.0%). Material for agricultural sectors, wastewater operators, and fertiliser-intensive supply chains.
- SF6: 23,500 → 25,200 (+7.2%). Material for utilities and electrical equipment manufacturers.
- Fossil CH4: 28 → 29.8 (+6.4%). Material for oil & gas, coal, and natural gas distribution.
- HFC-32: 677 → 771 (+13.9%). Material for HVAC and lower-GWP refrigerant transitions.
- Fossil/biogenic CH4 separation: AR6 introduces distinct values where AR5 published a single value — reducing the apparent climate impact of confirmed biogenic methane while raising the impact of fossil methane.
The GHG Protocol recommends AR6 for all new inventories and base-year recalculations. Organisations still applying AR5 should disclose the rationale and plan a transition. Under CSRD ESRS E1, AR6 alignment is the implicit expectation, although ESRS does not formally mandate a single AR version.
6.3 Gas Disaggregation Requirement
The GHG Protocol requires that individual gases be reported separately — not aggregated into a single CO2e total. An inventory that discloses only an aggregated CO2e figure without gas-level disaggregation does not satisfy the Corporate Standard’s transparency principle and will not pass third-party verification under any major assurance framework.
At minimum, inventories must disclose CO2, CH4, N2O, and the F-gas groups (HFCs, PFCs, SF6, NF3) where applicable to the organisation’s activities. Sector-specific high-impact gases require compound-level disclosure: HFO refrigerants in food retail and automotive AC; specific PFCs in semiconductor fabrication; specific HFCs in the air conditioning industry.
All GreenCalculus calculators apply IPCC AR6 GWP-100 values by default. Where activity data supports it, calculator outputs include gas-level disaggregation aligned with the disclosure requirement. Reference: IPCC AR6 GWP — full reference table · AR6 dataset (machine-readable).
7. Emissions Calculation Logic
7.1 The Core Formula
Activity data is the quantitative measure of an activity that drives emissions: litres of fuel consumed, kWh of electricity purchased, kilometres driven, tonnes of waste disposed, kilograms of refrigerant charged. Activity data must be measured, metered, or calculated from primary records. Estimated values are permitted only with explicit disclosure of the estimation methodology and rationale — estimation without disclosure fails the transparency principle.
Emission factor is the mass of GHG released per unit of activity. Factors vary by fuel type, technology, geography, grid mix, and process. Factor selection is the most consequential methodological decision in inventory construction, the most frequently contested item in third-party verification, and the largest source of year-on-year inventory variance unrelated to actual emissions changes.
GWP converts gas-specific emissions to carbon dioxide equivalent (CO2e), enabling aggregation across gases. The Corporate Standard requires explicit disclosure of the GWP source, version (e.g. IPCC AR6), and time horizon (typically 100-year) applied across the inventory.
7.2 Emission Factor Selection Hierarchy
| Priority | Source Type | Examples | Selection Condition |
|---|---|---|---|
| 1 | Supplier-specific / activity-specific | Direct supplier emissions data; utility-specific generation factor; fuel supplier carbon intensity certificate | Available, verified, and time-period aligned with reporting year |
| 2 | Regional / national | EPA eGRID (US), DEFRA / DESNZ (UK), EEA / EMEP (EU), AEMO (AU), CREEM (CN), IEA national grid factors | Geography-specific factor available for the activity type and reporting period |
| 3 | Global default | IPCC default emission factors (2006 IPCC Guidelines, 2019 Refinement); GHG Protocol default tables | No regional or supplier-specific factor available; apply with disclosure of limitation |
GreenCalculus applies a regional-first factor hierarchy — defaulting to jurisdiction-specific factors (EPA, DEFRA 2025, EEA, IEA 2026) before falling back to IPCC global defaults. Factor source, vintage, and provenance are cited within each calculator’s methodology panel. References: US EPA · UK DEFRA · EU EEA · IEA · factor selection hierarchy.
8. Data Quality & Tiering
The Corporate Standard does not prescribe a formal data quality scoring system. The Scope 3 Standard introduces a five-criterion data quality indicator (DQI) covering technological, geographical, temporal, completeness, and reliability dimensions. PCAF, CDP, and CSRD assurance providers have converged on tiered data hierarchies that practitioners should adopt regardless of which framework triggers the requirement.
| Tier | Data Type | Example | Assurance Strength |
|---|---|---|---|
| Tier 1 | Direct measurement | Stack monitoring; metered fuel consumption; direct refrigerant charge logs | Highest. Audit trail requires only meter records and calibration evidence. |
| Tier 2 | Primary activity data with regional emission factor | Litres of diesel from supplier invoices × DEFRA 2025 factor; metered kWh × eGRID | High. The dominant tier for well-managed Scope 1 and 2 inventories. |
| Tier 3 | Primary activity data with global default factor | Tonnes of clinker × IPCC default; passenger-km of business air travel × IPCC default | Moderate. Acceptable where regional factors are unavailable; disclose the limitation. |
| Tier 4 | Spend-based with environmental input-output factors | USD spent on category × EEIO factor (EXIOBASE, USEEIO) | Lower. The dominant tier for early-stage Scope 3 Category 1 inventories. Acceptable as a baseline; the improvement path is to upgrade to Tier 2 supplier data over time. |
| Tier 5 | Estimation, proxy, or extrapolation | Industry average benchmark; pro-rata extrapolation from sample data | Lowest. Permitted only with explicit disclosure of the estimation methodology and a documented improvement plan. |
Tiering and assurance. Limited assurance providers focus disproportionately on the boundary between Tiers 2 and 3, and between Tiers 4 and 5. The expectation is not that every line of an inventory be Tier 1 — it is that the choice of tier be documented, justified, and improved over time. A consistent shift from spend-based (Tier 4) to supplier-specific (Tier 2) data on material Scope 3 categories is the strongest practical signal of inventory maturation and is what assurance providers expect to see across reporting cycles.
9. Base Year & Recalculation Policy
The Corporate Standard requires every inventory to declare a base year — the historical reference period against which subsequent emissions are tracked. The base year is the operative anchor for target-setting (SBTi commitments use the base year as the reference for absolute or intensity reduction targets), trend disclosure, and consistency assessment.
9.1 Base Year Selection Criteria
- Verifiable data. The base year must rest on data of comparable quality to current-year reporting. Selecting a base year with materially weaker data quality than the current year creates a non-comparable baseline.
- Representative period. Avoid years with anomalous events that materially distort the baseline (production disruptions, plant outages, pandemic-driven activity drops). Where the most recent verifiable year is anomalous, an earlier representative year is preferred.
- Documentation. The selection rationale must be documented and consistent. Changing the base year mid-trajectory requires explicit recalculation disclosure.
9.2 Recalculation Policy — Significance Triggers
The Corporate Standard requires base-year recalculation when a structural change is significant enough to materially affect base-year emissions. The Standard does not prescribe a numeric threshold; organisations must define a documented policy and apply it consistently.
| Trigger | Recalculation Required | Worked Example |
|---|---|---|
| Acquisitions / mergers | Yes — if the acquired entity exceeds the significance threshold | Acquisition of a subsidiary contributing >5% of group emissions in the base year requires base-year restatement to include the entity from the original base-year date. |
| Divestitures / spin-offs | Yes — if the divested entity exceeds the significance threshold | Divestiture of a manufacturing facility historically contributing 12% of Scope 1 requires base-year restatement to exclude the facility from the original base-year date. |
| Outsourcing / insourcing | Yes — where the structural change shifts emissions across scope boundaries | Insourcing previously outsourced logistics moves emissions from Scope 3 Category 4 into Scope 1; both scopes’ base years require restatement. |
| Methodology improvements | Yes — for material methodology corrections | Switching from spend-based (Tier 4) to supplier-specific (Tier 2) data for a material Scope 3 category. Recalculate base year on the improved methodology. |
| Emission factor updates | Generally no | Annual updates to DEFRA or eGRID factors do not trigger base-year recalculation; the Standard treats factor refresh as part of routine inventory updating. |
| GWP version updates | Recommended | Updating from AR5 to AR6 GWP values: recalculate base year on AR6 to maintain comparability across the trajectory. Disclose both the old and new base-year values during transition. |
Adopt a documented significance threshold — a common practitioner standard is 5% of base-year emissions in the affected scope, or 5% of total inventory, whichever is smaller. The threshold itself is less important than its consistent application; verifiers test for application discipline, not for the choice of percentage.
10. Reporting & Disclosure Mapping
The Corporate Standard does not operate in isolation. The following matrix maps its requirements to the four frameworks most commonly cited alongside it in corporate sustainability disclosures and regulatory submissions.
| Requirement | GHG Protocol | ISO 14064-1 | GRI 305 | CSRD / ESRS E1 |
|---|---|---|---|---|
| Scope 1 disclosure | Required | Required (Cat. 1) | 305-1 | Required |
| Scope 2 disclosure | Required | Required (Cat. 2) | 305-2 | Required |
| Dual Scope 2 (location + market) | Required (2015 Guidance) | Not specified | 305-2 (both methods) | Required |
| Scope 3 disclosure | Material categories required; exclusions justified | Optional (Cat. 3–6) | 305-3 | Required (material categories) |
| Base year | Required | Required | Required | Required |
| Boundary method disclosure | Required | Required | Not specified | Required |
| Gas disaggregation | Required | Required | Required | Required |
| GWP version disclosure | Required | Required | Required | Required (AR6 implicit) |
| Third-party verification | Not required | Recommended (via ISO 14064-3) | Recommended | Required (limited assurance) |
| Digital tagging (machine-readable) | Not required | Not required | Not required | Required (XBRL / ESEF) |
Operative regulation: Directive (EU) 2026/470 (Omnibus I), in force 18 March 2026. The Omnibus restructured CSRD scope and timelines. The current state, as relevant to GHG accounting:
- Wave 1 entities (former NFRD scope, FY2024 first reports) continue reporting; Member States may exempt entities falling below the revised thresholds for FY2025 and FY2026.
- Revised threshold: >1,000 employees AND >EUR 450M net turnover. Approximately 85% of previously in-scope companies fall outside mandatory reporting under the revised threshold.
- Wave 2 (delayed): first reports now FY2027 (publication 2028) — a two-year postponement from the original timeline.
- Wave 3 (listed SMEs): removed from mandatory CSRD scope.
- Wave 4 (non-EU groups): revised threshold >EUR 450M EU turnover with an EU subsidiary or branch generating >EUR 200M; first reports FY2028 (publication 2029).
- Limited assurance is permanent. The Omnibus removed the prior requirement to transition to reasonable assurance. Limited assurance remains the operative requirement indefinitely. EU-wide limited assurance standards are due by 1 July 2027, with expected ISSA 5000 alignment.
- Simplified ESRS: EFRAG’s revised standards reduce mandatory data points by approximately 60%; final adoption expected Q3–Q4 2026 with FY2027 mandatory application.
Operative implication for GHG accounting: companies in scope under the revised CSRD will continue to be required to report Scope 1, Scope 2 (dual basis), and material Scope 3 categories, with GHG Protocol acceptable as the methodological basis. Companies that exited scope through threshold change still face indirect requirements via customer, financier, and value-chain expectations. Reference: CSRD ESRS E1 — full mapping.
10.1 GHG Protocol ↔ ISO 14064-1
ISO 14064-1 (2018 revision) aligns closely with the Corporate Standard on boundary, scope, and calculation methodology. The principal differences are structural: ISO 14064-1 integrates directly with the ISO 14064-3 verification protocol, mandates a documented inventory management plan, and uses a six-category emissions classification (direct, indirect from imported energy, indirect from transportation, indirect from products used, indirect from products sold, other indirect) rather than the GHG Protocol’s three-scope framework. The classifications are reconcilable: an inventory built on the GHG Protocol can be presented under either framework with modest procedural additions. See ISO 14064-1 full mapping.
10.2 GHG Protocol ↔ GRI 305
GRI 305 (Emissions, 2016) explicitly adopts the GHG Protocol Corporate Standard for calculation methodology. An organisation preparing a GRI 305-aligned report using GHG Protocol calculation and AR6 GWP is methodologically aligned by construction. GRI 305 adds disclosure requirements around emission intensity ratios (Disclosure 305-4), reduction initiatives (305-5), and Scope 3 significance assessment that the Corporate Standard does not mandate. See GRI 305 full mapping.
10.3 GHG Protocol ↔ SBTi
The Science Based Targets initiative requires inventories to be GHG Protocol-aligned as a precondition for target validation. SBTi-validated targets use the GHG Protocol base year as the reference and apply the Standard’s recalculation rules. Companies setting near-term and long-term net-zero targets must demonstrate Scope 3 coverage under the SBTi Net-Zero Standard, with the Corporate Standard’s materiality assessment as the operative basis. See SBTi Net-Zero Standard mapping.
11. Industry Applicability & Sector Interpretation
The Corporate Standard is methodologically agnostic across sectors but its application varies materially. The following table summarises the Scope 1, 2, and 3 emphasis typical of nine major sectors and the principal interpretation issues each faces.
| Sector | Scope 1 Emphasis | Scope 2 Emphasis | Dominant Scope 3 Categories | Principal Interpretation Issue |
|---|---|---|---|---|
| Heavy manufacturing | High — process & combustion | High | Cat. 1 (purchased goods), Cat. 11 (use of sold products) | Process emissions classification; biogenic fuel treatment |
| Built environment / real estate | Moderate — refrigerants & on-site fuel | High | Cat. 1 (capital goods), Cat. 13 (downstream leased assets) | Tenant vs landlord boundary determination |
| Transport & logistics | Very high — fleet | Moderate | Cat. 4 (upstream T&D), Cat. 9 (downstream T&D) | Owned fleet vs subcontracted carrier boundary |
| Financial services | Low | Moderate | Cat. 15 (financed emissions) | PCAF methodology application; data quality tiering |
| Retail & consumer | Low — refrigerants | High — lighting & HVAC | Cat. 1 (purchased goods), Cat. 12 (end-of-life) | Refrigerant fugitive measurement; supplier engagement |
| Agriculture & food | Very high — livestock, fertiliser, fuel | Moderate | Cat. 1 (upstream agriculture) | Land Sector Standard overlay; biogenic vs fossil emissions |
| Technology / digital | Low | Very high — data centres | Cat. 1 (hardware), Cat. 11 (use phase) | Co-location boundary; market-based renewable claims |
| Public sector | Moderate | High | Cat. 2 (capital), Cat. 6 (travel) | Boundary across agencies; consolidated reporting scope |
| SME (any sector) | Variable | High | Often unmeasured | De facto requirements via customer Scope 3 supplier engagement |
12. Common Reporting Errors & Audit Failures
The following scenarios represent the most common material errors identified during third-party verification of GHG inventories. Each is reproduced here with the protocol basis for non-compliance and the corrective treatment.
Scenario 1
Leased Boilers Excluded from Scope 1
Error. Company excludes gas boilers in leased office buildings on the basis that the landlord owns the equipment.
Why it fails. Under operational control, asset ownership is irrelevant. What matters is who controls operating policies — including HVAC schedule and setpoints. Tenants with operational control of HVAC must include combustion emissions in Scope 1 regardless of ownership. Corporate Standard §3.2.
Correct treatment. Include all stationary combustion sources where operational control exists. Where the landlord controls HVAC, capture the energy consumption as Scope 3 Category 8 (Upstream Leased Assets) and document the boundary rationale in the inventory.
Scenario 2
GWP Version Mismatch — AR5 Values Applied
Error. Inventory uses IPCC AR5 GWP values (2013) for all gases, including N2O and SF6.
Why it fails. AR6 (2021) is the current operative basis recommended by the GHG Protocol. AR5 application materially understates N2O emissions by 3.0% and SF6 by 7.2%. Verifiers treat GWP version as a mandatory disclosure; outdated values without disclosure indicate a non-current methodology. Under CSRD ESRS E1, AR6 alignment is the implicit expectation.
Correct treatment. Update all GWP values to IPCC AR6 (2021) 100-year values. Recalculate base-year emissions on the AR6 basis. Disclose the GWP source, version, and year in all reported figures.
Scenario 3
Scope 2 Market-Based Reporting Without Instruments
Error. Company reports zero Scope 2 emissions on a market-based basis, citing “100% renewable energy commitment”, but holds no RECs, GOs, or PPAs.
Why it fails. A commitment or aspiration to procure renewables does not constitute a contractual instrument under the 2015 Scope 2 Guidance. Zero-emission market-based reporting requires documented, retired certificates or a binding contractual arrangement meeting the eight quality criteria. Without instruments, the location-based grid factor applies to all electricity consumed.
Correct treatment. Report location-based Scope 2 using regional grid factors. If instruments are subsequently procured and retired in the correct geography and time period, market-based reporting may be applied retroactively to the relevant reporting year, with explicit disclosure of the instrument retirement evidence.
Scenario 4
Missing Gas Disaggregation
Error. Inventory reports a single CO2e figure covering all scopes, with no gas-level breakdown.
Why it fails. The Corporate Standard requires individual gas reporting — CO2, CH4, N2O, and applicable F-gases — separately disclosed. A CO2e-only figure conceals the relative contribution of high-GWP gases (F-gases, N2O) and prevents verification of GWP conversion accuracy. This is a mandatory transparency requirement.
Correct treatment. Report all gases separately for each scope. At minimum, disclose CO2, CH4, N2O. Add HFCs, PFCs, SF6, and NF3 where refrigerants, industrial processes, electrical switchgear, or semiconductor manufacturing are present. Disclose explicitly where specific gases are zero or not applicable.
Scenario 5
Internal Double-Counting Across Scope 1 and Scope 3
Error. Company shipments by company-owned vehicles are counted in Scope 1 (mobile combustion); the same shipments are also counted in Scope 3 Category 4 (upstream T&D) on the basis that they appear in the freight ledger.
Why it fails. Double-counting across organisations is an inherent feature of Scope 3 reporting and is not prohibited by the Standard. Double-counting within a single inventory is a comparability and accuracy failure. Emissions from owned and operationally controlled vehicles are Scope 1; emissions from third-party-operated transport are Scope 3 Category 4. No shipment should appear in both categories within the same inventory.
Correct treatment. Document the boundary precisely. Tag every shipment to either Scope 1 (own fleet) or Scope 3 Category 4 (third-party). Reconcile annually against freight ledgers and fleet records.
Scenario 6
Base Year Not Recalculated After Material Acquisition
Error. Company acquires a manufacturing subsidiary contributing 12% of group emissions in Year 3. The base-year inventory is not updated. Year-on-year progress metrics show an apparent 40% reduction driven entirely by the base-year omission.
Why it fails. The Standard requires base-year recalculation when a structural change is material. Reporting against an unchanged pre-acquisition base year violates the consistency principle — comparability between reported years is broken.
Correct treatment. Establish a documented recalculation policy with a defined significance threshold (typically 5% of base-year emissions). Recalculate the base year to include the acquired entity from the original base-year date, using proxy data or estimated retrojection where actual historical data is unavailable. Disclose the recalculation explicitly in the inventory.
Scenario 7
Biogenic CO2 Aggregated into Scope 1 Total
Error. Company combusting biomass or biofuels reports the resulting biogenic CO2 within the Scope 1 total alongside fossil CO2.
Why it fails. The Standard requires biogenic CO2 from biomass combustion to be reported separately as a memo item — not aggregated into the Scope 1 total. The treatment reflects the carbon-neutrality assumption (with caveats addressed in the Land Sector Standard) but the Standard’s disclosure requirement is unconditional.
Correct treatment. Disclose biogenic CO2 as a separate memo item below the Scope 1 total. Continue to include the non-CO2 biogenic emissions (CH4, N2O) within Scope 1 using the appropriate biogenic GWP for methane (AR6 = 27.9). For agricultural and forestry inventories, apply the Land Sector and Removals Standard.
13. Audit Readiness Checklist
Before submitting an inventory for limited assurance or third-party verification, confirm the following. Each item is an item verifiers will test.
- ✔ Boundary approach (operational control / financial control / equity share) selected, documented, and applied consistently across the inventory.
- ✔ Scope 1 (all four source categories) disclosed with gas-level breakdown.
- ✔ Scope 2 location-based reported. Market-based reported where contractual instruments exist, with instrument retirement evidence retained.
- ✔ Scope 3 materiality assessment documented across all 15 categories. Material categories quantified; immaterial categories excluded with documented rationale.
- ✔ GWP version disclosed (AR6 recommended). All gases converted to CO2e using the disclosed GWP basis.
- ✔ Gas-level disaggregation included: CO2, CH4, N2O, applicable F-gases.
- ✔ Biogenic CO2 disclosed separately as memo items, not aggregated into Scope 1 totals.
- ✔ Base year defined. Recalculation policy documented and applied to any structural changes since base year.
- ✔ Emission factor sources cited, with vintage and geography. Factor selection hierarchy applied consistently.
- ✔ Data quality tiering documented for material inventory items. Improvement plan in place where lower-tier data is used.
- ✔ Inventory management plan documented (per ISO 14064-1 if applicable).
- ✔ Year-on-year variance analysis prepared, reconciling structural change, methodology change, factor refresh, and actual emissions change.
14. Frequently Asked Questions
Voluntary as a standard; effectively required in practice. The Corporate Standard is voluntary at the level of the document itself, but it is the prescribed or recommended methodology under CDP, the UN Global Compact, GRI 305, SBTi, and CSRD ESRS E1. Organisations subject to CSRD, SBTi-validated targets, or investor ESG frameworks operate under de facto requirement to use GHG Protocol-aligned methodology. As of 2026, the practical question is not whether to use the Standard but whether the inventory correctly applies it.
Both standards govern corporate GHG inventories and are closely aligned on boundary, scope, and calculation methodology. The principal differences are structural: ISO 14064-1 is a certifiable standard with an explicit link to the ISO 14064-3 verification protocol, making it more common in regulated procurement and supply chain assurance. The GHG Protocol is the more widely adopted disclosure framework, referenced directly by CDP, GRI, SBTi, and CSRD. ISO 14064-1 also uses a six-category emissions classification rather than the GHG Protocol’s three-scope framework, but the two are reconcilable. An inventory built to GHG Protocol methodology can typically achieve ISO 14064-1 alignment with modest procedural additions. See ISO 14064-1 full comparison.
The Corporate Standard does not allow open-ended Scope 3 omission. It requires organisations to identify all relevant Scope 3 categories, assess their materiality, and document any exclusions with justification. An inventory that omits Scope 3 entirely without documented rationale is incomplete by the Standard’s own completeness principle. The separate Corporate Value Chain (Scope 3) Standard (2011) provides the detailed quantification methodology. Under CSRD ESRS E1 and SBTi commitments, material Scope 3 categories are effectively required.
AR6 (IPCC Sixth Assessment Report, 2021) for all new inventories and base-year recalculations. AR5 was the operative basis prior to 2022 and remains in use only for legacy comparability. The GHG Protocol recommends AR6 explicitly. Under CSRD ESRS E1, AR6 is the implicit expectation. For ongoing reporting, internal consistency within the reporting series matters: if your base year was constructed on AR5, you must decide whether to recalculate the base year on AR6 (the recommended approach) or maintain AR5 for trajectory comparability, with explicit disclosure of the choice. GreenCalculus applies AR6 across all calculators. See the AR6 GWP reference table.
The GHG Protocol itself has no company size threshold. Direct regulatory obligations (CSRD post-Omnibus I, for example) are scoped to large organisations by employee count and revenue. In practice, however, SMEs face increasing de facto requirements through procurement: large companies in scope for CSRD or SBTi must account for their supply chain (Scope 3 Category 1), which requires supplier emissions data. SMEs that supply regulated companies face GHG Protocol requirements through customer contract conditions rather than direct regulation. Note that under Omnibus I, SMEs with fewer than 1,000 employees have a legal right to refuse data requests beyond the forthcoming voluntary VSME standard from CSRD-reporting customers.
CSRD is an EU regulatory framework; the GHG Protocol is an accounting methodology. The two are not substitutes. CSRD requires GHG emissions reporting under ESRS E1, and ESRS E1 accepts the GHG Protocol Corporate Standard as the operative methodology basis for Scope 1, 2, and 3 calculation. Following the 18 March 2026 entry into force of Directive (EU) 2026/470 (Omnibus I), CSRD scope has narrowed substantially — the revised threshold is 1,000+ employees AND EUR 450M+ net turnover — and the Wave 2 timeline has been delayed by two years. Limited assurance has been confirmed as the permanent requirement (no transition to reasonable assurance). The methodological relationship to the GHG Protocol is unchanged: companies in scope continue to report Scope 1, dual-basis Scope 2, and material Scope 3 using GHG Protocol methodology. See CSRD ESRS E1 full mapping.
The GHG Protocol launched a revision process for the Corporate Standard, the Scope 2 Guidance, and the Scope 3 Standard in 2022. As of May 2026, drafts are in stakeholder consultation and the revisions have not yet been finalised. The revision process is responding to issues that have emerged since 2004: the maturation of market-based Scope 2 methodology, the proliferation of contractual instruments, the emergence of carbon removals, and convergence pressure with the ISSB IFRS S2 standard. Until the revision is published, the 2004 Corporate Standard remains operative. Practitioners should track the GHG Protocol revision portal for milestone announcements.
Operational control means the reporting entity has the authority to introduce and implement operating policies at the operation — the day-to-day decision rights over how the asset runs. Financial control means the reporting entity has the ability to direct the financial and operating policies of the operation with a view to gaining economic benefit — closer to the accounting concept of consolidation. In practice, operational control is the dominant choice for corporate inventories because it aligns most directly with the entity that can actually reduce emissions through operating decisions. Financial control is more common in finance-led reporting and complex investment vehicles. The two approaches will produce identical results in straightforward wholly-owned subsidiary structures and divergent results in joint-venture or leased-asset arrangements. See operational control and financial control.
15. Sources & References
Related GreenCalculus References
Foundational standards: IPCC AR6 GWP Values · ISO 14064-1 · Scope 3 Standard · Land Sector Standard · Project Protocol
Regional emission factors: US EPA · UK DEFRA · EU EEA · IEA
Sector frameworks: ISO 14067 · GRI 305 · SBTi Net-Zero · CSRD ESRS E1
Methodology: Scope 2 Market vs Location · Factor Hierarchy · Data Quality Tiering · Unit Conversion · Calorific Values
Apply this standard: Scope 1 Calculator · Scope 2 Calculator · Refrigerant Calculator · All calculators
Apply this standard to real emissions data