
Scope 2 · Electricity
Scope 2 Electricity Calculator | Location-Based + Market-Based, 40 Countries
Audit-grade Scope 2 emissions from purchased electricity. Dual-method reporting per GHG Protocol Scope 2 §6.3. 40-country grid registry (DEFRA 2025 / Ember 2025 / EPA eGRID 2023). Up to 5 sites. Scope 3 Category 3 T&D losses companion always computed.
Location-Based method (LB):
tCO₂e = Σ (kWhsite × grid factorcountry) ÷ 1,000
Uses the average grid emission intensity for the country in which electricity is consumed. The default and only-required method when no contractual instruments are held. Always reported, even when market-based is also reported.
Market-Based method (MB):
tCO₂e = Σ [matched kWh × supplier/instrument factor + unmatched kWh × residual mix factor] ÷ 1,000
Uses the contractual emissions data from the instruments the company holds: REGOs (UK), GOs (EU), RECs (US), I-RECs (rest of world), or PPAs. The unmatched portion uses the residual mix factor — the average emissions intensity of grid electricity not claimed by other instrument-holders. Required in addition to location-based when instruments are held.
Dual reporting invariant (Scope 2 §6.3): When the market-based method is computed, the location-based method must also be reported for the same boundary in the same period. This calculator preserves both totals in the result hero, the per-site table, and every export. Location-based is never suppressible.
Scope 3 Category 3 — T&D losses (FERA sub-component): Physical transmission and distribution losses occur on the grid regardless of the contractual instruments held by the consumer. T&D losses are therefore always computed against the location-based grid factor, and reported as a separate inventory line per the GHG Protocol Scope 3 Standard (Cat 3 — Fuel and Energy-Related Activities, T&D losses sub-component). Not added to the Scope 2 total.
Scope boundary: Scope 2 — Purchased electricity consumed within the operational boundary. Excluded: on-site electricity generation (Scope 1), purchased steam / heat / cooling (separate Scope 2 sub-category), upstream generation lifecycle (Scope 3 Cat 3 — outside this calculator), and T&D losses (companion-computed but reported separately).
Multi-site mode aggregates per-meter emissions into a portfolio total with a per-site breakdown table.
Applies to all sites uniformly. For mixed-period inputs, calculate sites separately.
Annualised: result × (12 ÷ period months).
Audit mode exposes the per-site, per-method calculation chain.
Enter electricity consumption (kWh) above to calculate
Location-Based always shown. Market-Based appears alongside when instruments are declared. T&D companion (Scope 3 Cat 3) computed automatically.
Results are estimates based on national / regional grid emission factors and the GHG Protocol Scope 2 Guidance methodology. For US sites, regional sub-grid factors (eGRID subregion) yield higher precision than the national average shown here. Market-based residual mix values are approximated where AIB residual mix data is not yet integrated into MasterBrain — verify against the AIB European Residual Mixes annual publication for high-stakes disclosures. Full methodology notes.
Scope 2 — emissions from purchased electricity — is the second-largest reporting category for most service-sector and commercial organisations, and the only scope where two valid totals must be reported side-by-side. Get the dual-method disclosure wrong and your CDP submission gets flagged; your SBTi target can be rejected on the spot.
This calculator implements the GHG Protocol Scope 2 Guidance in full: Location-Based (grid average) and Market-Based (instrument-adjusted) computed simultaneously, across 40 countries with live DEFRA 2025 / Ember 2025 / EPA eGRID 2023 factors, with up to 5 sites in a single portfolio and an automatic Scope 3 Category 3 T&D losses companion. Both methods are always preserved in the export, in line with Scope 2 §6.3.
Scope 2 is the most-scrutinised category in CDP and SBTi review. Read the complete methodology — including the dual-method invariant, the eight Scope 2 Quality Criteria, the residual mix derivation, and the T&D companion calculation — to prepare for your GHG inventory audit.
Read Full Methodology Whitepaper →Related Calculators
What Is Scope 2 — and Why It’s Deceptively Hard
Scope 2 covers the indirect greenhouse gas emissions associated with the generation of purchased electricity, steam, heat, and cooling consumed by the reporting organisation. The emissions occur at the power plant, but they are attributed to the consumer of the energy because the consumer’s demand caused them. For most office-based, retail, and service-sector organisations, Scope 2 is the largest reporting category by absolute emissions; for industrial organisations it sits behind Scope 1 stationary combustion but ahead of every other category.
The mechanics look simple at first glance: multiply kilowatt-hours by an emission factor, divide by 1,000, report tCO₂e. Free calculators have done this for fifteen years. So why does Scope 2 generate more CDP scoring losses, more SBTi target rejections, and more verification qualifications than any other category in the inventory?
The Three Failure Modes
Failure mode one: only one method reported. The 2015 GHG Protocol Scope 2 Guidance amendment makes dual reporting (location-based and market-based) mandatory whenever the company holds contractual instruments — REGOs, GOs, RECs, I-RECs, or PPAs. Reporting only the market-based figure to take credit for instruments held, while suppressing the location-based figure, is a §6.3 disclosure breach. Reporting only location-based when the company genuinely holds qualifying instruments is also non-compliant — though far less commonly flagged. Most organisations don’t realise this is a binary requirement, not a choice.
Failure mode two: stale grid factors. Grid emission factors change every year because the underlying generation mix changes. The UK’s DEFRA 2025 release dropped the GB grid factor 15% versus DEFRA 2024 — from 0.20705 to 0.177 kg CO₂e/kWh — driven by less natural gas and more imports onto the grid. An organisation reporting in 2026 using DEFRA 2024 factors is over-stating its Scope 2 by approximately 17% on a pre-tax basis, and its science-based-target progression is artificially flattering. Auditors flag stale factors as material misstatements.
Failure mode three: the “green tariff” illusion. A retail “100% green” supply contract does not automatically zero a market-based result. The contract has to satisfy the eight Quality Criteria of GHG Protocol Scope 2 Guidance §7 — and most retail green tariffs fail at least three of them. The instruments behind the contract may be unbundled (the certificate sold separately from the electricity), may be from a 1990s-era hydro asset (no additionality), may not have been retired in the consumer’s name, or may not match the consumption period. SBTi reviewers have been steadily tightening their stance on retail green tariffs since 2023.
What This Calculator Does Differently
This calculator implements the full GHG Protocol Scope 2 dual-method architecture. Location-based and market-based are not toggles — they are computed simultaneously when market-based instruments are declared, and the location-based figure is never suppressible from the export. The 40-country grid registry pulls live from MasterBrain v2026.203 with DEFRA 2025, Ember 2025, and EPA eGRID 2023 factors. The Scope 3 Cat 3 T&D loss companion is computed automatically against the location-based grid factor — the only methodologically defensible basis for that companion. Up to five sites can be aggregated into a single portfolio with mixed methods and per-site breakdown.
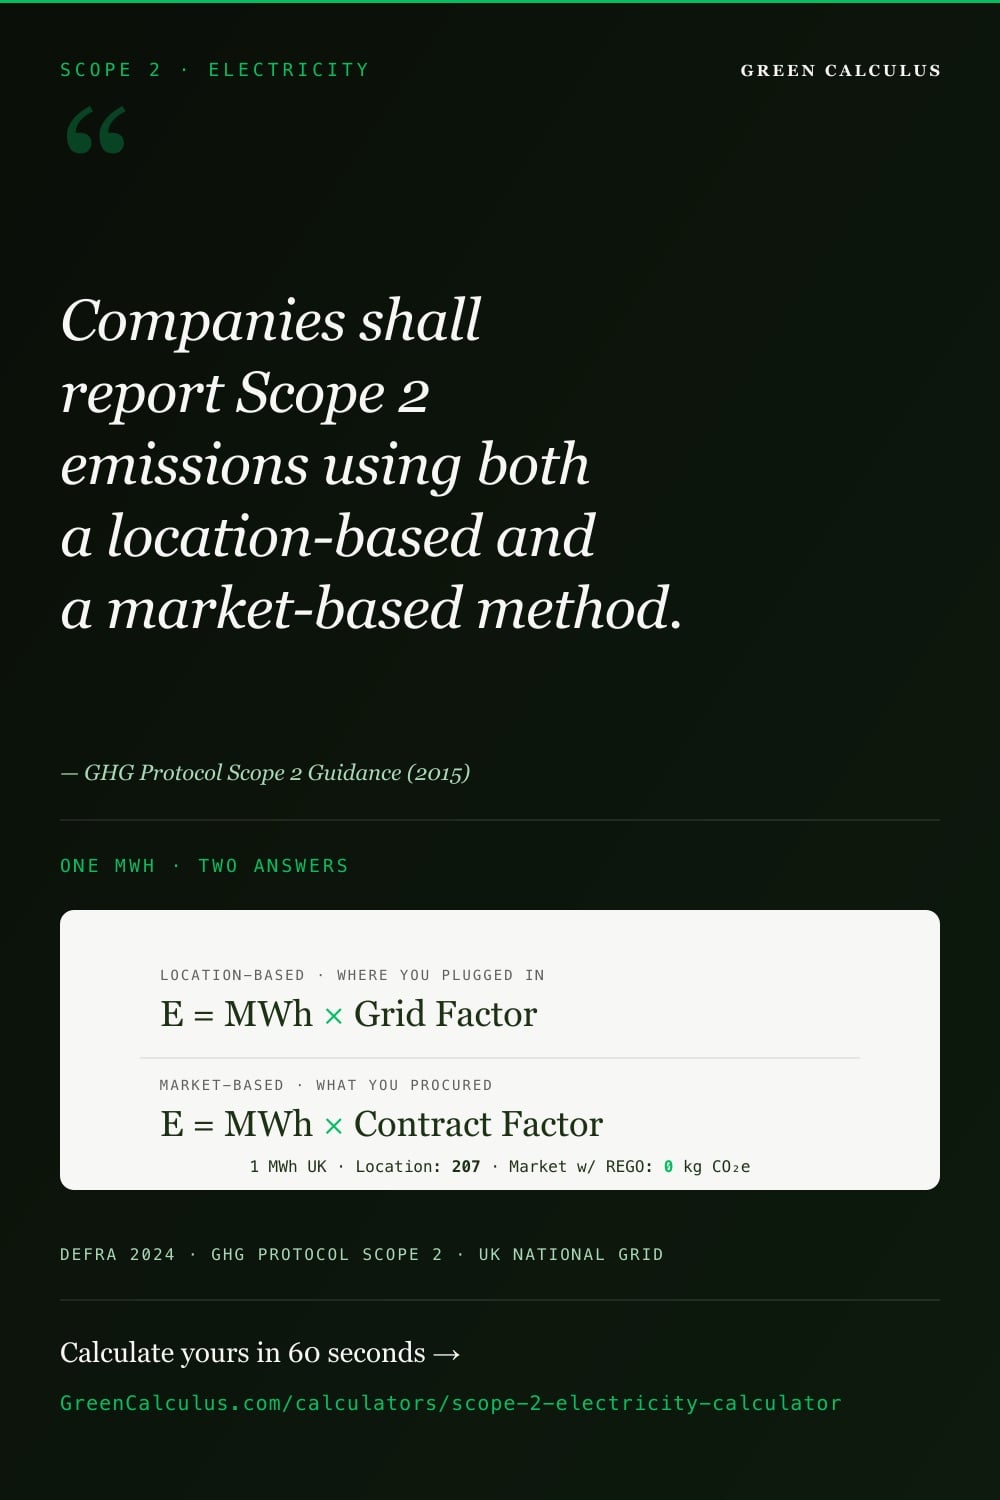
 residual mix on the unmatched portion. Worked example at 1 GWh in the United Kingdom yields 177 tCO2e Location-Based versus 0 tCO2e Market-Based under 100 percent REGO-matched coverage with all eight Quality Criteria met. Suppressing either method when contractual instruments are held is a Section 6.3 disclosure breach.” loading=”lazy” width=”1200″ height=”630″ style=”display:block;width:100%;max-width:920px;height:auto;margin:0 auto;border-radius:8px;box-shadow:0 4px 14px rgba(0,0,0,0.06);” />
The Two Methods + Eight Quality Criteria
Scope 2 is the only inventory category where two complete totals must be reported in parallel. Both must use the same boundary, the same reporting period, and the same activity data. They differ only in how the emission factor is sourced — and that single difference can change the reported total by 90% in either direction.
Method 1: Location-Based
Uses the average emission intensity of the grid in the country (or, where available, the region or sub-grid) where the electricity is consumed. The factor reflects the actual generation mix supplying the local grid: gas, coal, nuclear, hydro, solar, wind, imports. This method describes the physical emissions associated with the consumption pattern and is the only-required method when the organisation holds no contractual instruments.
Strengths: stable, comparable across organisations, derived from official national inventories, no ambiguity around instrument validity. Weaknesses: insensitive to the consumer’s procurement decisions — a company that buys 100% renewable PPAs reports the same location-based figure as the company next door buying default supply.
Method 2: Market-Based
Uses contractual emissions data from the instruments the organisation holds — REGOs in the UK, GOs in the EU, RECs in the US, I-RECs in the rest of the world, or supplier-disclosed factors from PPAs. The unmatched portion (electricity consumed but not covered by qualifying instruments) uses the residual mix factor — the average emissions intensity of generation not claimed by other instrument-holders. This method describes the consumer’s procurement choices and is required in addition to location-based when instruments are held.
Strengths: surfaces the impact of renewable procurement decisions, aligns with SBTi and CDP scoring, motivates clean-energy procurement. Weaknesses: requires diligent instrument tracking, vulnerable to additionality concerns, depends on residual mix data quality.
Which Frameworks Require Which
| Framework | Location-based | Market-based | Notes |
|---|---|---|---|
| GHG Protocol Corporate Standard | Required | Required when instruments held | Both must be reported when MB applies; LB is the default fallback. |
| SBTi Corporate Net-Zero Standard | Reported | Used for target setting | Target progression measured market-based; both disclosed. |
| CDP Climate Change disclosure | Reported (C6.3) | Reported (C6.3) — scored | CDP scores against market-based for procurement leadership; LB stays in the disclosure. |
| CSRD / ESRS E1 | Required | Required when applicable | EU disclosure requires both. Residual mix expected. |
| UK SECR (mandatory) | Required | Optional disclosure | SECR primary disclosure is location-based per DEFRA guidance. |
| Singapore NEA (Carbon Pricing Act) | Required | Not used for tax | Carbon tax applies to Scope 1 direct emissions. Scope 2 is disclosure only. |
The Eight Quality Criteria — When a Market-Based Instrument Actually Counts
This is where most organisations and most free calculators stop reading. GHG Protocol Scope 2 Guidance §7 specifies eight Quality Criteria that any contractual instrument must satisfy to be valid for market-based reporting. Failing one criterion invalidates the instrument. Most retail green tariffs fail three or more. CDP and SBTi reviewers walk this list explicitly.
| # | Criterion | What it means in practice |
|---|---|---|
| 1 | Conveys attributes | The instrument must convey the underlying generation attributes — fuel source, emissions, vintage, location. A bare “renewable purchase” line on a bill is insufficient. |
| 2 | Exclusive claim | The instrument must be tracked by a recognised registry (Ofgem REGO, AIB GO, M-RETS, I-REC) such that no other consumer can claim the same MWh. |
| 3 | Retired by/for the reporting entity | The instrument must be retired or cancelled in the registry on behalf of the consumer. Held but unretired instruments do not count. |
| 4 | Reasonably close in time | Vintage of the instrument should match the reporting period — typically same year or the immediately preceding compliance window. |
| 5 | Same market boundary | The generation must be on the same grid that delivered the consumed electricity. UK REGOs cannot be used to claim US consumption. |
| 6 | Exclusive ownership claim | The contractual claim must be exclusive — no double-counting via the underlying physical electricity also being claimed elsewhere. |
| 7 | Residual mix used for unmatched | The portion of consumption not matched by qualifying instruments must use the residual mix factor — not the grid average. |
| 8 | Quality consistent over time | The reporting entity should not switch instrument types or sources opportunistically year-on-year to improve disclosed numbers. |
Most retail “100% renewable” tariffs are sold on the strength of REGOs (in the UK) bought from large legacy hydro stations dating back to the 1990s. The supplier buys the certificates separately from the electricity, bundles them with default-supply electrons, and markets the result as “green”. The certificates technically pass criteria 1–6, but they fail the additionality test most regulators are now layering on top of the GHG Protocol baseline. SBTi has been increasingly explicit since 2023 that REGOs from very old, fully-amortised renewable assets should not be used for science-based-target progress — they reflect no new clean generation, only paperwork.
The Grid Factor Problem — Why Your Number Changes Every Year
Grid emission factors are not constants. They change year-on-year because the underlying generation mix changes year-on-year. The 2024 grid was burning more gas than the 2025 grid; the 2025 grid will look different again in 2026 as more solar and wind capacity comes online and as cross-border interconnectors shift import patterns. A factor that was correct in March is stale by July if your jurisdiction publishes mid-year revisions.
The DEFRA 2025 Drop — A Newsworthy Anchor
The most dramatic recent example: the UK grid factor in DEFRA 2025 fell to 0.177 kg CO₂e/kWh — a 15% reduction versus the DEFRA 2024 value of 0.20705. The underlying drivers, per the DEFRA 2025 Major Changes documentation, were a reduction in domestic gas-fired generation and an increase in net electricity imports onto the GB grid, both of which lower the grid’s average carbon intensity per kWh delivered. For organisations consuming significant UK electricity, this single factor change reduces reported Scope 2 location-based by 15% with no operational change whatsoever.
This sounds like good news. For some organisations it is. For others — particularly those with science-based targets calibrated to a 2018 or 2019 baseline — it creates a disclosure complication. If the baseline year used DEFRA 2018 factors and the current year uses DEFRA 2025 factors, the apparent “reduction” includes the methodological factor drift, not just operational improvement. SBTi and CDP both expect base-year recalculation when factor changes are this large; doing the recalc surfaces that the operational reduction is smaller than the headline number suggests.
Why Factors Diverge Between Sources for the Same Country
For the same kWh of UK electricity, the calculator can return different factors depending on the source the user selects. This is not a bug — it reflects genuine methodological differences between publishers.
| Source | GB factor (2025) | Methodology | Update cadence |
|---|---|---|---|
| DEFRA 2025 | 0.177 kg CO₂e/kWh | UK national inventory, gross CV basis, AR5 GWP-100 inherited | Annual, June |
| Ember 2025 | ~0.207 kg CO₂e/kWh (latest available) | Generation-based intensity from the national generation mix | Annual, Q1 |
| UK National Grid ESO real-time | 0.05–0.45 kg CO₂e/kWh (varies hourly) | Half-hourly settlement basis, real-time | Continuous |
For SECR-aligned reporting the calculator uses DEFRA 2025 by MasterBrain default. For non-UK organisations or voluntary disclosure aligned to international convention, Ember 2025 is the appropriate source — the calculator’s country selector defaults to Ember factors for non-GB countries automatically.
What “Stale” Looks Like in Practice
If your inventory uses DEFRA 2024 factors today (May 2026), you are reporting your UK Scope 2 approximately 17% high. If you are reporting against a science-based target that uses DEFRA 2018 factors as the baseline reference and DEFRA 2024 for the current year, your apparent year-on-year reduction includes a factor-drift component that an auditor will isolate and remove. The fix is mechanical: update to DEFRA 2025 (or Ember 2025 for non-UK), recalculate the base year using consistent factor methodology, document the restatement in your methodology notes, and disclose the restatement in your sustainability report.
EACs, REGOs, GOs, RECs, I-RECs — What Actually Counts
An Energy Attribute Certificate (EAC) is a tradeable instrument representing the environmental attributes of one megawatt-hour of generation — its source (solar, wind, hydro, etc.), its location, its vintage. The instrument is sold separately from the underlying electricity (which is consumed by whoever happens to be on the grid at that moment). EACs are the primary mechanism for market-based reporting under GHG Protocol Scope 2 §6.
The Five Types in Common Use
| Instrument | Region | Registry | Typical use | SBTi acceptance status |
|---|---|---|---|---|
| REGO (Renewable Energy Guarantee of Origin) | UK | Ofgem REGO | Backs UK retail “green tariffs” and corporate procurement | Accepted with criteria 1–8 met; SBTi increasingly questions REGOs from pre-2000 hydro |
| GO (Guarantee of Origin) | EU + EEA + UK (cross-border) | AIB national registries | Cross-border EU corporate procurement | Accepted; vintage and additionality checks expected |
| REC (Renewable Energy Certificate) | USA, Canada | M-RETS, NEPOOL-GIS, NAR, others | Default US corporate procurement; both bundled and unbundled markets | Accepted; Green-e certification preferred for additionality signal |
| I-REC (International REC) | Rest of world (~50 countries) | I-REC Standard | Asia, Africa, Latin America corporate procurement where no national registry exists | Accepted; treated as the default international instrument |
| PPA (Power Purchase Agreement) | Global | Bilateral contract — supplier and registry combined | Long-term direct procurement, often paired with new-build assets | Strongly preferred; physical PPAs with new-build clearly satisfy additionality |
Bundled vs Unbundled — The Single Most Misunderstood Distinction
A bundled instrument is sold together with the underlying electricity from the same generator: the certificate and the electrons travel through the same contract. A unbundled instrument is sold separately — the electricity goes to a default-supply customer; the certificate is purchased independently by a different entity that wants to claim the renewable attribute. Most retail “green tariffs” are unbundled: the supplier buys cheap unbundled REGOs from legacy hydro and bundles them with default-supply gas-and-grid electrons in marketing copy.
Both bundled and unbundled instruments technically satisfy the eight Quality Criteria of Scope 2 Guidance §7 if they are properly tracked, retired, vintage-matched, and geographically appropriate. But CDP and SBTi reviewers increasingly distinguish between them in scoring. A bundled PPA with a new-build solar farm scores significantly higher than the same MWh covered by unbundled REGOs from a 1990s hydro station. The Quality Criteria are necessary but not sufficient for high disclosure scores.
The Additionality Question
Additionality is not formally part of the eight Quality Criteria — but it is increasingly the ninth, de facto, criterion that determines disclosure score and target acceptance. Additionality asks: did your purchase of this instrument cause new clean generation to come online that would not otherwise have existed? A 30-year-old hydro station selling REGOs into the spot market produces the same MWh whether or not your company buys the certificate; there is no additionality. A new-build solar farm financed on the strength of a 15-year corporate PPA produces MWh that would not exist without that contract; high additionality.
SBTi has been progressively tightening its language on additionality since 2023. The current Net-Zero Standard expects companies to disclose the fraction of market-based reductions arising from new-build assets versus legacy unbundled certificates. CDP’s 2025 scoring methodology weights instrument quality alongside instrument quantity. The trajectory is clear: the cheap-REGO route to a low market-based number will not survive the next two CDP scoring revisions intact.
Why the Calculator’s Number Differs From Your Utility Bill
The single most-asked question once a real customer hits this calculator: “My utility says my electricity is 0.05 kg/kWh. Your calculator says 0.177. Who’s right?” The honest answer is: both, often, depending on the question being asked. This section walks the three most common scenarios.
Scenario A — UK retail “100% green” tariff, supplier claims 0 kg/kWh
Your supplier (e.g., a UK retail brand selling a “100% renewable” tariff) prints 0.000 kg CO₂e/kWh on the contract. The calculator, in location-based mode for GB, returns 0.177 kg/kWh — the average of the physical UK grid. Both numbers are legitimate but answer different questions.
The supplier is making a market-based claim: “we have purchased and retired enough REGOs to cover your consumption, so on a contractual basis your electricity is 100% renewable.” The calculator’s location-based figure is making a physical claim: “the actual mix of generation supplying the grid that delivered electrons to your meter has an average intensity of 0.177 kg/kWh, regardless of what certificates you hold.” For GHG Protocol-aligned reporting, both must appear. To use the supplier’s 0.000 in your inventory, switch the relevant site to LB + MB (dual) mode in the calculator and enter the supplier factor — the calculator will then show LB at 0.177 and MB at 0.000 alongside.
Scenario B — German retail “Ökostrom” tariff, supplier claims 0.020 kg/kWh
Your German supplier prints a small but non-zero factor on the contract — perhaps 0.020 kg CO₂e/kWh — reflecting a mix of GO-backed renewables plus a small amount of supplemental gas. The calculator in location-based mode for DE returns 0.330 kg/kWh. The supplier figure is a market-based factor reflecting the contractual mix; the calculator’s LB figure reflects the physical German grid average.
To incorporate the supplier figure in market-based mode, enter 0.020 as the supplier factor and 100% EAC coverage. The calculator will compute MB at 0.020 × kWh / 1,000 and preserve LB at 0.330 × kWh / 1,000. The unmatched residual mix term is zero in this case because EAC coverage is 100%. If the supplier claims, say, 80% renewable coverage, enter 80% EAC and 0.000 supplier factor; the calculator will use the German residual mix factor for the unmatched 20%, which will be materially higher than the German grid average — usually around 0.46–0.50 kg/kWh — because residual mix backs out the renewable content already claimed by other instrument-holders.
Scenario C — US supplier disclosed factor, regional sub-grid concern
Your US supplier discloses a contractual factor of 0.250 kg CO₂e/kWh based on their generation portfolio. The calculator’s national-average US LB is 0.350 kg/kWh (EPA eGRID 2023), but your facility is in California where the actual sub-grid factor (CAMX) is closer to 0.200 kg/kWh. The 0.350 national average is methodologically defensible but operationally misleading for a California facility.
For market-based reporting, use the supplier factor (0.250) — it satisfies the Quality Criteria assuming proper REC retirement. For location-based, use the eGRID sub-region factor where higher precision is required. The calculator’s “Custom grid factor” escape hatch is the right path for sub-grid factors not yet exposed by MasterBrain — enter the eGRID CAMX factor (0.200) as a custom value, and document the source in your methodology notes.
The Decision Framework
- If you’re asking “what is the physical climate impact of my electricity consumption?” — use the calculator’s location-based figure.
- If you’re asking “what does my procurement contract say I’m responsible for?” — use the supplier figure as your market-based factor (verify it satisfies the eight Quality Criteria).
- For GHG Protocol-aligned reporting — disclose both. The calculator preserves both totals automatically when market-based inputs are declared.
- For SECR (UK), the primary disclosure is location-based. Market-based is supplementary. For CDP / SBTi / CSRD, both are required.
Residual Mix — The Number Nobody Reports
The residual mix factor is the average emissions intensity of grid electricity that has not been claimed by any consumer through contractual instruments. It is the methodologically correct factor to use for the unmatched portion of a market-based calculation — and it is the single most-omitted number in published Scope 2 disclosures. CDP scoring methodology has flagged residual mix omission as a recurring quality issue since 2022.
Why Residual Mix Is Almost Always Higher Than the Grid Average
Grid average factors are computed across all generation supplying the grid, including the renewable generation backed by REGOs/GOs/RECs. When other consumers retire those certificates and claim the clean MWh, that clean generation is “removed” from the unclaimed pool. The remaining unclaimed pool — the residual mix — is therefore weighted toward the dirtier sources. For a country with substantial renewable generation but heavy EAC market activity (UK, Germany, Netherlands), the residual mix can be 30–60% higher than the grid average.
The published 2024 AIB European Residual Mixes give a sense of magnitude: for the UK, the AIB residual mix factor is around 0.488 kg CO₂e/kWh — roughly 2.8× the DEFRA 2025 grid average of 0.177. That gap exists because UK consumers and businesses have retired so many REGOs that the unclaimed residual is dominated by gas-fired and imported generation. If your market-based calculation uses 0.177 (the grid average) for the unmatched portion, you are systematically under-reporting the residual.
Where to Find Residual Mix Data
| Region | Source | Update cadence | Notes |
|---|---|---|---|
| Europe (EU + UK + EEA) | AIB European Residual Mixes | Annual, May/June (year-2 vintage) | The authoritative source. Per-country factors with full methodology. |
| USA | EPA eGRID Residual | Annual | Sub-region residual mixes; less prominent than the standard eGRID factors but published. |
| Rest of world | I-REC Standard residual | Annual where available | Coverage variable. For countries with low EAC market depth, residual ≈ grid average. |
Calculator Behaviour and MasterBrain Roadmap
MasterBrain v2026.203 does not yet expose residual mix as a first-class field. The Scope 2 Engine v1.0 currently approximates the residual mix as grid factor × 1.15 for European countries — a conservative untraced premium that surfaces a residual signal without overstating it. When the user declares any market-based input, the calculator emits an audit warning recommending verification against the AIB published values for high-stakes disclosures. AIB residual mix integration into MasterBrain is on the v2026 roadmap; once integrated, the calculator will prefer the AIB value over the 1.15× approximation automatically via mbGet('grid_residual.{CC}.factor', fallback) with no engine code change required.
Scope 3 Cat 3 — T&D Losses (the forgotten companion)
When electricity is generated at a power station, a portion of it is lost as heat during transmission across high-voltage lines and again during distribution through local networks before reaching the meter. For the consumer’s nameplate consumption to actually arrive at the meter, more electricity had to be generated upstream than the consumer paid for. The emissions associated with that “extra” generation are the consumer’s transmission and distribution (T&D) losses — and they fall under Scope 3 Category 3 (Fuel and Energy-Related Activities, FERA), specifically the T&D sub-component.
Why T&D Losses Are Always Computed Against the Location-Based Factor
This is the single most important methodological point in this section, and the one most often misapplied. Physical losses on the grid happen regardless of what contractual instruments the consumer holds. If a consumer has 100% REGO coverage and a market-based factor of 0.000 kg/kWh, the grid still loses approximately 8% of generated electricity in transmission and distribution — and the emissions associated with generating those losses still occurred. The T&D companion must be computed against the location-based grid factor, not the consumer’s market-based factor. This calculator enforces that rule unconditionally.
Magnitude — How Material Is It?
For UK consumers using DEFRA 2025 (GB grid factor 0.177 kg/kWh) with a regional T&D loss percentage of 8.3%, the T&D companion is approximately 0.016 kg CO₂e/kWh — about 9% of the Scope 2 location-based figure. For US consumers with EPA eGRID 2023 (0.350 kg/kWh) and 5% losses, T&D is approximately 0.018 kg/kWh — about 5% of Scope 2. For Indian consumers with high grid losses (~12%) and high carbon intensity (0.670 kg/kWh), T&D companions can exceed 0.097 kg/kWh — 14% of Scope 2.
For a typical UK office consuming 100,000 kWh annually, T&D losses total approximately 1.6 tCO₂e. Across a multi-site portfolio of 1 GWh consumption, T&D companions can be 16+ tCO₂e — large enough that omitting them creates a material misstatement under most assurance protocols.
Reporting T&D — Separate Inventory Line
The GHG Protocol Scope 3 Standard categorises T&D losses as part of Category 3 (FERA), not as part of Scope 2. They must appear in your inventory as a separate line:
- Scope 2 — Purchased electricity: location-based and market-based totals (per §6.3)
- Scope 3 Cat 3 — Fuel and Energy-Related Activities, T&D losses sub-component: the T&D companion figure
The calculator’s JSON export carries the T&D companion under portfolio.scope_3_cat_3_td with the LB-basis explicitly disclosed — drop it directly into your Scope 3 Cat 3 inventory line.
Worked Examples — Three Scenarios, Calculator-Aligned
The three scenarios below match the calculator’s exact arithmetic byte-for-byte. Each can be reproduced by entering the inputs into the calculator above and verifying the headline output. All numbers come from MasterBrain v2026.203 verified DEFRA 2025 / Ember 2025 / EPA eGRID 2023 values.
Audit Checklist — What Gets Flagged in Verification
Third-party verification of Scope 2 disclosures — under ISO 14064-3, ISAE 3410, or voluntary verification protocols — follows a systematic process of tracing each material emission source through the methodology to the reported figure. The eight items below are the highest-frequency findings on Scope 2 verifications.
Geographic and Regulatory Context
UK — SECR and ESOS
SECR (Streamlined Energy and Carbon Reporting) is the mandatory disclosure framework for large UK companies. Per the relevant DEFRA guidance, SECR’s primary Scope 2 disclosure is location-based, calculated using the published DEFRA UK grid factor for the reporting year. Market-based may be additionally disclosed but is not the primary metric. The calculator’s default GB factor (0.177 kg CO₂e/kWh, DEFRA 2025) is the SECR-aligned value.
ESOS Phase 3 (Energy Savings Opportunity Scheme) requires energy consumption disclosure by source, including purchased electricity. The activity data (kWh) feeds directly into both the SECR location-based total and the ESOS energy intensity figures. Calculator outputs a portfolio kWh sum and per-site breakdown supporting both disclosures.
EU — CSRD and ESRS E1
The Corporate Sustainability Reporting Directive (CSRD) with the ESRS E1 climate disclosure standard requires both location-based and market-based Scope 2 figures, with full methodological transparency. ESRS E1-6 specifies the disclosure format: gross Scope 2 emissions (tCO₂e), broken down by location-based and market-based, with energy consumption (MWh) and the methodology reference for the factors used.
ESRS E1 also expects the residual mix to be applied for unmatched market-based portions and aligns explicitly with GHG Protocol Scope 2 Guidance §7 Quality Criteria. CSRD-aligned reporting cannot omit residual mix; doing so triggers an immaterial-but-flagged finding in the assurance opinion.
USA — CDP, SEC Climate Disclosure, EPA
CDP Climate Change disclosure (C6.3 — Scope 2 emissions) requires both location-based and market-based, with methodology questions covering EAC types, residual mix, and supplier-disclosed factors. CDP scoring methodology weights instrument quality (additionality, vintage, geographic match) alongside instrument quantity. The 2025 scoring revision moved further in this direction.
The SEC’s climate disclosure rule (where applicable to the registrant) requires Scope 1 and Scope 2 disclosure to investors with limited assurance. The SEC’s Scope 2 alignment with GHG Protocol §6.3 is explicit: where instruments are held, both methods disclosed. EPA eGRID is the SEC’s expected primary source for US grid factors.
Singapore — NEA and the Carbon Pricing Act
Singapore’s Carbon Pricing Act applies a carbon tax to large direct emitters. The tax base is Scope 1 — Scope 2 is disclosure-only and does not generate tax liability. NEA’s MRV framework accepts location-based Scope 2 calculation using the grid emission factor published by Singapore’s Energy Market Authority, which the calculator carries via the SG entry in MasterBrain (currently 0.497 kg CO₂/kWh per Ember 2025). For voluntary disclosure aligned with global frameworks (CDP/SBTi), market-based reporting using I-REC instruments is increasingly common in the Singapore corporate market.
Data Sources, Factor Versioning, and Update Transparency
Primary Sources
DEFRA 2025 GHG Conversion Factors (DESNZ, June 2025) is the primary source for the GB grid factor (0.177 kg CO₂e/kWh) and the GB T&D loss factor. DEFRA publishes annually each June. AR5 GWP-100 inherited (CH₄=28, N₂O=265). MasterBrain v2026.203 carries the verified DEFRA 2025 value.
Ember Yearly Electricity Data 2025 provides grid factors for 39 countries other than GB (MasterBrain §04 grid table). Methodology: generation-based carbon intensity, derived by applying per-technology emission factors to each country’s reported generation mix. The Ember 2025 release covers the 2024 calendar year. Published under a CC BY 4.0 licence and refreshed each year, with the long-format yearly dataset updated in the first quarter.
EPA eGRID 2023 provides the US national average factor (0.350 kg CO₂e/kWh) and US sub-region factors (CAMX, NYISO, MROW, ERCT, etc.). For higher-precision US site reporting, the eGRID sub-region factor should be entered into the calculator’s custom-factor field with the sub-region name documented in the audit trail. MasterBrain currently carries only the US national average; sub-regions are on the roadmap.
Residual mix data is sourced from AIB European Residual Mixes (annual, May/June publication) for European countries and from EPA eGRID Residual for US sub-regions. MasterBrain v2026.203 does not yet expose these as first-class fields; the calculator approximates residual mix as grid × 1.15 for European countries with an audit warning recommending verification against the published AIB values. Full AIB integration is on the v2026 MasterBrain roadmap.
Update Cadence and Recency
| Source | Cadence | Typical lag | Calculator behaviour |
|---|---|---|---|
| DEFRA | Annual, June | 1 year (DEFRA 2025 = 2023 data) | MB updated within 30 days; live read on every calc |
| Ember | Annual, Q1 | 1 year (Ember 2025 = 2024 data) | MB updated within 60 days |
| EPA eGRID | Annual, January | 2 years (eGRID 2023 = 2021 data) | MB updated within 60 days |
| AIB Residual Mixes | Annual, May/June | 2 years (AIB 2024 = 2022 data) | v2026 roadmap; current 1.15× approximation |
Why Factors Diverge
For the same UK kWh, DEFRA 2025 returns 0.177 and Ember 2025 returns approximately 0.207 — a modest gap. The gap reflects two methodological differences: (1) DEFRA derives a pre-aggregated national factor from the UK inventory on a gross calorific value basis with AR5 GWP-100, while Ember derives a generation-based intensity by applying per-technology emission factors to the reported generation mix; (2) DEFRA reflects only generation supplied to the GB grid, while Ember’s figure tracks the generation mix as reported in the underlying source datasets. Neither is “more right” than the other — they answer slightly different questions. For UK regulatory submissions, DEFRA is the regulator-specified path; for international voluntary disclosure aligned to global convention, Ember is appropriate.
Frequently Asked Questions
You can report a market-based Scope 2 of zero if your contractual instruments cover 100% of your consumption and the instruments themselves carry a zero factor (REGOs and GOs typically do, by convention). But location-based will never be zero unless your facility runs entirely off-grid — physical electricity from the grid carries the grid’s average intensity regardless of what certificates you hold. Reporting “Scope 2 = 0” without specifying market-based is a §6.3 disclosure breach. The honest reporting format is “LB X tCO₂e, MB 0 tCO₂e” — both numbers, both labelled.
Technically yes, if the underlying instruments (typically REGOs in the UK or GOs in the EU) satisfy the eight Quality Criteria of Scope 2 Guidance §7 — proper registry retirement, vintage matching the reporting period, same market boundary, etc. In practice, most retail green tariffs use cheap unbundled REGOs from legacy hydro assets that pass the Quality Criteria but fail informal additionality tests. SBTi and CDP have been progressively tightening their stance on this. The calculator will let you enter a 100%-matched, zero-factor REGO position — but document the instrument source, vintage, and registry retirement evidence in your methodology notes for audit defence.
Both are Energy Attribute Certificates. REGOs (Renewable Energy Guarantees of Origin) are the UK domestic instrument, tracked by Ofgem. GOs (Guarantees of Origin) are the European-Union-wide instrument tracked by national registries under the Association of Issuing Bodies (AIB) coordination — they are tradeable across EU/EEA borders and into the UK post-Brexit under reciprocity arrangements. Operationally they are very similar; the choice between them is usually about market-boundary alignment (Quality Criterion 5) and registry depth.
Section 5 covers this in depth. Short version: your supplier’s “0 kg/kWh” is a market-based figure based on REGOs they hold on your behalf. The calculator’s location-based figure is the physical grid average, regardless of certificates. Both are valid; they answer different questions. For GHG Protocol-aligned reporting, both must appear. Switch the relevant site to LB + MB (dual) in the calculator and enter your supplier’s claimed factor — both totals will then be preserved in the output and the export.
For higher precision, sub-region. The US grid varies enormously: California (CAMX) is around 0.200 kg/kWh because of solar and hydro; the Midwest (MROW) is around 0.500 because of coal. Using the national average (0.350) for either is methodologically defensible but operationally misleading. The calculator’s national average is the default for ease of use; for material disclosures, enter the sub-region factor in the custom-factor field and document the source (EPA eGRID 2023, sub-region code) in your methodology notes. Sub-region integration into MasterBrain is on the roadmap.
This is unusual but valid. It happens when your residual mix factor (used for the unmatched portion) is materially higher than the grid average, and your EAC coverage is partial. For example, in the UK, the residual mix is approximately 0.488 kg/kWh while the grid average is 0.177. If you have 50% REGO coverage, your MB calculation is (50% × 0) + (50% × 0.488) = 0.244 kg/kWh — higher than the LB 0.177. This is a true reflection of the residual mix and should be disclosed as-is, not adjusted. The driver is that the renewable content already claimed by other instrument-holders has been “removed” from the residual pool, leaving a dirtier remainder.
No — T&D losses fall under Scope 3 Category 3 (Fuel and Energy-Related Activities, T&D losses sub-component). They are reported as a separate inventory line, not added to Scope 2. The calculator computes the T&D companion automatically against the location-based grid factor (the only methodologically defensible basis) and exposes it in a dedicated result block, in the JSON export under portfolio.scope_3_cat_3_td, and as a separate CSV column. Drop the figure directly into your Scope 3 Cat 3 inventory line.
The calculator covers 40 countries via the country selector — including all major economies and most active corporate-reporting markets. For a country not listed, select “— Country not listed (enter custom factor) —” at the bottom of the dropdown and enter your factor manually. Source it from your national grid operator’s published intensity, Ember’s full country dataset (covering ~150 countries), or your utility supplier’s annual disclosure. Document the source in your methodology notes; the calculator will surface an audit warning indicating that T&D companion is not computed for custom factors (regional loss data unavailable).
Calculate two periods separately. For the pre-PPA period, use LB-only mode with the grid factor. For the post-PPA period, use LB + MB mode with the PPA’s contractual factor and 100% coverage (assuming the PPA covers full consumption from start date onward). Sum both totals manually for the annual disclosure. Document the period split in your methodology notes; this is the standard treatment for mid-year procurement changes and survives verification cleanly.
For preliminary internal use, yes. The calculator approximates European residual mix as grid factor × 1.15, which is conservative (likely understates true residual mix) and surfaces an audit warning whenever it is used. For external regulatory or framework disclosures (CSRD, CDP, SBTi), source the AIB European Residual Mixes published value for your country and enter it as a custom factor. Cite the AIB publication year in your methodology notes. AIB integration into MasterBrain is on the v2026 roadmap; once integrated, the calculator will use the published value automatically.
What’s Next? Completing Your Inventory
You have completed Scope 2 (location-based and market-based, where applicable) plus the Scope 3 Category 3 T&D losses companion — typically representing 30–70% of operational footprint for service-sector and commercial organisations.
The GHG Protocol requires Scope 1 and Scope 2 to be reported as a minimum. Scope 3 (including the Category 3 T&D companion this calculator already produces) is strongly encouraged and is mandatory under CSRD/ESRS E1 for in-scope EU entities.
Methodology Notes and Limitations
Grid factor averaging. National grid factors are averages across all generation supplying the grid in the reporting year. They do not reflect time-of-use variation (the UK grid is far cleaner at 3am than at 7pm), site-specific transmission paths, or marginal generation displaced by a marginal kWh of demand. For organisations pursuing 24/7 carbon-free energy claims, hourly-matched accounting is required — which is outside the scope of this calculator.
Residual mix approximation. Until AIB residual mix data is integrated into MasterBrain, the calculator approximates European residual mix as grid factor × 1.15. This is conservative for most European countries (true residual mix is often higher) and surfaces an audit warning. For high-stakes external disclosures (CSRD, CDP, SBTi target verification), source the AIB published value and enter it as a custom factor.
US sub-region precision. The calculator’s US default is the eGRID national average (0.350 kg CO₂e/kWh). For US sites, regional sub-grid factors (eGRID sub-region codes — CAMX, NYISO, MROW, ERCT, etc.) yield meaningfully higher precision. Enter the sub-region factor in the custom-factor field and document the source.
Steam, heat, and cooling not covered. The calculator covers purchased electricity only. Purchased steam, district heating, and district cooling fall under Scope 2 but require different emission factors (typically supplier-specific) and are outside the scope of this calculator. They will be addressed in a planned Scope 2 Heat & Steam companion calculator.
Instrument additionality not assessed. The calculator does not score whether your declared instruments satisfy SBTi or CDP additionality expectations. Instrument quality is a methodology-notes responsibility, not a calculation responsibility.
No site-specific verification. For regulatory submissions where site-specific accuracy is required, independent verification against utility billing records, sub-meter data, and instrument retirement statements is required. This calculator is a calculation aid, not a measurement system.