
Border Carbon Adjustment · Imported Goods · From 1 January 2027
UK CBAM Calculator — 2027 Carbon Border Adjustment Liability
Estimate the net UK Carbon Border Adjustment Mechanism charge on imported aluminium, cement, fertilisers, hydrogen, and iron & steel from 1 January 2027. Models the UK CBAM as it is actually built — a direct tax on embedded Scope 1 emissions, with carbon price relief capped at the charge, across single-good, consignment, and compare-origin modes.
Liability formula (per line):
Charge = Direct intensity × Quantity × CBAM rate
Carbon price relief = min(Charge, Effective overseas carbon price × Embodied tCO₂e)
Net liability = max(0, Charge − Relief)
The liability is a tax, not a certificate. UK CBAM does not operate a certificate purchase-and-surrender cycle. Liability accrues per import and is settled through an HMRC return across accounting periods — a single full-year first period running 1 January to 31 December 2027, moving to quarterly periods from 2028. This is the structural pivot away from the EU mechanism, and the engine models it exactly: a direct sterling liability, no allowance mechanic, no surrender obligation.
Direct emissions only. UK CBAM charges direct (Scope 1) emissions within UK ETS system boundaries, plus embedded precursor emissions. It does not charge the indirect electricity emissions that the EU mechanism covers. There is no grid emission factor, no MWh input, and no indirect component anywhere in the calculation. The engine reads no grid factors at all.
Liability is floored at zero. Carbon price relief is capped at the charge on every line. Where the overseas effective carbon price exceeds the UK CBAM rate, relief equals the charge and net liability is £0. It never turns negative. The engine computes net = max(0, charge − min(charge, relief)).
Three intensity bases, three confidence tiers. Each line carries a basis — Actual (verified), UK default value, or EU Annex I proxy — and the engine attaches a confidence badge one-to-one with that choice. Precursor emissions may be entered only on the Actual basis; HMRC does not permit actual precursor data where the final good uses a default value, and the engine disables and ignores the field on default and proxy lines.
The proxy intensities are not UK values. The goods dropdown and prefilled intensities are read from the EU CBAM Annex I default emission factors published under Commission Implementing Regulation (EU) 2025/2621. UK default values publish on GOV.UK before 1 January 2027 and do not yet exist. Proxy lines carry a low-confidence badge and an on-screen caveat. See the EU Annex I proxy problem below — this is the single most important limitation of any UK CBAM estimate produced today.
Registration is a separate test. Registration applies once CBAM goods reach £50,000 customs value across a rolling 12 months, or are expected to in the next 30 days. This calculator estimates the charge, not the customs value that triggers registration. It takes no customs value input.
Estimate the UK CBAM liability on a single imported good.
CBAM rate & result view — the £/tCO₂e applied to embodied emissions
Or derive it: CBAM rate = UK ETS avg × (1 − free-allocation factor). The published rate above wins when set.
Enter a CBAM good, its quantity and a rate
Results appear instantly. Your net UK CBAM liability, the charge-minus-relief breakdown, an origin comparison, compliance insights and the full audit trail appear after calculation. UK CBAM is live from 1 January 2027 and charges direct emissions only.
This is an estimation tool for UK CBAM liability, not tax, legal, or accounting advice, and not an HMRC filing figure. UK CBAM is live from 1 January 2027 and charges direct (Scope 1) emissions only (plus precursor emissions) — it does not price indirect / electricity emissions. The CBAM rate is a Government-published quarterly figure and the UK default emission values publish on GOV.UK before launch; both are user-supplied here. Intensities labelled EU Annex I proxy are the EU default values, shown for orientation only. A registered person must use independently verified emissions data (ISO 14065 / ISO 17029) and evidence every carbon-price-relief claim. Registration applies at £50,000 of CBAM goods over 12 months. Verify against HMRC guidance and your adviser before relying on any number.
The UK Carbon Border Adjustment Mechanism goes live on 1 January 2027, and almost every published explanation of it is quietly an explanation of the EU mechanism with the flag swapped. The two schemes share a name and a purpose and almost nothing else. The EU version is a certificate scheme covering direct and indirect emissions. The UK version is a tax covering direct emissions only. If you carry EU intuitions into a UK calculation, you will overstate your liability — sometimes badly, by adding an electricity line that the UK regime does not charge.
There is a second problem, and it is more uncomfortable. The UK has not yet published its default emission values. Every UK CBAM estimate produced before those values land — including the one this calculator produces on its default settings — is running on EU Annex I numbers used as a labelled placeholder. This page explains what that placeholder is worth, where it breaks, and what to do about it.
UK CBAM liability is the good's direct embedded emissions intensity × quantity imported × the CBAM rate in £/tCO2e, less relief for an overseas carbon price already paid, capped at the charge. It covers direct and precursor emissions only.

What UK CBAM is and who it captures
The UK Carbon Border Adjustment Mechanism applies from 1 January 2027 to imports of specified goods in five sectors: aluminium, cement, fertilisers, hydrogen, and iron & steel. It places a carbon price on the emissions embedded in those goods, calibrated to the carbon price faced by equivalent UK production, so that imported goods do not gain a competitive advantage by originating in jurisdictions with weaker carbon pricing.
The five in-scope sectors and their functional units
The functional unit — the physical quantity the emissions intensity is expressed per — is not uniform across sectors. Three sectors price per tonne of the good itself. Cement prices per tonne of clinker. Fertilisers price per tonne of contained nitrogen. This asymmetry is the origin of one of the calculator’s warning states, and it matters commercially: a tonne of cement is not a tonne of clinker, and a tonne of ammonium nitrate is not a tonne of nitrogen.
| Sector | CN coverage | Functional unit | Notable exclusions |
|---|---|---|---|
| Aluminium | 7601–7616 | tonne of good (t) | — |
| Cement | 2507, 2523 | tonne of clinker (t clinker) | — |
| Fertilisers | 2808, 2814, 2834, 3102, 3105 | tonne of nitrogen (t N) | 3105 60 00 |
| Hydrogen | 2804 10 00 | tonne of good (t) | — |
| Iron & steel | Chapter 72 + 2601 12 00 | tonne of good (t) | Ferroalloys (7202), scrap (7204) |
Glass and ceramics were consulted on and are not in scope at launch. Content that lists seven UK CBAM sectors is describing the consultation position, not the finalised design. Ferroalloys and steel scrap are likewise excluded from the iron & steel scope despite falling within Chapter 72’s neighbourhood — scrap in particular, because charging embedded carbon on recycled feedstock would invert the policy intent.
Who is liable
Liability attaches to the person importing the CBAM goods into the UK. The mechanism is administered by HMRC as a tax, and the liable person accounts for it through a return covering an accounting period rather than by acquiring and surrendering instruments at the border. Registration is triggered by customs value, not by emissions — a distinction covered in the registration section below, and one the calculator explicitly does not model.
UK CBAM is a tax, not a certificate scheme
This is the single most consequential difference between the two mechanisms, and it propagates through every part of the calculation. The EU CBAM requires declarants to purchase certificates priced against EU ETS auction prices and surrender them annually against declared embedded emissions. The UK mechanism has no certificate, no surrender cycle, and no instrument to hold. It computes a sterling liability per import and collects it through a return.
Net UK CBAM liability = max(0, Charge − min(Charge, Relief)) — a direct sterling tax, floored at zero, with no certificate to buy and none to surrender.
Liability mechanic
UK: a tax. Liability accrues per import, computed as embedded emissions × the CBAM rate, less carbon price relief. Nothing is purchased.
EU: a certificate scheme. Declarants buy certificates and surrender them against declared embedded emissions.
Payment cycle
UK: an HMRC return across accounting periods. The first period is a single full year, 1 January to 31 December 2027. Quarterly periods follow from 2028.
EU: an annual surrender obligation against certificates held through the year.
Emissions scope
UK: direct (Scope 1) emissions within UK ETS system boundaries, plus embedded precursor emissions. No indirect component.
EU: direct emissions plus indirect (electricity) emissions for goods in scope of the indirect provisions.
The full crosswalk
| Dimension | UK CBAM (from 2027) | EU CBAM |
|---|---|---|
| Instrument | Tax — direct sterling liability | Certificates — purchase and surrender |
| Emissions charged | Direct + embedded precursor | Direct + indirect (electricity) + precursor |
| Sectors at launch | Aluminium, cement, fertilisers, hydrogen, iron & steel (5) | Iron & steel, cement, fertilisers, aluminium, hydrogen, electricity (6) |
| Electricity as a good | Not in scope | In scope as a CBAM good |
| Registration trigger | £50,000 customs value, rolling 12 months or next 30 days | Declarant authorisation regime |
| Overseas carbon price | Carbon Price Relief, capped at the charge | Reduction in certificates to surrender |
| Default values | Publish on GOV.UK before 1 Jan 2027 — not yet available | Annex I, Reg (EU) 2025/2621 — published |
| Negative liability possible? | No — floored at £0 | No — certificate obligation floored at zero |
How the calculation works
Each import line reduces to one multiplication and one capped subtraction:
Charge (£) = Direct intensity (tCO₂e per functional unit) × Quantity (functional units) × CBAM rate (£/tCO₂e)
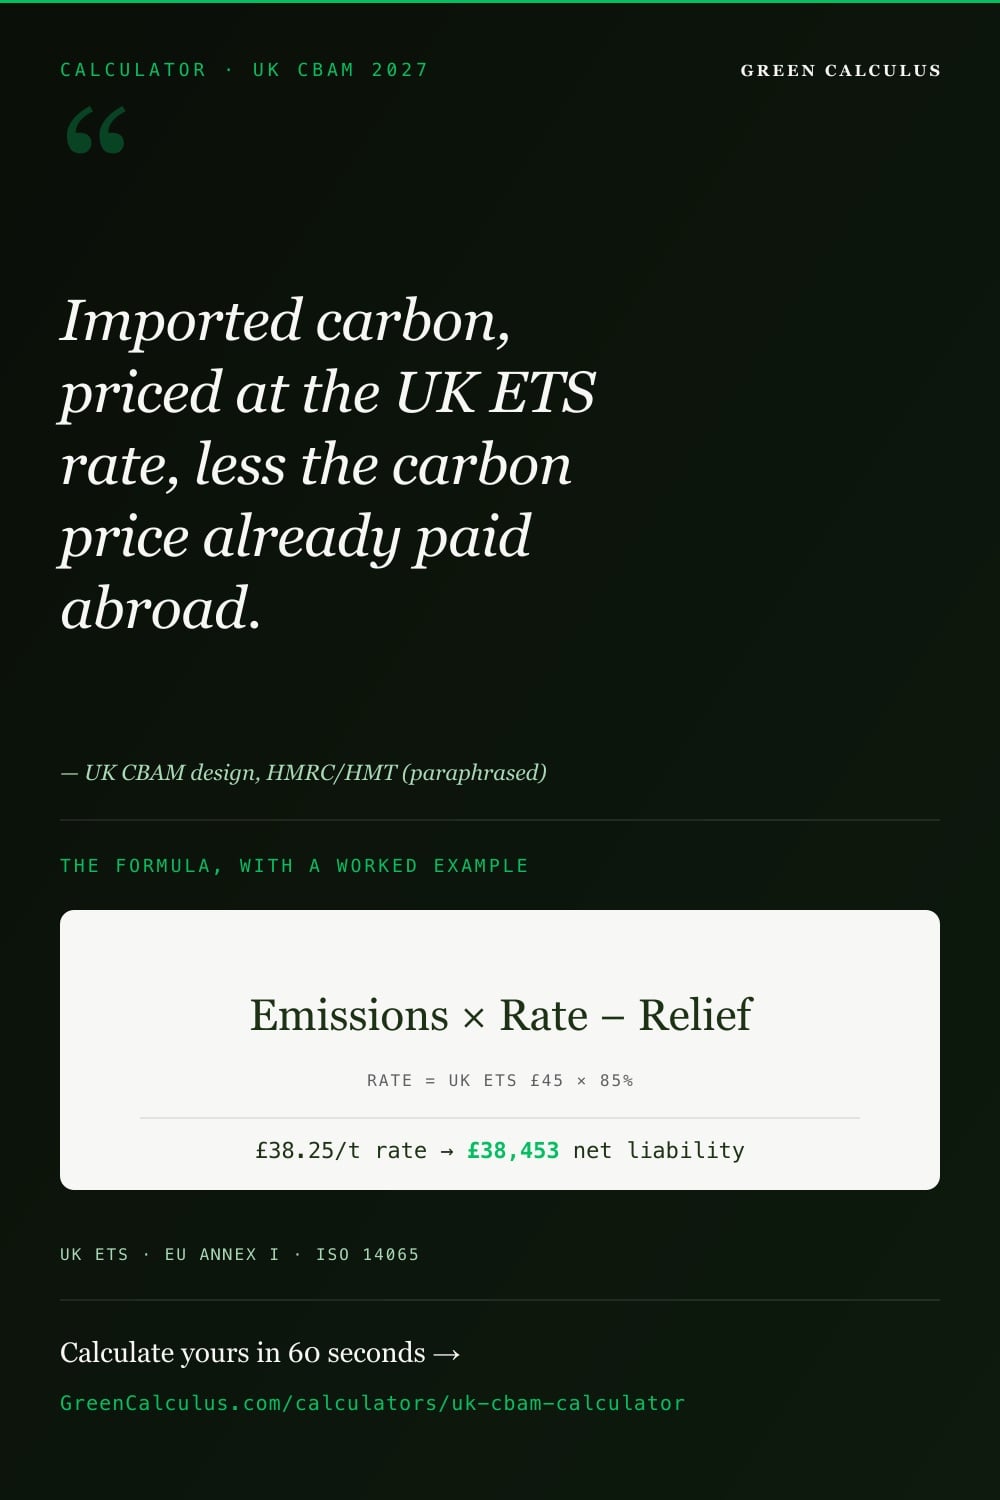
Net liability (£) = max(0, Charge − min(Charge, Effective overseas carbon price × Embodied tCO₂e))
Embodied emissions — the tCO₂e figure the rate is applied to — are the product of the first two terms. Everything else in the calculator exists to determine what goes into those two terms defensibly: which intensity basis you are entitled to use, whether precursor emissions may be added, what the rate is before HMRC publishes one, and what evidence supports a relief claim.
Net liability cannot be negative. Carbon price relief is capped at the charge on every line independently. If the overseas effective carbon price exceeds the UK CBAM rate, relief equals the charge and the line settles at £0 — it does not generate a credit that offsets other lines. The engine implements this as net = max(0, charge − min(charge, relief)), and surfaces a warning when the cap binds on any line.
The three modes
Single good
One line, no add or remove. The default mode. Use it to price a specific CN code from a specific origin at a specific intensity — the shape of most sourcing decisions and most first estimates.
Consignment
Up to twelve lines. Rolls up total charge, total relief, total net liability, total embodied tCO₂e, a per-line breakdown, and a charge → relief → net waterfall. This is the mode that approximates an accounting-period view.
Compare origins
One good across multiple origins. Ranks origins by net liability, surfaces highest and lowest, and reports the spread multiple. Covered in depth in §12 — including why the ranking is less informative than it first appears.
Direct only — why there is no electricity line
UK CBAM charges direct (Scope 1) emissions within UK ETS system boundaries, plus embedded precursor emissions. That is the whole emissions boundary. There is no indirect component, no purchased-electricity term, and no grid emission factor anywhere in the calculation. The calculator reads no grid factors and accepts no MWh input, because there is nothing for them to feed.
This is a deliberate design choice in the UK regime, and it diverges from the EU mechanism, which charges indirect electricity emissions for goods in scope of its indirect provisions. The rationale is boundary consistency: UK CBAM is calibrated against the carbon price faced by a UK producer under the UK ETS, and the UK ETS prices a producer’s direct emissions. Charging an importer for indirect emissions that a domestic competitor is not charged for would over-correct.
The calculator surfaces this as a standing on-screen note, verbatim: “UK CBAM charges direct (Scope 1) emissions only, within UK ETS system boundaries, plus embedded precursor emissions — not the indirect / electricity emissions that EU CBAM covers. Do not add a grid-electricity line.” The most common way to overstate a UK CBAM liability is to import an EU CBAM workflow wholesale and carry the indirect line across. For an aluminium import, where indirect electricity emissions can rival or exceed direct process emissions, this error can more than double the estimate.
Precursors are the only upstream term
Embedded precursor emissions — the direct emissions embedded in an input material that was itself produced upstream, and which the final good’s producer did not emit directly — are the one upstream quantity UK CBAM charges. They are not indirect emissions in the Scope 2 sense. They are direct emissions belonging to a different installation, transmitted into the good through the input material. The distinction is covered in §7, along with the rule that governs when you may claim them.
The three intensity bases and what they cost you
Every line carries an intensity basis, and the basis determines three things simultaneously: the number in the intensity field, the confidence badge attached to the line, and whether you may enter precursor emissions at all. The calculator attaches the badge one-to-one with the basis — unlike the auto-derived five-level score used in financed-emissions accounting, this is a declarative tier, not a derived one.
Actual (verified) — High confidence
Your supplier’s independently verified emissions data for the specific installation and good, verified by an accredited body under ISO 14065 or ISO 17029. This is the only basis on which precursor emissions may be entered. It is also, in almost every case, the basis that produces the lowest defensible number — defaults are constructed to be conservative.
UK default value — Medium confidence
The official UK default emission value for the good, published on GOV.UK. These values do not exist yet; they publish before 1 January 2027. The calculator provides the basis and the entry field so that the moment they land, they can be used. Precursor emissions may not be entered on this basis.
EU Annex I proxy — Low confidence
The EU CBAM Annex I per-country default, prefilled from the reference data as a labelled placeholder for the absent UK default. Editable — and editing a prefilled proxy value does not promote the line, it stays low confidence. Precursor emissions may not be entered. See §6.
| Basis | Evidence required | Confidence badge | Precursors permitted? |
|---|---|---|---|
| Actual (verified) | Verified installation-level emissions data (ISO 14065 / ISO 17029 accredited verifier) | High confidence | Yes — the only basis that permits them |
| UK default value | The published GOV.UK default for the good | Medium confidence | No — field disabled, entered values ignored |
| EU Annex I proxy | None — a placeholder, not a UK regulatory value | Low confidence | No — field disabled, entered values ignored |
The commercial read on this table is that a verification report from your supplier is worth money. Defaults are constructed conservatively — that is their function, since a default that undercut real-world intensities would reward suppliers for withholding data. Every line sitting on a default or proxy basis is, in expectation, paying a premium for the absence of a document. Requesting the carbon-pricing and emissions verification reports from your installation operators is the single highest-leverage action available before 2027.
The EU Annex I proxy problem
This section exists because the calculator’s default state uses numbers that are not UK numbers, and every honest UK CBAM estimate produced before the GOV.UK defaults publish has the same property. It is the most important limitation on this page.
What the proxy is
The goods dropdown and the prefilled direct intensity are populated from EU CBAM Annex I default emission factors, published under Commission Implementing Regulation (EU) 2025/2621. These are per-country, per-CN-code direct emission factors in tCO₂e per tonne of good, covering six origin groupings: China, India, South Korea, Russia, Türkiye, and a catch-all “Other Countries and Territories” for origins not separately listed.
They are real regulatory values. They are simply the wrong regulator’s values. The reference rows carry a scope classification placing them outside the GHG Protocol scopes entirely — they are regulatory-tier CBAM direct-emission defaults, not GHG-Protocol-aligned emission factors, and they should not be reused for Scope 3 accounting.
UK default emission values publish on GOV.UK before 1 January 2027 and are not yet available. The proxy intensities in this calculator are a labelled placeholder, carry a low-confidence badge, and are surfaced with an on-screen caveat: “One or more lines use the EU Annex I proxy intensity (low confidence). It is a placeholder for the UK default — replace it with your independently verified emissions data (ISO 14065 / ISO 17029) or the published UK default value for a defensible number.” No estimate resting on a proxy intensity is a filing figure.
The functional-unit mismatch
The proxy does not merely come from the wrong regulator. For two of the five sectors, it is denominated in the wrong unit. The EU Annex I values are expressed per tonne of good throughout. UK CBAM prices cement per tonne of clinker and fertilisers per tonne of contained nitrogen. Dropping an EU per-tonne-of-good intensity into a UK per-tonne-of-clinker field is a units error, not an approximation — and its magnitude depends entirely on the clinker content or nitrogen content of the specific good, which the calculator does not know.
The engine detects and flags this case, verbatim: “A cement or fertiliser line uses the proxy on a mismatched functional unit — UK CBAM prices cement per tonne of clinker and fertiliser per tonne of nitrogen (N), while the proxy is per tonne of good. Convert the intensity to the UK basis.” Cement and fertilisers are the only two sectors where this fires, because they are the only two where the UK functional unit diverges from the EU proxy’s basis — the same fact recorded in the sector table, viewed from the other side. Aluminium, hydrogen, and iron & steel all price per tonne of good under both regimes, so the proxy is at least dimensionally coherent for those three.
What follows from this
Three consequences, in descending order of how uncomfortable they are.
- Any number this calculator produces on proxy intensities is an order-of-magnitude orientation, not a liability estimate. It tells you whether you are looking at a four-figure or a six-figure exposure. It does not tell you what you will owe.
- The proxy’s per-country variation is EU-derived and carries no UK regulatory weight. Russia’s iron ore default is not high because HMRC has determined Russian iron ore is carbon-intensive. It is high because the European Commission determined so, for EU purposes, under a different methodology. Which leads directly to §12, where that variation drives a 15.7× spread across origins — and where that spread turns out to mean something quite different from what it appears to mean.
- The remedy is not a better default. It is a verification report. Verified actual emissions data outranks every default in both confidence and, usually, magnitude. It is also the only basis that lets you claim precursor emissions and the only basis that supports a carbon price relief claim.
Precursor emissions and the HMRC actual-data rule
Precursor emissions are the direct emissions embedded in an input material used to produce the final good — the emissions from producing the pig iron that went into the steel, or the ammonia that went into the fertiliser. UK CBAM charges them. They are frequently the dominant term for downstream goods in iron & steel and aluminium, where the final processing step is far less carbon-intensive than the production of its inputs.
Precursor emissions may be entered only where the final good’s intensity is on the Actual (verified) basis. HMRC does not permit actual precursor data to be combined with a default or proxy intensity for the final good — the default is constructed to represent the good’s full embedded emissions, and adding precursors on top would double-count. The calculator disables the precursor field on default and proxy lines, and silently ignores any value already entered there.
The engine reports this rather than failing silently, verbatim: “Precursor emissions were ignored on a line that uses a default/proxy intensity — HMRC does not allow actual precursor data when the final good uses a default value. Switch that line to Actual (verified) to include precursors.” The fourth line of the worked example below demonstrates exactly this — a 40 tCO₂e precursor figure entered against a UK-default fertiliser line, and dropped.
The asymmetry is worth sitting with. A verified line lets you add precursors, which increases the charge. A default line forbids them, which does not decrease it — the default is already meant to have swallowed them. The verified basis is not a loophole; it is a route to an accurate number that happens, on average, to be lower.
Deriving the CBAM rate before published rates exist
The CBAM rate is the sterling carbon price per tonne of embedded CO₂e applied to the charge. HMRC publishes it quarterly, and published rates begin in Q1 2027. Before then — and for any estimate that reaches forward past the current quarter — the rate has to be derived.
CBAM rate (£/tCO₂e) = UK ETS average auction price (£/tCO₂e) × (1 − free-allocation factor)
The free-allocation factor accounts for the fact that a UK producer does not pay the full ETS price on every tonne. UK ETS free allocation reduces the effective carbon price faced by domestic industry, and CBAM is calibrated to that effective price rather than the headline auction price — otherwise imports would face a carbon cost that no domestic competitor bears. The UK free-allocation adjustment is derived by HMRC from UK ETS baselines and differs from the EU phase-down schedule. It is not a published lookup the calculator can read; it is a user input, clamped between zero and one.
Multiplying embedded tonnes by the raw UK ETS spot price is the second-most-common way to overstate a UK CBAM estimate, after adding an indirect line. The headline price is not the effective price. In the worked example below, a £45/tCO₂e ETS average and a 15% free-allocation factor produce a CBAM rate of £38.25/tCO₂e — a 15% reduction that compounds across every line in the consignment.
When no rate is supplied and no derivation inputs are given, the calculator prompts rather than guessing, verbatim: “No CBAM rate supplied — enter the Government-published quarterly rate (£/tCO₂e), or the UK ETS average auction price and free-allocation factor to derive it. Published rates begin Q1 2027.” When a rate is derived, it says so, and tells you to replace it: “CBAM rate £X/tCO₂e is derived as UK ETS avg £Y/tCO₂e × (1 − Z% free allocation). Replace it with the official quarterly rate for a filing estimate.”
The reference data does contain a UK ETS carbon price. The calculator deliberately does not use it. The available figure is a US dollar spot price, and the CBAM rate requires a sterling quarterly auction average — a different currency and a different statistic. Substituting one for the other would produce a number that looks authoritative and is wrong, which is worse than a blank field.
Carbon price relief — the overseas carbon price adjustment
Where a carbon price has already been paid on the good’s emissions in the country of production, UK CBAM grants Carbon Price Relief against the charge. The mechanism prevents double-pricing of the same tonne and is the primary reason a UK CBAM liability can be materially lower than a naive intensity × quantity × rate calculation suggests.
Carbon Price Relief (£) = min(Charge, Effective overseas carbon price (£/tCO₂e) × Embodied emissions (tCO₂e))
The evidence requirement
Relief is not claimed on the basis of a jurisdiction operating a carbon price. It is claimed on the basis of the specific installation’s effective carbon price, evidenced by a completed carbon-pricing verification report on the HMRC template, produced by the installation operator and verified by a body accredited under ISO 17029 or ISO 14065. The effective price is derived through a defined six-step calculation net of free allocation and rebates — the price the installation actually bore, not the headline rate of the scheme it participates in. It is converted to sterling at the HMRC quarterly exchange rate.
Relief is capped at the charge, per line, independently. Where the overseas effective carbon price meets or exceeds the UK CBAM rate, relief equals the charge and net liability on that line is £0. It does not become negative, and it does not generate a credit that offsets other lines. The calculator flags the binding cap, verbatim: “Carbon price relief was capped at the CBAM charge on at least one line — the overseas price entered exceeds the UK rate, so relief cannot exceed the charge and liability is floored at £0. It never turns negative.”
The calculator surfaces an indicative headline carbon price for Chinese and South Korean origins as a per-line note, drawn from reference data. That note is contextual only and never enters the calculation — the relief figure is always the effective installation-level price you enter, supported by the verification report. A national scheme’s headline price is not evidence of what any particular installation paid.
Registration threshold and the liable-person test
Two questions sit behind any UK CBAM enquiry, and they have different answers. What will I owe? is answered by the calculation above. Do I have to register at all? is answered by a threshold test that the calculation does not touch.
Registration applies once CBAM goods reach £50,000 in customs value across a rolling 12-month period, or are expected to reach it within the next 30 days. Either test triggers the obligation. The figure was raised from the £10,000 proposed at consultation.
The threshold is measured on customs value, not on embedded emissions and not on CBAM liability. A consignment of low-intensity aluminium can breach £50,000 in customs value while attracting a modest charge; a consignment of high-intensity iron ore can attract a substantial charge while sitting below the threshold. This calculator takes no customs value input and therefore cannot tell you whether you must register. It says so on screen, verbatim: “Registration applies once CBAM goods reach £50,000 customs value over a rolling 12 months (or expected in the next 30 days). This tool estimates the charge, not the customs value that triggers registration.”
The forward-looking limb deserves particular attention because it is easy to overlook. An importer with no CBAM history who signs a contract for a single large delivery may be required to register before the goods arrive, on the basis of expected customs value over the following 30 days. The rolling-12-month limb catches the opposite pattern — many small imports accumulating past the threshold without any single consignment approaching it.
Worked example — a four-line consignment
This example reproduces exactly against the live calculator. Reproduce it in Consignment mode with a UK ETS average auction price of £45/tCO₂e and a free-allocation factor of 0.15, producing a derived CBAM rate of £38.25/tCO₂e. The four lines span all three intensity bases, both functional-unit conventions, a binding relief cap, and an ignored precursor entry — the four mechanics most likely to be got wrong.
Inputs
| Line | Sector · CN code | Basis | Origin | Direct intensity | Quantity | Precursor | Relief price | Confidence |
|---|---|---|---|---|---|---|---|---|
| 1 | Iron & steel · 2601 12 00 Agglomerated iron ores | EU Annex I proxy | China | 0.2 tCO₂e/t | 500 t | Disabled | — | Low |
| 2 | Aluminium · 7601 Unwrought aluminium | Actual (verified) | Other | 1.514 tCO₂e/t | 200 t | Enabled | £30/tCO₂e | High |
| 3 | Cement · 2507 00 80 Calcined clay | EU Annex I proxy | Türkiye | 0.21 tCO₂e/t clinker | 1,000 t clinker | Disabled | — | Low |
| 4 | Fertilisers · 2808 00 00 Nitric acid | UK default value | Other | 2.10 tCO₂e/t N | 300 t N | 40 tCO₂e — ignored | — | Medium |
Line-by-line result
| Line | Embodied tCO₂e | Charge | Carbon price relief | Net liability | Share of net |
|---|---|---|---|---|---|
| 1 · Iron & steel | 100 | £3,825 | −£0 | £3,825 | 9.9% |
| 2 · Aluminium | 302.8 | £11,582 | −£9,084 | £2,498 | 6.5% |
| 3 · Cement | 210 | £8,033 | −£0 | £8,033 | 20.9% |
| 4 · Fertilisers | 630 | £24,098 | −£0 | £24,098 | 62.7% |
| Total | 1,243 | £47,537 | −£9,084 | £38,453 | 100.0% |
The metric strip
Reading the result
The fertiliser line accounts for 62.7% of net liability from a single 300-tonne entry, because nitric acid carries a high intensity per tonne of contained nitrogen and receives no relief. The aluminium line — the largest gross charge after fertilisers, at £11,582 — settles at £2,498 because a £30/tCO₂e overseas carbon price, evidenced and verified, absorbs £9,084 of it. That one line generates 100% of the consignment’s relief. The two proxy lines, iron & steel and cement, contribute £11,858 of net liability on intensities that are not UK values.
Which is the uncomfortable reading of this table. Of £38,453 in estimated net liability, £11,858 rests on EU Annex I placeholders, and £8,033 of that sits on a cement line whose proxy intensity is denominated per tonne of good while the calculation requires per tonne of clinker. The single most valuable action available to this importer is not renegotiating a contract. It is obtaining a verification report for line 3.
Display rounding. Two labels in the audit output round for display while the engine computes on unrounded values. The CBAM rate label reads £38.3/tCO₂e but the arithmetic runs on £38.25 — which is why line 1 shows 100 × £38.3 = £3,825, not £3,830. The line 2 intensity label reads 1.51 tCO₂e/t while the embodied figure of 302.8 tCO₂e derives from the entered 1.514. The charges and embodied figures are the true values; only the labels round. Do not reconstruct the arithmetic from the rounded labels.
Comparing origins — where the liability actually comes from
Compare-origins mode prices one good across every available origin and ranks the result. Run against agglomerated iron ores, CN 2601 12 00, at 500 tonnes with no relief and the same derived £38.25/tCO₂e rate, it produces the single most striking output the calculator generates — and the most easily misread.
| Origin | Default intensity | Embodied tCO₂e | Net liability |
|---|---|---|---|
| Russia | 1.57 tCO₂e/t | 785 | £30,026 |
| Other Countries and Territories | 0.617 tCO₂e/t | 308.5 | £11,800 |
| India | 0.29 tCO₂e/t | 145 | £5,546 |
| China | 0.2 tCO₂e/t | 100 | £3,825 |
| Türkiye | 0.18 tCO₂e/t | 90 | £3,443 |
| South Korea | 0.1 tCO₂e/t | 50 | £1,913 |
Relief does not change the ranking
An intuition worth killing before it takes hold: that a high-liability origin has more room to absorb carbon price relief before the cap binds, and that relief therefore compresses the spread. It does not, and the reason is structural rather than empirical.
Relief is entered per tonne of embodied CO₂e — the same basis as the charge. So for every origin, net liability is embodied emissions multiplied by max(0, rate − relief). Both terms scale linearly with embodied emissions, so the ratio between any two origins reduces to the ratio of their intensities, invariant to relief. Either nobody’s relief caps, or everybody’s caps to £0 simultaneously.
| Origin (intensity) | Relief £0/tCO₂e | Relief £20/tCO₂e | Relief £45/tCO₂e |
|---|---|---|---|
| Russia (1.57) | £30,026 | £14,326 | £0 |
| Other (0.617) | £11,800 | £5,630 | £0 |
| India (0.29) | £5,546 | £2,646 | £0 |
| China (0.2) | £3,825 | £1,825 | £0 |
| Türkiye (0.18) | £3,443 | £1,643 | £0 |
| South Korea (0.1) | £1,913 | £913 | £0 |
| Spread | 15.7× | 15.7× | all £0 |
The spread is identical at £0 and £20 to every decimal place. At £45 — above the £38.25 rate — every line caps and settles at zero. Relief shaves the same proportion off every origin and reorders nothing.
What the spread actually measures
The 15.7× spread is a property of the EU Annex I proxy intensities, not of the origins. It ranks countries on numbers that were never computed for the UK regime, under a different methodology, for a different regulator’s purposes. Every figure in the ranking table carries a low-confidence badge. Switch the Russian line to verified actual emissions data and its position can collapse — a modern electric-arc route in a high-intensity jurisdiction will beat a default-rated one in a low-intensity jurisdiction. The spread exists because nobody has UK numbers yet, and it dissolves the moment a real figure replaces a proxy.
The only lever that moves this ranking is data quality. Not relief, which is provably neutral. Not origin, except insofar as origin is currently a proxy for a proxy. Read the ranking as a prioritisation of where to go and obtain verified emissions data first, not as a procurement recommendation. An importer who reshores a supply chain on the strength of this table has made a consequential commercial decision on the basis of a placeholder — which is precisely the failure mode §6 exists to prevent.
Audit checklist — what HMRC will challenge
UK CBAM is administered as a tax, which means the assurance posture is an HMRC compliance check rather than a voluntary-standard assurance engagement. The eight findings below are the ones the calculator’s own warning set anticipates, and they map to the mechanics most often carried across incorrectly from EU CBAM workflows.
01 — An indirect / electricity line included
UK CBAM charges direct emissions within UK ETS system boundaries plus embedded precursors. There is no indirect component. An importer who carries an EU CBAM electricity term into a UK calculation overstates liability — materially so for aluminium, where indirect emissions can rival direct process emissions.
02 — EU Annex I proxy intensities presented as UK defaults
The proxy is a placeholder. UK default values publish on GOV.UK before 1 January 2027 and are not the same numbers, derived under the same methodology, for the same purpose. Presenting a proxy-based figure as a filing estimate misrepresents its evidential status.
03 — Functional-unit mismatch on cement or fertilisers
UK CBAM prices cement per tonne of clinker and fertilisers per tonne of contained nitrogen. The EU proxy is denominated per tonne of good. Using the proxy value directly against a UK functional unit is a units error whose magnitude depends on clinker or nitrogen content — a quantity the calculator does not know and cannot infer.
04 — Precursor emissions claimed against a default intensity
HMRC does not permit actual precursor data where the final good uses a default or proxy value; the default is constructed to represent full embedded emissions. The calculator disables the field and ignores entered values, but a spreadsheet methodology will happily add them, double-counting the precursor term.
05 — Headline UK ETS price used as the CBAM rate
The CBAM rate is the UK ETS average auction price reduced by the free-allocation factor, because domestic producers do not bear the full ETS price on every tonne. Using the headline price overstates the rate — 15% in the worked example, compounding across every line.
06 — Carbon price relief claimed on a jurisdiction’s headline rate
Relief attaches to the installation’s effective carbon price, net of free allocation and rebates, derived through the defined six-step calculation and evidenced by a verification report from an accredited body. A national scheme’s published price is not evidence of what any particular installation paid.
07 — Relief treated as capable of producing a credit
Relief is capped at the charge on each line independently. Where the overseas effective price exceeds the UK rate, the line settles at £0 — it does not generate surplus relief that offsets other lines, and net liability never turns negative. Spreadsheet models that net relief across a consignment before flooring will understate liability.
08 — Registration assessed on emissions rather than customs value
The £50,000 threshold is measured on customs value of CBAM goods, on a rolling 12-month backward test and a 30-day forward test, either of which triggers registration. A low-emissions, high-value consignment can breach it; a high-emissions, low-value one may not. Liability estimates say nothing about registration.
Reporting context — UK CBAM, EU CBAM, UK ETS, Scope 3
UK CBAM liability is a tax computation, not a greenhouse gas inventory line. It shares vocabulary with corporate GHG accounting and almost nothing else, and the two must not be reconciled to each other.
| Regime | Relationship to UK CBAM | Emissions boundary |
|---|---|---|
| UK CBAM | The regime itself. A tax on embedded direct emissions in imported goods from 1 January 2027. | Direct (Scope 1 equivalent) within UK ETS boundaries + embedded precursors |
| UK ETS | The calibration reference. The CBAM rate derives from UK ETS auction prices net of free allocation, so that imports face the effective domestic carbon price. | Direct emissions of covered UK installations |
| EU CBAM | The parallel regime. Different instrument (certificates), broader boundary (indirect emissions), broader sector list (electricity). Its Annex I defaults serve as the UK calculator’s interim proxy. | Direct + indirect (electricity) + precursors |
| EU ETS | The calibration reference for EU CBAM certificate pricing. Not relevant to UK CBAM rate derivation. | Direct emissions of covered EU installations |
| GHG Protocol Scope 3 | Unrelated accounting layer. Purchased goods appear in Category 1 of a corporate inventory. CBAM embedded emissions are not Category 1 factors and must not be reused as such. | Value-chain emissions across fifteen categories |
The CBAM reference intensities carry a scope classification placing them outside the GHG Protocol scopes entirely. They are regulatory-tier direct-emission defaults for border-adjustment declaration, constructed conservatively for that purpose. Reusing them as Scope 3 Category 1 emission factors imports a deliberate conservatism bias into a corporate inventory and misattributes the source. Spend-based Category 1 estimation uses an entirely different factor family — see the Scope 3 Category 1 Spend-Based Calculator. A tonne of steel does not have one embedded-carbon number; it has a CBAM number and a Scope 3 number, computed for different purposes under different rules.
Data sources, factor versioning, and update transparency
What the calculator reads
The calculator consumes exactly one family of reference data: the EU CBAM Annex I per-country default emission factors published under Commission Implementing Regulation (EU) 2025/2621, covering six origin groupings across the CN codes in scope. These populate the goods dropdown and prefill the proxy intensity. Every other quantity in the calculation — the CBAM rate, the free-allocation factor, actual and UK-default intensities, precursor emissions, quantities, and the overseas effective carbon price — is user-entered.
| Quantity | Source | Enters the calculation? |
|---|---|---|
| Proxy direct intensity, goods list | EU CBAM Annex I, Reg (EU) 2025/2621 | Yes — as a labelled low-confidence placeholder |
| CBAM rate | User-entered, or derived from user-entered ETS average × (1 − free-allocation factor) | Yes |
| UK ETS reference carbon price | Reference data (US dollar spot price) | No — wrong currency, wrong statistic; deliberately unread |
| Indirect / grid emission factors | Present in reference data (EU reporting relic) | No — UK CBAM is direct-only; no path exists |
| EU free-allocation phase-down schedule | Present in reference data (EU-specific) | No — the UK adjustment differs and is user-entered |
| Indicative overseas carbon price (China, South Korea) | Reference data | No — surfaced as a contextual per-line note only |
Degradation behaviour
When the reference data is unavailable, the calculator does not substitute fallback intensities. The goods dropdown and proxy prefill empty, and the calculator says so: “MasterBrain V3 is unavailable — the EU Annex I reference proxies and goods list could not load. You can still compute with your own intensity and rate; reload to restore the reference data.” The Actual and UK-default entry paths and the entire calculation remain functional. Nothing is fabricated to fill the gap — which is the correct behaviour for a tax estimator, where a silently invented intensity is worse than a blank field.
Versioning
Results are stamped with the reference-data version against which they were computed, so an estimate produced against one vintage and the same estimate produced against a later one are distinguishable. UK default emission values publish on GOV.UK before 1 January 2027; when they do, they will be added as a distinct reference family and the UK-default basis will draw from it rather than requiring manual entry. The proxy basis will remain, labelled as such, for goods and origins the UK defaults do not cover.
Frequently asked questions
1 January 2027, across five sectors: aluminium (CN 7601–7616), cement (2507, 2523), fertilisers (2808, 2814, 2834, 3102, 3105, excluding 3105 60 00), hydrogen (2804 10 00), and iron & steel (Chapter 72 plus 2601 12 00, excluding ferroalloys under 7202 and scrap under 7204). Glass and ceramics were consulted on and are not in scope at launch — any source listing seven sectors is describing the consultation position rather than the finalised design.
Three structural differences. First, instrument: the UK mechanism is a tax settled through an HMRC return, with no certificates to purchase and none to surrender. Second, boundary: UK CBAM charges direct (Scope 1) emissions within UK ETS system boundaries plus embedded precursor emissions, and does not charge the indirect electricity emissions that EU CBAM covers. Third, scope: the EU covers electricity as a CBAM good; the UK does not. The practical consequence is that an EU CBAM workflow applied to a UK import will overstate liability, because it carries an indirect line the UK regime does not charge.
No. UK CBAM charges direct emissions within UK ETS system boundaries plus embedded precursor emissions. There is no indirect component, no purchased-electricity term, and no grid emission factor anywhere in the calculation. Do not add a grid-electricity line. The calculator reads no grid factors and accepts no MWh input, because there is nothing for them to feed. For aluminium in particular — where indirect electricity emissions can rival or exceed direct process emissions — carrying an EU-style indirect line across can more than double the estimate.
No. Carbon price relief is capped at the charge on each line independently, so net liability is floored at £0 and never turns negative. Where the overseas effective carbon price exceeds the UK CBAM rate, relief equals the charge and the line settles at zero — it does not generate surplus relief that offsets other lines in the consignment. The engine computes net liability as max(0, charge − min(charge, relief)) and warns when the cap binds.
Derive it as the UK ETS average auction price multiplied by one minus the free-allocation factor. Published quarterly rates begin in Q1 2027. The free-allocation adjustment reflects the fact that UK producers do not pay the full ETS price on every tonne, so CBAM is calibrated to the effective domestic carbon price rather than the headline auction price. Using the raw ETS spot price as the CBAM rate is a common and material error — in the worked example, a £45/tCO₂e ETS average with a 15% free-allocation factor produces a £38.25/tCO₂e CBAM rate, a 15% reduction compounding across every line.
No, and this is the most important caveat on the page. UK default emission values publish on GOV.UK before 1 January 2027 and do not yet exist. The prefilled intensities are EU CBAM Annex I per-country defaults, published under Commission Implementing Regulation (EU) 2025/2621, used as a labelled placeholder. They carry a low-confidence badge and an on-screen caveat. They are real regulatory values from the wrong regulator, derived under a different methodology for a different purpose. No estimate resting on a proxy intensity is a filing figure — replace it with independently verified emissions data or the published UK default when available.
Because UK CBAM prices cement per tonne of clinker and fertilisers per tonne of contained nitrogen, while the EU Annex I proxy values are denominated per tonne of good throughout. Cement and fertilisers are the only two of the five sectors where the UK functional unit diverges from the proxy’s basis — aluminium, hydrogen, and iron & steel all price per tonne of good under both regimes. Dropping a per-tonne-of-good proxy value into a per-tonne-of-clinker field is a units error, not an approximation, and its magnitude depends on the clinker or nitrogen content of the specific good, which the calculator does not know.
Only where the final good’s intensity uses the Actual (verified) basis. HMRC does not permit actual precursor data to be combined with a default or proxy intensity, because the default is constructed to represent the good’s full embedded emissions and adding precursors on top would double-count. The calculator disables the precursor field on default and proxy lines and ignores any value entered there, reporting that it has done so. This asymmetry means the verified basis lets you add precursors while the default basis forbids them — the verified route is not a loophole, it is a route to an accurate number that happens on average to be lower.
Relief equals the installation’s effective overseas carbon price multiplied by embodied emissions, capped at the CBAM charge. Evidence is a completed carbon-pricing verification report on the HMRC template, produced by the installation operator and verified by a body accredited under ISO 17029 or ISO 14065. The effective price is derived through a defined six-step calculation net of free allocation and rebates, then converted to sterling at the HMRC quarterly exchange rate. A jurisdiction operating a carbon price is not sufficient — relief attaches to what the specific installation actually bore, not to the headline rate of the scheme it participates in.
Registration applies once CBAM goods reach £50,000 in customs value across a rolling 12-month period, or are expected to within the next 30 days — either test triggers the obligation. The threshold is measured on customs value, not on embedded emissions and not on CBAM liability, so this calculator cannot tell you whether you must register. It takes no customs value input. A low-intensity, high-value consignment can breach the threshold while attracting a modest charge, and the reverse is equally possible.
The question has a tempting answer and a correct one. On EU Annex I proxy intensities, agglomerated iron ore at 500 tonnes ranges from £1,913 (South Korea, 0.1 tCO₂e/t) to £30,026 (Russia, 1.57 tCO₂e/t) — a 15.7× spread. But that spread is a property of the proxy values, not of the origins. It ranks countries on numbers computed for the EU, under a different methodology, that carry no UK regulatory weight; every figure in the ranking carries a low-confidence badge. Verified actual emissions data from a specific installation can invert the ranking entirely — a modern low-carbon route in a high-intensity jurisdiction beats a default-rated one in a low-intensity jurisdiction. Read the ranking as a prioritisation of where to obtain verified data first, not as a procurement recommendation.
No, and the reason is structural. Relief is entered per tonne of embodied CO₂e, the same basis as the charge, so net liability for every origin is embodied emissions multiplied by max(0, rate − relief). Both terms scale linearly with embodied emissions, so the ratio between any two origins reduces to the ratio of their intensities and is invariant to relief. Either no origin’s relief caps, or every origin caps to £0 simultaneously when relief reaches the rate. In the compare example the spread is 15.7× at zero relief and 15.7× at £20/tCO₂e relief, to every decimal place. A high-liability origin does not have more room to absorb relief before capping — the per-tonne basis removes that effect entirely.
No. CBAM reference intensities carry a scope classification placing them outside the GHG Protocol scopes entirely — they are regulatory-tier direct-emission defaults for border-adjustment declaration, constructed conservatively for that purpose. Reusing them as Scope 3 Category 1 emission factors imports a deliberate conservatism bias into a corporate inventory and misattributes the source. A tonne of steel does not have one embedded-carbon number; it has a CBAM number and a Scope 3 number, computed for different purposes under different rules. Spend-based Category 1 estimation uses an entirely different factor family.
Methodology notes and limitations
Regulatory basis. The calculator implements UK CBAM as finalised in Government policy documentation ahead of its 1 January 2027 commencement. Sector scope, CN coverage, functional units, the £50,000 registration threshold, the tax-not-certificate instrument design, and the Carbon Price Relief mechanism are drawn from published policy rather than from the enacting legislation. Verify against the statutory instrument before relying on any figure for a filing.
Default values are not UK values. The prefilled proxy intensities are EU CBAM Annex I per-country defaults published under Commission Implementing Regulation (EU) 2025/2621, used as a labelled placeholder because UK default emission values publish on GOV.UK before 1 January 2027 and do not yet exist. Proxy lines carry a low-confidence badge. This is a limitation of the present state of the regime, not of the calculator, and it applies equally to every UK CBAM estimate produced today.
Functional-unit conversion is the user’s responsibility. Where a proxy intensity is used for cement or fertilisers, the value is denominated per tonne of good while UK CBAM requires per tonne of clinker or per tonne of contained nitrogen respectively. The calculator flags the mismatch and does not convert. Conversion requires the clinker content or nitrogen content of the specific good, which is producer-specific information the calculator does not hold.
Direct emissions only. The calculator implements no indirect or electricity component, reads no grid emission factors, and accepts no MWh input, because UK CBAM charges direct emissions within UK ETS system boundaries plus embedded precursors. Estimates produced by importing an EU CBAM methodology, which includes indirect emissions, will not reconcile to this calculator and will be too high.
The CBAM rate is user-supplied. The rate is entered directly or derived on screen as the UK ETS average auction price multiplied by one minus the free-allocation factor, both user inputs. The UK free-allocation adjustment is derived by HMRC from UK ETS baselines, differs from the EU phase-down schedule, and is not a published lookup. The calculator does not read any carbon price from reference data for this purpose, deliberately: the available reference price is a US dollar spot value, and the CBAM rate requires a sterling quarterly auction average.
Relief is capped, never netted. Carbon price relief is capped at the charge on each line independently. Net liability is floored at £0 and never turns negative. Surplus relief on one line does not offset another line’s charge. Estimates that net relief across a consignment before applying the floor will understate liability.
Registration is not modelled. The £50,000 threshold is measured on customs value of CBAM goods, on a rolling 12-month backward test and a 30-day forward test. The calculator takes no customs value input and estimates the charge only. It cannot determine whether a registration obligation exists.
Display rounding. Certain labels round for display while the calculation runs on unrounded values — the CBAM rate label shows one decimal place while the arithmetic uses the full value, and intensity labels round to the engine’s magnitude-aware precision. Charges and embodied-emissions figures are the true computed values. Arithmetic reconstructed from rounded labels will not tie.
Not a filing figure. Results are estimates. They do not constitute a CBAM return, a liability determination, or tax advice, and should be reviewed by a qualified customs or indirect-tax practitioner before use in any HMRC submission. For a defensible figure, every line should rest on independently verified emissions data from an accredited verifier, the published quarterly CBAM rate, and installation-specific carbon price relief supported by a verification report. CBAM embedded emissions are not GHG Protocol Scope 3 emission factors and must not be reused as such.