
Ecommerce Shipping Emissions Calculator | Parcel & Last-Mile Carbon Footprint (GLEC / ISO 14083)
Compute the Scope 3 carbon footprint of shipping sold products to customers — line-haul, last-mile, and returns — using GLEC Framework tonne-kilometre factors for line-haul and DEFRA 2026 vehicle factors for last-mile, reported as well-to-wheel CO₂e.
This calculator uses a two-tier activity method — not a single per-parcel factor. Ecommerce shipping has no defensible one-number lookup: emissions depend on how far each parcel travels, by what mode, how heavy it is, and how many other parcels share the delivery van. The engine composes each shipping profile from two independently-sourced tiers, then adds returns.
Tier 1 — Line-haul (mass × distance × intensity, well-to-wheel):
Emissions (kg CO₂e) = parcel mass (tonnes) × line-haul distance (km) × mode intensity (kg CO₂e/tonne-km).
Line-haul intensities are GLEC Framework v3.2
well-to-wheel factors, weighted at AR6 GWP-100. Ground uses a region × vehicle-profile × fuel cascade
(for example a 34–40 t articulated diesel truck at 0.101 kg CO₂e/tonne-km); air uses an aircraft-configuration
× haul cascade (belly-hold long-haul at 0.936 kg CO₂e/tonne-km). Line-haul uses actual parcel mass —
chargeable/volumetric weight is shown as billing context only and never inflates the emission.
Tier 2 — Last-mile (vehicle-km ÷ drops, tank-to-wheel + well-to-tank):
Per-parcel last-mile (kg CO₂e) = (route distance ÷ drops per route) × delivery-van factor.
Last-mile uses DEFRA 2026 delivery-van factors — an average diesel van is 0.31844 kg CO₂e/vehicle-km
well-to-wheel (0.25716 tank-to-wheel + 0.06128 well-to-tank),
weighted at AR5 GWP-100 per the DEFRA convention. The route’s van-kilometres are divided across the
number of parcels dropped, so denser routes allocate less per parcel.
Returns: a returned parcel travels the journey again in reverse, so returns are modelled as a symmetric reverse leg: returns emissions = outbound emissions × return rate. A profile with a 15% return rate carries 15% of its outbound line-haul-plus-last-mile again.
Mixed GWP basis — disclosed, never blended. Line-haul (GLEC) is AR6 GWP-100; last-mile (DEFRA) is AR5 GWP-100. The engine reports the two tiers on their native bases and labels the hero accordingly (AR6, or Mixed AR5/AR6) rather than re-weighting one to match the other — there is no defensible reweight for an already-aggregated CO₂e factor. This asymmetry is by design, consistent with the DEFRA emission-factor convention, and is not an error.
Scope boundary: Scope 3 Category 9 (Downstream Transportation & Distribution) — the merchant-of-record shipping the sold product to the consumer, plus the customer returns leg. DEFRA tags its delivery-van factor as Scope 1 own-vehicle; the engine reclassifies it to Scope 3 Category 9 because the merchant contracts the downstream delivery rather than operating the van — a documented reclassification. Excluded: inbound supplier→warehouse transport (Category 4, upstream), warehousing energy, packaging embodied carbon, and sea and rail line-haul (different activity bases — routed to the dedicated freight calculators below).
Line-haul: GLEC Framework v3.2 (tonne-km, well-to-wheel · AR6). Last-mile: DEFRA 2026 delivery vehicles (vehicle-km, tank-to-wheel + well-to-tank companion · AR5). Reads MasterBrain V3 live. Sea & rail line-haul use the dedicated sibling calculators (TEU-km / commodity basis).
Set your shipping profiles and order volume, then Calculate
Results appear with a line-haul / last-mile / returns split, per-order intensity, per-profile breakdown, data-quality scoring, an optimisation scenario, audit trail and export.
Results are indicative and for organisational greenhouse-gas accounting under the GHG Protocol Scope 3 Standard (Category 9, Downstream Transportation & Distribution). GLEC Framework v3.2 line-haul intensities are well-to-wheel (AR6 GWP-100); DEFRA 2026 last-mile factors are tank-to-wheel with a separately-published well-to-tank companion (AR5 GWP-100), allocated per parcel by drop density. GLEC freight CO₂e is published as an aggregate with no per-gas decomposition. This tool models the parcel journey from data you enter; it is not a live carrier or Shopify integration. Verify boundary, allocation, distance and drop-density assumptions against your carrier data before external reporting; for assured disclosure obtain third-party verification under ISO 14064-3.
Most ecommerce brands quote a single tidy number for “shipping carbon” — a per-parcel average pulled from a carrier’s marketing page or a spend-based estimate. That number hides the one variable that decides almost everything: how the parcel moved.
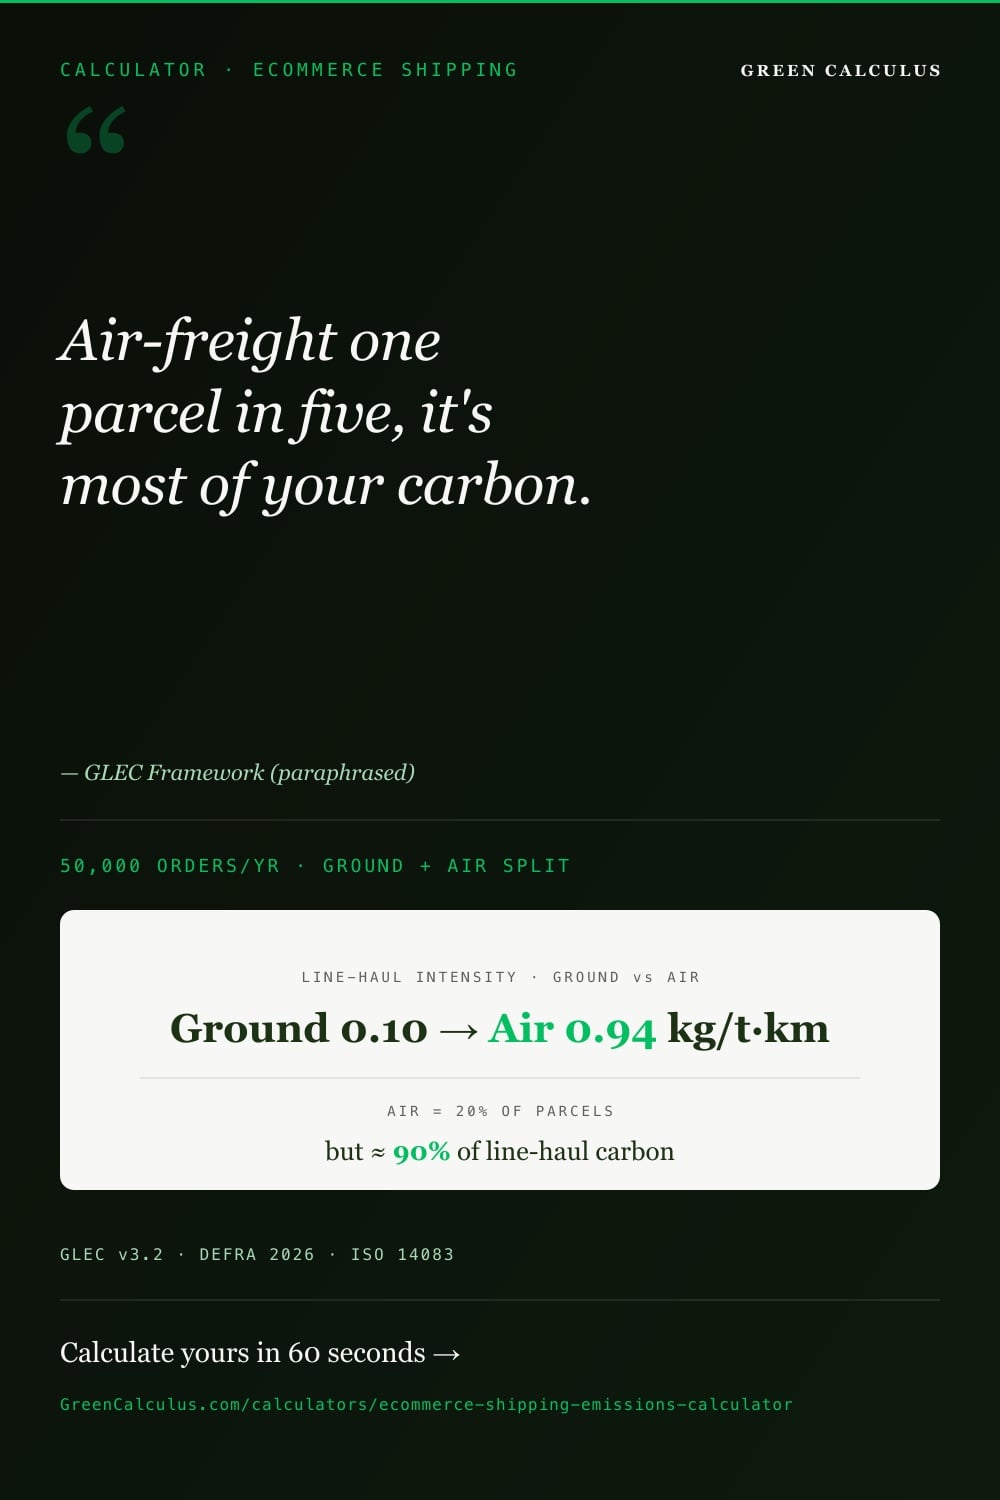
Air-freighting 20% of your orders can produce 90% of your shipping emissions — so the average parcel figure is worse than useless, it is actively misleading.
A typical ecommerce order shipped by ground line-haul plus a diesel last-mile van emits roughly 300–550 g CO₂e. Air express pushes a single order past 1–2 kg CO₂e. Mode, not packaging, dominates the footprint.
What Are Ecommerce Shipping Emissions? Scope, Boundary & Who Owns Them

Ecommerce shipping emissions are the greenhouse gases released moving a sold product from the merchant’s warehouse to the customer’s door — and back again when the customer returns it. For an online retailer this is almost always a downstream Scope 3 emission, because the merchant no longer owns the goods or the vehicles that carry them, yet the merchant’s decision to make the sale set the transport in motion.
What Is In Scope — Three Activity Streams
The calculator covers the three legs the merchant is accountable for as the entity shipping to the consumer:
- Line-haul — the long-distance leg from fulfilment centre toward the destination region, by ground truck/van or by air.
- Last-mile — the final delivery-van leg from local depot to doorstep, shared across every parcel on the route.
- Returns — the reverse journey of the fraction of orders customers send back.
The Scope 3 Category 9 Boundary — and Why Category 4 Is Not Here
This calculator reports Scope 3 Category 9 — Downstream Transportation & Distribution: the transport of sold products where the merchant is the merchant-of-record shipping to the consumer. The mirror-image upstream leg — inbound transport from a supplier to the merchant’s own warehouse — is Category 4 (Upstream Transportation) and is deliberately out of scope here; that belongs in the downstream transportation and upstream road-freight tools rather than this consumer-facing shipping model. Drawing this boundary once, in the right category, is the single most common reason two ecommerce inventories that look similar report different totals.
One reclassification is worth naming for a verifier: the DEFRA delivery-van factor the last-mile tier uses is published as a Scope 1 own-vehicle factor. Because an ecommerce merchant contracts the delivery rather than driving the van, the engine reclassifies that factor to Scope 3 Category 9 as contracted downstream transport. This is a legitimate, documented move — the factor value is unchanged; only its scope attribution shifts to match who controls the activity.
Included vs Excluded
| Included in this calculator | Excluded — report elsewhere |
|---|---|
| Ground line-haul (region × vehicle × fuel, GLEC well-to-wheel) | Inbound supplier→warehouse transport — Scope 3 Category 4 (upstream) |
| Air line-haul (aircraft config × haul, GLEC well-to-wheel) | Sea line-haul — different basis (TEU-km); use the sea freight calculator |
| Last-mile delivery van (vehicle-km ÷ drops, DEFRA 2026) | Rail line-haul — commodity-typed; use the rail freight calculator |
| Customer returns (symmetric reverse journey) | Warehousing and fulfilment-centre energy — Scope 2 / Scope 3 as applicable |
| Well-to-tank (upstream fuel) share, surfaced separately | Packaging embodied carbon — a product/materials line, not transport |
| Ground, air, and returns handled as distinct activity streams per shipping profile | Fuel combustion for owned fleet operations — Scope 1 mobile combustion |
The Calculation Methodology — Two-Tier Activity Method
There is no single “kg CO₂e per parcel” factor that survives contact with real logistics data, because two parcels of identical weight can differ by an order of magnitude depending on whether one flew and the other went by truck. The calculator therefore builds every shipping profile from two activity tiers — line-haul and last-mile — and adds a returns leg, tagging each with its factor source and GWP basis.
Tier 1 — Line-Haul: Mass × Distance × Intensity
Line-haul (kg CO₂e) = parcel mass (t) × distance (km) × EFGLEC (kg CO₂e/tonne-km, well-to-wheel)
Line-haul intensities are GLEC Framework v3.2 well-to-wheel factors at AR6 GWP-100. Ground draws from a region × vehicle-profile × fuel cascade — a 34–40 t articulated diesel truck sits at about 0.101 kg CO₂e/tonne-km, while a sub-3.5 t diesel van runs far higher per tonne-km because it carries so little. Air draws from an aircraft-configuration × haul cascade, with belly-hold long-haul near 0.936 kg CO₂e/tonne-km. Because the factor is per tonne-kilometre, both parcel mass and distance scale the result linearly — a heavier parcel or a longer leg raises line-haul proportionally.
Tier 2 — Last-Mile: Vehicle-km ÷ Drops
Per-parcel last-mile (kg CO₂e) = (route distance ÷ drops per route) × EFDEFRA van (kg CO₂e/vehicle-km)
Last-mile is modelled per vehicle, not per tonne-kilometre, because a delivery van’s emission depends on the route it drives rather than the weight of any one parcel. The engine takes the van’s route distance, divides it across the number of drops on that route, and assigns each parcel its share. An average diesel van is 0.31844 kg CO₂e/vehicle-km well-to-wheel under DEFRA 2026 (0.25716 tank-to-wheel plus 0.06128 well-to-tank), carried at AR5 GWP-100. Drop density is the lever here: 40 route-kilometres shared across 80 drops allocates half the per-parcel last-mile of the same route shared across 40 drops.
Returns — The Symmetric Reverse Journey
A returned order retraces its outbound path. The calculator models returns as a symmetric reverse leg — returns emissions equal outbound line-haul-plus-last-mile multiplied by the return rate — so a profile with a 15% return rate adds 15% of its outbound transport again. Returns are a genuine, verifiable emission, and for high-return categories such as apparel they can rival the last-mile leg in magnitude.
Actual Weight vs Chargeable Weight
Carriers bill on chargeable (volumetric) weight — the greater of actual mass and volume ÷ 5000 — so a light, bulky parcel costs more to ship than it weighs. That is a billing and van cube-out concept, not an emissions one. GLEC line-haul emissions use actual mass. The calculator displays chargeable weight as context but never uses it to inflate the emission. Entering chargeable weight in the mass field overstates line-haul.
Line-Haul Mode: Ground vs Air — The Choice That Dominates Everything
If a merchant changes one thing about how it ships, the mode of the line-haul leg moves the footprint more than every other decision combined. Per tonne-kilometre, air freight is roughly an order of magnitude more carbon-intensive than road, which is itself more intensive than the sea and rail modes handled by other calculators. The chart below compares the well-to-wheel intensities the engine reads.
GLEC Framework v3.2 well-to-wheel intensities (kg CO₂e/tonne-km), AR6 GWP-100, read from MasterBrain. Air short-haul is the most intense per tonne-km; a fully-loaded articulated truck is the least. Note that a small van’s high per-tonne-km figure reflects its low payload — it is efficient for last-mile drops but a poor line-haul workhorse.
The practical consequence: a small share of air-shipped orders can dominate a whole inventory. The worked example below shows 20% of orders moving by air producing about 90% of line-haul emissions. Before optimising packaging, powertrain, or drop density, a merchant should first ask what fraction of orders fly — and whether any of them need to.
Why Sea and Rail Aren’t Computed Here
This calculator computes ground and air line-haul only. Sea and rail run on incompatible activity bases: GLEC sea freight is measured per TEU-kilometre (a parcel is a small fraction of a shipping container, not a tonne-km), and rail factors are commodity-typed. Forcing a parcel through those bases would produce a misleading number, so they are routed to purpose-built tools — the sea freight calculator and the rail freight calculator. For pure air line-haul at freight-forwarder granularity, the air freight calculator carries the fuller aircraft and route model.
Last-Mile & Drop Density — The Final-Leg Allocation
The last mile is the leg most within a merchant’s operational influence and the one most sensitive to how it is measured. Because the calculator allocates a van’s route emissions across its drops, the same delivery van produces a very different per-parcel figure depending on how many parcels it delivers per route.
Dense urban route
40 route-km, 80 drops, average diesel van. Per-parcel last-mile allocation = (40 ÷ 80) × 0.31844 = 0.159 kg CO₂e. High drop density spreads the van’s fuel across many parcels, so each one carries little.
Sparse rural route
40 route-km, 20 drops, average diesel van. Per-parcel last-mile allocation = (40 ÷ 20) × 0.31844 = 0.637 kg CO₂e — four times the urban figure for the same van and route, purely because fewer parcels share it.
Two operational realities make the last mile worse than the arithmetic suggests, and both are worth documenting in an inventory. Failed first-time deliveries force a second attempt, effectively adding a route; and low-density rural rounds inherently carry few drops per kilometre. A merchant reporting last-mile honestly captures the route-km and drop-count from its carrier or 3PL rather than assuming a flat per-parcel value. The dedicated last-mile delivery calculator extends this with alternative powertrains and failed-delivery modelling.
Returns — The Reverse-Logistics Multiplier
Returns are the emission line ecommerce inventories most often omit entirely, and for some categories they are large. Because a returned parcel travels its outbound journey again in reverse, the return rate acts as a direct multiplier on the outbound footprint. The two profiles below ship identical volume and identical parcels; only the return rate differs.
Low-return category · 5%
Electronics accessories, 5% return rate. Returns add 5% to the outbound transport footprint — a rounding-error adjustment that still belongs in the inventory for completeness.
High-return category · 30%
Fashion and footwear, 30% return rate. Returns add 30% to the outbound footprint — nearly a third again on top of every shipped order. Omitting returns here understates the true Category 9 line materially.
The reverse journey of a sold product the customer sends back is still downstream transportation of that product. It is a real vehicle movement with real fuel burn, attributable to the merchant that made the sale. A 25-percentage-point swing in return rate between an electronics brand and an apparel brand can, on its own, be the difference between two otherwise-identical shipping footprints.
Worked Example — 50,000 Orders, Ground + Air Split
This example reproduces the calculator’s seeded default: a merchant shipping 50,000 orders a year across two profiles — the bulk by UK ground, a fifth by EU air express. The inputs and arithmetic are fixed so the result reconciles against the calculator on the date of review. Line-haul is GLEC well-to-wheel (AR6); last-mile is DEFRA 2026 (AR5); the total is therefore a disclosed mixed basis.
Merchant: 50,000 orders/year, two shipping profiles. Profile A — UK ground standard (80% of orders): 1.2 kg parcel; ground line-haul on a 34–40 t articulated diesel truck (0.101 kg CO₂e/tonne-km) over 300 km; diesel last-mile van (0.31844 kg CO₂e/km) over 40 route-km ÷ 80 drops; 15% return rate. Profile B — EU air express (20% of orders): 0.8 kg parcel; air line-haul, belly-hold long-haul (0.936 kg CO₂e/tonne-km) over 1,800 km; diesel last-mile van over 40 route-km ÷ 60 drops; 10% return rate.
| Step | Profile A — UK ground (40,000 orders) | Profile B — EU air (10,000 orders) |
|---|---|---|
| Line-haul per order | 0.0012 t × 300 km × 0.101 = 0.0364 kg | 0.0008 t × 1,800 km × 0.936 = 1.3478 kg |
| Last-mile per order | (40 ÷ 80) × 0.31844 = 0.1592 kg | (40 ÷ 60) × 0.31844 = 0.2123 kg |
| Outbound per order | 0.1956 kg | 1.5601 kg |
| Returns (× rate) | × 1.15 → 0.2250 kg | × 1.10 → 1.7161 kg |
| Orders/year | 40,000 | 10,000 |
| Profile total | ≈ 9.0 tCO₂e | ≈ 17.2 tCO₂e |
≈ 26.2 tCO₂e/year · ≈ 523 g CO₂e/order. Component split: line-haul ≈ 14.9 t (57%), last-mile ≈ 8.5 t (32%), returns ≈ 2.7 t (11%). The headline: air express is 20% of parcels but roughly 90% of line-haul emissions. Profile B ships a quarter of Profile A’s volume yet emits nearly twice as much, entirely because those orders fly. The audit trail surfaces each profile’s factor chain, the MasterBrain version, and a regenerable calc hash via JSON/CSV export.
Switching Profile A’s diesel last-mile van to a battery-electric van drops that leg from 0.31844 to 0.01759 kg CO₂e/km (DEFRA 2026 BEV van, grid-inclusive) — about 94% lower last-mile. Yet because Profile A’s last-mile is a small slice of a total dominated by Profile B’s air line-haul, the overall footprint barely moves. The lesson the calculator teaches: attack line-haul mode-mix first, powertrain second. Shifting even a fraction of air orders to ground beats electrifying every van.
Audit Checklist — What Shipping-Emissions Verification Flags
Verification under ISO 14064-3 or a voluntary protocol traces each material source from activity data to reported tonnes. Ecommerce shipping draws scrutiny because the easy shortcuts — a flat per-parcel average, a forgotten returns leg, a silently-mixed GWP basis — all bias the number in predictable directions. These are the eight items a reviewer checks first.
- Chargeable weight entered as actual weight. Volumetric/chargeable weight is a billing concept; GLEC line-haul uses actual mass. Entering the carrier’s chargeable weight overstates line-haul, often substantially for light bulky goods.
- Line-haul mode averaged away. Blending air and ground into one “shipping” factor hides the air-dominance the whole inventory turns on. Air and ground must be separate activity streams; a single blended factor is a red flag.
- Returns omitted. Dropping the reverse-logistics leg understates Category 9 by the return rate — negligible for electronics, close to a third for apparel. A zero-returns inventory in a high-return category will be challenged.
- Category 4 and Category 9 confused. Counting inbound supplier→warehouse transport (Category 4) inside this downstream Category 9 line, or vice versa, double-counts or misplaces the emission. The boundary must be drawn once, in the right category.
- Mixed GWP basis mislabelled. Line-haul is AR6, last-mile is DEFRA AR5. Labelling the combined total as pure AR6 (or pure AR5) is a disclosure error — the correct label is Mixed AR5/AR6, which the engine applies automatically.
- Last-mile drop count missing. Reporting a flat per-parcel last-mile without the route-km ÷ drops allocation ignores drop density — the biggest last-mile variable. A verifier expects the route and drop basis on record.
- Sea or rail forced through this tool. A parcel is not a TEU-km or a commodity rail load. Sea/rail line-haul computed here rather than in the dedicated calculators produces an incompatible-basis number.
- Modelled data presented as primary. A screening estimate built from default distances and modes is not carrier-reported activity data. The engine’s data-quality tiering (Screening vs Reporting-grade, plus primary-activity share) must reflect which is which.
Platform & Carrier Data — Shopify, Carriers, 3PLs
The quality of a shipping-emissions number is set by where its inputs come from. A Shopify or other ecommerce platform already holds most of what the calculator needs; the gaps are usually distance, mode, and drop density, which live with the carrier or 3PL.
Where Each Input Comes From
| Input | Typical source |
|---|---|
| Parcel weight | Product catalogue / order line items (platform) |
| Order volume & destination zone | Order and shipping records (platform) |
| Line-haul mode & distance | Carrier service level / shipping label; origin→destination zone lookup |
| Last-mile route-km & drops | Carrier or 3PL route data (the hardest input to source) |
| Return rate | Returns/RMA records (platform or returns provider) |
The Data-Quality Hierarchy — Your Confidence Signal
Because GLEC aggregate CO₂e factors carry no published per-row uncertainty range, the calculator does not surface a numeric ± band — a fabricated confidence interval would be worse than none. Instead it grades confidence through a data-quality tier, from best to weakest:
- Carrier-reported activity — actual mode, distance, and route data from the carrier or 3PL. Reporting-grade.
- Modelled activity — platform order data with modelled distances and default modes. Adequate for most corporate inventories.
- Screening estimate — defaults throughout, used to size the line before investing in better data.
The engine reports a Screening vs Reporting-grade split and the share of emissions backed by primary activity data. That share, not a ± percentage, is the honest confidence signal — and the lever for improving the inventory is to move more of it up the hierarchy.
Geographic & Regulatory Context — GLEC, ISO 14083, EU, UK, Singapore
GLEC Framework and ISO 14083
The GLEC Framework is the logistics-sector method for calculating and reporting transport-chain greenhouse gas emissions, and it is harmonised with ISO 14083, the international standard for quantifying emissions arising from transport-chain operations. This calculator’s line-haul tier applies GLEC v3.2 well-to-wheel intensities, which is the basis a logistics-aware verifier expects for the transport legs of a Scope 3 inventory.
Corporate Reporting — GHG Protocol Scope 3
Under the Scope 3 value-chain standard, downstream transportation of sold products is Category 9. Ecommerce shipping is a core Category 9 line for any retailer whose customers receive physical goods. Corporate reporting defaults to AR6 GWP-100; the DEFRA-sourced last-mile factor carries AR5 by design, which is why the combined total is disclosed as a mixed basis rather than forced to a single one.
UK Reporting
UK businesses meeting the SECR thresholds report energy and carbon in their annual filings, and downstream transport can form part of the voluntary Scope 3 disclosure. The DEFRA 2026 conversion factors underpin the last-mile tier here; the UK SECR calculator sets the wider reporting context this line can feed into.
Singapore and Other Jurisdictions
Singapore-based ecommerce and logistics entities reporting under emerging climate-disclosure rules encounter downstream transport within their Scope 3 value-chain inventories. The GLEC / ISO 14083 basis at AR6 is the defensible default where a jurisdiction does not mandate a specific national factor set. Verify against any local requirement before finalising a regulatory submission.
Data Sources, Factor Versioning & GWP Basis
Emission-Factor Provenance
Line-haul intensities are GLEC Framework v3.2 well-to-wheel factors (ground region × vehicle × fuel; air configuration × haul), weighted at AR6 GWP-100. Last-mile uses DEFRA 2026 delivery-van factors (tank-to-wheel headline plus a separate well-to-tank component), weighted at AR5 GWP-100 per the DEFRA convention. Electric ground line-haul, where used, couples a GLEC energy-intensity factor to a region-representative grid factor from Ember/EPA. All factors are read live from MasterBrain at calculation time, and every result cell carries a source citation in the audit trail.
Confidence — Data-Quality Tiers, Not a Numeric Band
The calculator does not report a numeric uncertainty range. GLEC aggregate CO₂e rows carry no published per-row uncertainty, so a ± figure would be invented rather than sourced. Confidence is instead expressed through the data-quality tiering described above — the Screening vs Reporting-grade split and the primary-activity share by emissions. Where shipping is material to a footprint, the route to a tighter number is more carrier-reported activity data, not a spuriously precise error bar.
Version History and Update Schedule
Factor data is sourced from MasterBrain, with the live version stamped in the calculator’s source bar and provenance ribbon. GLEC intensities update with each Framework revision; DEFRA vehicle factors update annually with the DESNZ UK conversion-factor release. The audit-trail toggle on each calculation cites the source per factor, and the JSON/CSV export carries the full coefficient set, source ids, and MasterBrain version for a given calculation.
What’s Next? Completing Your Logistics Inventory
Ecommerce shipping is one downstream slice of a full transport footprint. The upstream inbound leg (Category 4), the mode-specific freight legs (sea, rail, air at freight-forwarder granularity), and the standalone last-mile model each carry more depth for their part of the chain — and all roll up into a consolidated Scope 3 transport inventory.
Frequently Asked Questions
For an online merchant shipping sold products to customers, it is Scope 3 Category 9 (Downstream Transportation & Distribution) — the merchant contracts the transport but does not own the vehicles. Only a retailer operating its own delivery fleet would report that leg as Scope 1. Inbound transport from suppliers to the merchant’s warehouse is a separate Scope 3 line, Category 4.
A typical order shipped by ground line-haul plus a diesel last-mile van emits roughly 300–550 g CO₂e. An air-express order can exceed 1–2 kg CO₂e for the same weight. The dominant variable is line-haul mode, not parcel size or packaging — which is why a single per-parcel average across mixed modes is misleading.
Per tonne-kilometre, air freight is roughly nine times as carbon-intensive as a full articulated truck (0.936 vs 0.101 kg CO₂e/tonne-km well-to-wheel), and short-haul air is worse still. A small share of air-shipped orders can therefore produce most of a merchant’s line-haul emissions — in the worked example, 20% of orders by air account for about 90% of line-haul.
Use actual weight for emissions. Chargeable (volumetric) weight — the greater of actual mass and volume ÷ 5000 — is how carriers bill for bulky-but-light parcels; it is a pricing and van cube-out concept, not an emissions one. GLEC line-haul factors apply to actual mass. The calculator shows chargeable weight as context but never uses it to inflate the emission.
Yes — a returned parcel retraces its outbound journey, so it is a real downstream transport emission. The calculator models returns as a symmetric reverse leg: returns emissions equal outbound emissions multiplied by the return rate. For high-return categories like apparel (often 25–30%), returns add nearly a third to the outbound footprint and should never be omitted.
Last-mile is allocated per drop, not per parcel-weight. The calculator takes the van’s route distance, divides it across the number of drops on that route, and assigns each parcel its share. A dense 80-drop route allocates a quarter of the per-parcel last-mile of a sparse 20-drop route over the same distance — drop density is the biggest last-mile lever.
Line-haul uses GLEC factors at AR6 GWP-100; last-mile uses DEFRA factors, which carry AR5 GWP-100 by the DEFRA convention. The engine reports each tier on its native basis and labels the total “Mixed AR5/AR6” rather than re-weighting one to match the other, because there is no defensible reweight of an already-aggregated CO₂e factor. This asymmetry is intentional and standards-consistent, not an error.
No — deliberately. Sea freight is measured per TEU-kilometre and rail is commodity-typed, and a single parcel does not map cleanly onto either basis. Ground and air line-haul are computed here; sea and rail are routed to dedicated freight calculators that use the correct activity basis for those modes.
It cuts the last-mile leg sharply — a DEFRA 2026 battery-electric van is about 94% lower per kilometre than diesel (0.01759 vs 0.31844 kg CO₂e/km, grid-inclusive). But if your footprint is dominated by air line-haul, electrifying vans barely moves the total. The higher-leverage move is shifting orders off air onto ground; powertrain comes second.
From the platform: parcel weights, order volume, destination zones, and return rate. From the carrier or 3PL: line-haul mode and distance, and last-mile route-km and drops per route. The last-mile route data is usually the hardest to obtain; where it is unavailable the calculator can run on modelled defaults, but the data-quality tier reflects that it is a screening rather than reporting-grade estimate.
Methodology Notes and Limitations
Two-tier activity method. Line-haul is mass × distance × GLEC well-to-wheel intensity; last-mile is route-km ÷ drops × DEFRA van factor. There is no single per-parcel factor — the composition is deliberate, because a flat average conceals the mode-mix that dominates the result.
Mixed GWP basis by design. Line-haul (GLEC) is AR6 GWP-100; last-mile (DEFRA) is AR5 GWP-100. The engine discloses the mixed basis and never blends the two. This follows the DEFRA convention and is not a reconciliation error.
Ground and air only. Sea (TEU-km) and rail (commodity-typed) run on incompatible bases and are handled by dedicated calculators. Do not compute parcel sea or rail line-haul here.
Category 9 boundary. This is downstream transport of sold products plus returns. Inbound supplier transport (Category 4), warehousing energy, and packaging embodied carbon are out of scope and reported on separate lines.
Confidence via data-quality tiers. No numeric uncertainty band is shown, because GLEC aggregate rows carry no published per-row uncertainty. The Screening vs Reporting-grade split and primary-activity share are the confidence signal.
No site-specific verification. This calculator is a calculation aid, not a measurement system. Regulatory submissions requiring audited accuracy need independent verification against carrier-reported activity data.