
Poore & Nemecek (2018) Food LCA

Almost every widely-circulated figure comparing the carbon footprint of beef to tofu, of cheese to oat milk, of a beef burger to a bean burger, traces back to a single 2018 paper — the largest meta-analysis of food’s environmental impact ever assembled.
Poore & Nemecek did not run new farms; they consolidated the world’s food LCA literature into one comparable dataset, and that dataset became the reference layer beneath a decade of dietary-footprint debate.
Poore & Nemecek (2018) is a landmark Science meta-analysis of food's environmental impact, consolidating life-cycle data from ~38,700 farms across 119 countries. It found food supplies about 26% of global emissions, varying up to 50-fold between producers.
Executive Summary
“Reducing food’s environmental impacts through producers and consumers,” published in Science on 1 June 2018 by Joseph Poore and Thomas Nemecek, is the most comprehensive meta-analysis of the environmental impact of food ever produced. Rather than measuring new farms, the authors consolidated life-cycle assessment (LCA) data from 570 peer-reviewed studies into a single, standardised dataset covering roughly 38,700 commercially viable farms in 119 countries and 40 products that together account for about 90% of global protein and calorie consumption.
The study assessed five environmental indicators — greenhouse-gas emissions, land use, terrestrial acidification, eutrophication, and scarcity-weighted freshwater withdrawals — from farm inputs through to the retail point, and reported the results per unit of nutrition rather than per kilogram of raw product. Two findings became its enduring legacy: that the food supply chain generates roughly a quarter of global greenhouse-gas emissions, and that the impact of producing the same product can vary as much as fifty-fold between producers, so that the lowest-impact animal products still typically exceed their plant-based substitutes.
Poore & Nemecek (2018) is not a standard in the sense of a governing framework like the GHG Protocol or ISO 14067. It is a dataset — but a dataset that functions as a de facto reference for food-footprint comparison, cited by researchers, journalists, calculators, and corporate reporting alike. This page documents it as the reference layer it has become, with the same historical-record discipline applied to any standard: every value hardcoded to the paper, its supplementary tables, or the 2019 erratum.
Provider directory
Now it has to survive the next design change.
See who does this work. Every listing names the standards it works to, and paid placements are labelled. Including WAP Sustainability and Enviropass Consulting.
Browse 4 embodied carbon & LCA providers →Do this work? A listing is US$390 a year. Get listed →
What Is Poore & Nemecek (2018)?
Poore & Nemecek (2018) is a global meta-analysis of food LCA. A single farm’s environmental footprint is measured by a life-cycle assessment; thousands of such assessments existed by the mid-2010s, but they were scattered across the literature, used inconsistent methods, different functional units, and different system boundaries, and could not be compared. The study’s contribution was to gather those disparate assessments, standardise them against a common protocol, and produce one internally comparable dataset spanning the major foods of the global diet.
The result is best understood as three things at once. It is a meta-analysis — a synthesis of existing primary studies rather than new fieldwork. It is a dataset — a structured set of per-product, multi-indicator environmental footprints, distributed with the paper and subsequently adapted for public use. And it is an argument — that because impacts vary so enormously between producers of the same food, the largest mitigation opportunities lie in targeting the highest-impact producers and in shifting consumption toward lower-impact foods, rather than in uniform practice changes.
It is, crucially, a snapshot. The dataset has a median reference year of 2010 and was fixed at publication; it is not updated for new farming practices, new studies, or changed emission factors. Reading it as a live, current picture of food’s footprint rather than as a large, dated, well-characterised baseline is the most common error in its use.
Why the Study Matters
Before 2018, the public conversation about the environmental cost of food ran on fragments — a footprint figure for beef from one study, for almond milk from another, for cheese from a third — that were not built to be compared. There was no single, methodologically consistent source that placed the major foods on the same axes across multiple environmental dimensions. Poore & Nemecek built that source.
Its influence is disproportionate to any single number in it. The dataset underpins the food-footprint visualisations of Our World in Data, feeds consumer-facing carbon calculators, informs dietary-guidance debates, and is cited in corporate and governmental sustainability analysis. When a news article states that beef produces far more emissions per gram of protein than legumes, or that food is responsible for about a quarter of global emissions, the ultimate source is very often this paper.
For a company estimating the footprint of food purchases or products, Poore & Nemecek offers globally representative secondary factors across five indicators for 40 products — a defensible starting point where primary supplier data is unavailable. But its global-median values are not a substitute for product- or region-specific data, and using them as if they were introduces exactly the error the 50-fold variation finding warns against.
Authors, Publication, and Provenance
The study was authored by Joseph Poore, of the Department of Zoology and the School of Geography and the Environment at the University of Oxford, and Thomas Nemecek, of the Agroecology and Environment Research Division’s LCA Research Group at Agroscope in Zürich, Switzerland. It was published as a research article in Science — the peer-reviewed journal of the American Association for the Advancement of Science (AAAS) — in volume 360, issue 6392, pages 987 to 992, on 1 June 2018, under DOI 10.1126/science.aaq0216.
The paper is accompanied by an extensive supplementary materials file containing the methodology, the screening criteria, the full data tables, and the sensitivity analyses — the supplement is substantially larger than the article itself and is where most of the technical detail lives. An accepted-manuscript version is openly available through the Oxford University Research Archive, while the version of record sits behind the AAAS paywall.
A formal erratum was published in Science on 22 February 2019 (volume 363, issue 6429, article eaaw9908), correcting specific values in the original. The erratum is part of the citable record and is addressed in its own section below; any rigorous use of the dataset must account for it.
The Dataset: Scope and Coverage
The scale of the dataset is the source of its authority. The headline coverage figures, drawn directly from the paper, are worth stating precisely because they are frequently rounded or misquoted.
| Dimension | Coverage |
|---|---|
| Studies screened for inclusion | 1,530 identified, supplemented by data from 139 authors |
| Studies meeting the inclusion criteria | 570 |
| Publication window of source studies | 2000–2016 |
| Median reference year of the data | 2010 |
| Farms represented | ~38,700 commercially viable farms |
| Countries | 119 |
| Products | 40 major agricultural goods |
| Downstream actors | ~1,600 processors, packaging types, and retailers |
| Share of global diet | ~90% of global protein and calorie consumption |
The 40 products span the major food groups — protein-rich products (meats, fish, dairy, eggs, legumes, nuts), grains, starchy roots, oils, vegetables, fruits, sugars, alcoholic beverages, and stimulants such as coffee and chocolate. The breadth is what allows the dataset to place, say, beef and peas, or cow’s milk and its plant substitutes, on the same comparable footing across all five indicators — the comparison that gave the study its public reach.
Methodology: How the Meta-Analysis Was Built
The methodological achievement of the study is standardisation. Raw LCA studies could not simply be pooled, because they differed in method, boundary, functional unit, and quality. The authors applied a structured screening and harmonisation process to convert a heterogeneous literature into a single comparable dataset.
Screening against eleven criteria
From 1,530 candidate studies, the authors retained 570 by testing each against eleven criteria designed to standardise methodology — covering system boundary, the impact categories reported, the completeness of the inventory, allocation approach, and data quality, among others. Only studies that could be brought onto a common basis were kept, which is why the retained set is roughly a third of those screened.
Harmonisation and recalculation
Retained studies were recalculated onto consistent assumptions — a common set of characterisation factors, a consistent treatment of by-products through allocation, and a common system boundary — so that a beef figure from one study and a wheat figure from another reflected the same accounting choices. Global warming potentials followed a 100-year basis (GWP100), consistent with mainstream carbon accounting.
Modelling coverage gaps and downstream stages
Where farm-level data was thin, the authors modelled representative values, and they added consistent post-farm stages — processing, packaging, transport, and retail — so that each product carried a cradle-to-retail footprint rather than a farm-gate-only one. The supplementary materials document the modelling assumptions in detail.
The dataset’s per-product figures are global medians across the farms in the sample, not averages of a few studies. Reporting the median is deliberate: with impacts spread across orders of magnitude, the median is more representative of a typical producer than a mean pulled upward by a long high-impact tail. It also means every headline product figure has a distribution behind it — the 10th and 90th percentiles are as important as the median.
The Five Environmental Indicators
The study assessed five environmental indicators for each product — a deliberate breadth, because a food that looks good on carbon may look poor on water or land. Reducing food’s footprint to a single carbon number, the authors argued, hides the trade-offs.
| Indicator | Unit | What it captures |
|---|---|---|
| Greenhouse-gas emissions | kg CO₂eq (GWP100) | Climate impact across CO₂, methane, and nitrous oxide from the supply chain. |
| Land use | m²·year | Area occupied multiplied by the time it is occupied — the land cost of production. |
| Terrestrial acidification | g SO₂eq | Acidifying emissions (largely ammonia and nitrogen oxides), driven heavily by manure and fertiliser. |
| Eutrophication | g PO₄eq | Nutrient runoff to water bodies causing algal blooms and oxygen depletion. |
| Scarcity-weighted freshwater withdrawal | litres (scarcity-weighted) | Freshwater use weighted by local water scarcity, so a litre in a dry region counts for more than a litre in a wet one. |
A central methodological finding follows from having five indicators rather than one: they correlate weakly. The study reported low correlations between indicators for similar products globally — one impact category is a poor predictor of another. Manure-driven products such as pork, poultry, and milk show a stronger link between acidification and eutrophication, but that does not generalise. The practical implication is that a food cannot be ranked “greener” on a single axis; a genuine assessment must look across all five.
Because the five indicators do not track each other, a product with a low carbon footprint may still carry a high land-use or water-scarcity footprint. Any use of the dataset that quotes only the GHG figure — as most popular coverage does — discards four-fifths of what the study measured and can invert the ranking on a different indicator.
Functional Units and the Comparability Problem
The choice of functional unit — the “per what” of the footprint — is the most consequential and most misunderstood methodological decision in food LCA, and Poore & Nemecek handled it deliberately. A footprint per kilogram of product flatters calorie-dense or protein-dense foods and penalises watery ones; a footprint per calorie or per gram of protein tells a different story again.
The study reported impacts per unit of nutrition, choosing the functional unit to suit each food’s role in the diet:
- 100 g of protein for protein-rich products — meats, fish, dairy, eggs, legumes, nuts. This is the unit behind the famous protein-footprint comparisons.
- 1,000 kcal for staple grains and starchy tubers, where the dietary role is energy.
- Per litre for oils, per kg for horticultural crops and sugar, and product-appropriate units for other groups (for example, a unit of alcohol defined as 10 ml of pure alcohol for alcoholic beverages).
The nutritional functional unit is why the study’s protein comparisons are so stark: measuring beef against peas per 100 g of protein — the nutrient both are eaten for — is a fairer comparison than per kilogram, and it is on this basis that the lowest-impact animal proteins still exceed plant proteins.
A footprint figure from this dataset is meaningless without its functional unit. “Beef: 50 kg CO₂eq” is incomplete — per kilogram of product, per 100 g of protein, and per 1,000 kcal are three very different numbers. Comparing a per-kg figure for one food with a per-protein figure for another is one of the most common and most misleading errors in citing the study.
System Boundary: Cradle to Retail
The study’s system boundary runs from cradle to retail — from the production of farm inputs, through the farm stage, processing, packaging, and transport, to the retail point. It deliberately stops at the retailer: it does not include consumer transport, home storage, cooking, or the emissions of food waste at the consumer stage, because those depend on individual behaviour rather than on the product itself.
Within that boundary, the study decomposed each product’s footprint into supply-chain stages, and the decomposition is one of its most useful outputs. For many animal products the farm stage — enteric fermentation, manure, on-farm energy — dominates, with land-use change a large secondary contributor for products linked to deforestation, and transport, processing, packaging, and retail together making up a comparatively small share. For beef specifically, the study attributed the great majority of emissions to the farm and land-use-change stages, with transport and retail a minor fraction — a structural fact that undercuts the common assumption that “buying local” is the primary lever for reducing food’s climate impact.
Because transport is a small share of most foods’ cradle-to-retail footprint, switching to local produce typically moves the total far less than switching what is eaten. The dataset’s stage decomposition is the evidence base for the widely-cited conclusion that dietary composition matters more than food miles for the climate footprint of most products.
Headline Findings
Several figures from the paper have entered general circulation. Stated at the level the authors reported them:
- Food’s share of emissions. The food supply chain generates approximately 13.7 billion tonnes of CO₂eq per year — about 26% of anthropogenic greenhouse-gas emissions. A further ~2.8 billion tonnes (5%) from non-food agriculture and other drivers of deforestation brings agriculture and land use to about 31% of the global total.
- Land footprint. Agriculture occupies roughly 43% of the world’s ice- and desert-free land, and the study quantified how unevenly that land delivers nutrition across products.
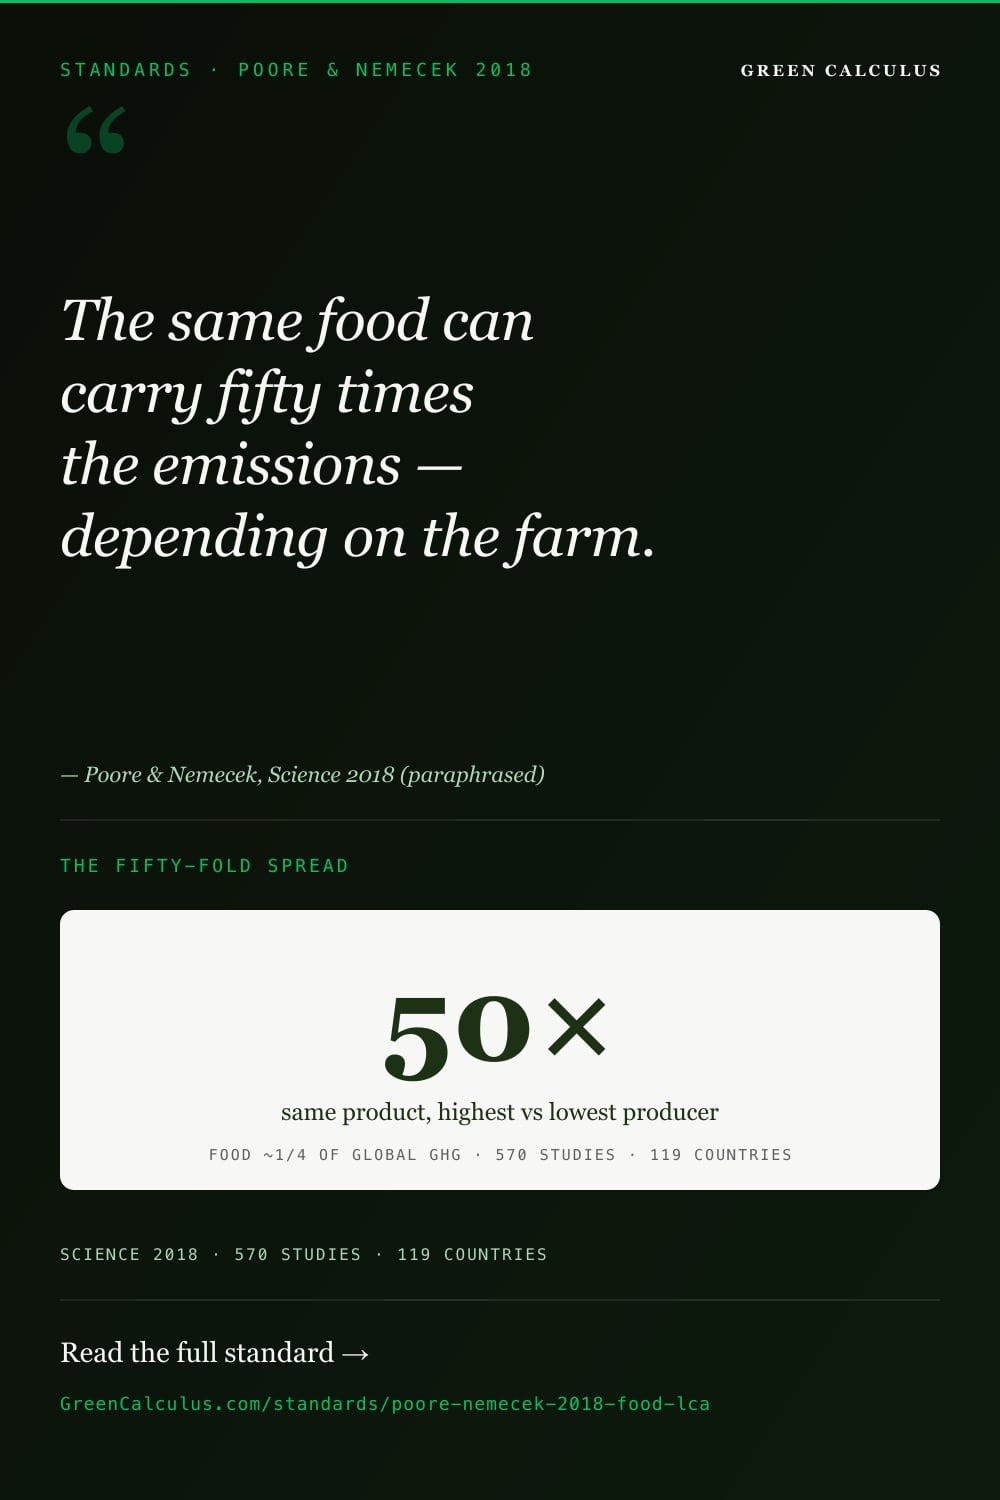
- Variation. Impacts can vary up to 50-fold among producers of the same product, creating large mitigation opportunities but also complicating any single-number footprint.
- Animal versus plant. The impacts of the lowest-impact animal products typically exceed those of vegetable substitutes across indicators — the finding the authors described as providing new evidence for the importance of dietary change.
- Dietary shift potential. The paper estimated that moving from current diets toward plant-forward diets has transformative potential, substantially reducing food’s land use and emissions — with land freed for other uses, including carbon sequestration.
The 50-Fold Variation Finding
The single most important analytical result of the study is not any product’s median footprint but the spread around it. For the same product, produced to the same nutritional unit, impacts vary enormously — up to fifty-fold — between the lowest- and highest-impact producers. A pint of beer can carry three times the emissions and four times the land use of another; two visually identical products in a shop can have very different planetary costs.
This variation has two consequences the authors drew out. First, it means a product’s median footprint conceals a wide distribution: the 10th- and 90th-percentile figures matter as much as the median, and a policy or purchasing decision based on the median alone misses most of the opportunity. Second, it means the largest mitigation gains come from targeting the highest-impact producers — the tail of the distribution — rather than from uniform improvements applied equally to all.
Popular coverage reduced the study to a league table of median footprints. The authors’ actual thesis was subtler: because the same food varies so much by how and where it is produced, effective mitigation must combine producer-level targeting (cutting the worst) with consumer-level dietary shift (moving away from the highest-impact categories). Neither lever alone is sufficient.
Animal versus Plant Products
The study’s most-cited conclusion is that the lowest-impact animal products typically exceed the impacts of their plant-based substitutes. This is a stronger claim than “animal products have higher average footprints,” because it accounts for the variation: even a producer at the low-impact end of the animal-product distribution generally sits above the plant alternative, so the ranking does not flip simply by choosing a better-farmed animal product.
The comparison is clearest per 100 g of protein — the nutrient the foods share. Across GHG emissions, land use, acidification, eutrophication, and water use, protein-rich plant foods such as peas, other legumes, and grains generally impose lower burdens than meats and, on most indicators, than dairy. The study did note that grains, while lower in protein content, contribute a large share of global protein intake (around 41%), so they appear alongside the protein-rich group in the analysis.
The finding is that substituting plant proteins for animal proteins reduces impact across indicators — a statement about dietary composition. It is not a claim that all animal production is equivalent, nor that no animal system can be low-impact in absolute terms, nor that land unsuitable for crops should never carry livestock. Those nuances live in the variation data and the study’s own caveats.
Beef, Land Use, and the Hotspot Structure
Beef is the study’s defining example because it sits at the extreme of every indicator. The dataset’s figures for beef are the ones most often quoted, and their precision matters:
| Beef metric (from the paper) | Value |
|---|---|
| 90th-percentile GHG emissions | 105 kg CO₂eq per 100 g protein |
| 90th-percentile land use | 370 m²·year per 100 g protein |
| Relative to peas (GHG, high-impact beef) | roughly two orders of magnitude greater |
| Dairy-herd beef vs beef-herd beef | Reported separately — dairy-beef, tied to milk demand, is markedly lower-impact than dedicated beef-herd production |
The study also decomposed where beef’s emissions come from: the farm stage (enteric methane, manure, on-farm energy) dominates, land-use change (deforestation for pasture and feed) is a large secondary component, and animal feed, transport, processing, packaging, and retail together make up a small remainder. This hotspot structure — most of the impact upstream, at the farm and in land conversion — is why interventions aimed at transport or packaging barely move beef’s total, and why the study frames dietary shift as the high-leverage response.
An important distinction the authors preserved is between beef from dedicated beef herds and beef that is a by-product of dairy. Because dairy-beef’s impact is partly allocated to milk, it is substantially lower per unit than beef-herd beef, and the study reports the two separately rather than blending them — a subtlety usually lost when a single “beef” figure is quoted.
The 2019 Erratum
On 22 February 2019 Science published a formal erratum to the paper (363(6429):eaaw9908). Errata are a normal part of the scientific record and do not retract a study; they correct specific values while leaving the substance intact. This one is nonetheless material to anyone using the dataset quantitatively, because it adjusted some of the animal-product figures and the land-related calculations.
The correction principally concerned the treatment of land and the carbon consequences of dietary change — recognising a larger potential for carbon capture on land freed by reduced animal-product demand than the original had credited, and revising associated animal-product footprints. The direction of the correction reinforced rather than reversed the paper’s conclusions: the environmental case for dietary shift, if anything, strengthened.
Any rigorous use of the dataset must apply the 2019 erratum. Figures circulating from the original June 2018 release that predate the correction may not match the corrected record. When a downstream source quotes a Poore & Nemecek number, the first check is whether it reflects the erratum — the accepted manuscript in the Oxford archive carries the erratum notice, and the version of record incorporates it.
The Our World in Data Adaptation
For most practitioners, the dataset is encountered not in the raw supplementary tables but through the adaptation published by Our World in Data (OWID), which turned the paper’s figures into accessible, interactive charts of GHG emissions, land use, water use, and eutrophication per kilogram and per 100 g of protein. That adaptation is why the study’s figures are so widely recognised — but it introduces its own considerations.
OWID uses the published Poore & Nemecek values where the paper provides them, and calculates additional figures — for example, per-kilogram values for products where the paper reported only per-protein or per-calorie units, or vice versa — to fill gaps. Those OWID-derived figures are adaptations, not original study outputs, and should be attributed accordingly. OWID is explicit that where nutritional footprints are available from the paper they are used directly, and gaps are filled by OWID’s own calculation.
When quoting a food-footprint figure, distinguish three layers: the original Poore & Nemecek value (cite the paper, with the erratum), an OWID-derived value calculated to fill a gap (cite OWID as adapting the paper), and any further downstream recalculation. Collapsing these — attributing an OWID-derived per-kg figure directly to the paper as if it were an original output — is a provenance error that a careful reviewer will catch.
Using the Data in Carbon Accounting
In corporate carbon accounting, Poore & Nemecek functions as a source of secondary emission factors for food and agricultural products — the kind of globally representative data used when primary, supplier-specific data is unavailable. It is most relevant to Scope 3 Category 1 (purchased goods and services) for food businesses, retailers, and caterers, and to product carbon footprints for food products.
Used well, it provides a defensible, well-documented, widely-recognised baseline. Used poorly, it imports its own limitations: a global median masks the 50-fold producer variation, a 2010-median dataset may not reflect current practice, and a cradle-to-retail boundary omits consumer-stage impacts. The discipline is to treat it as a secondary factor of known vintage and scope — appropriate for screening, hotspotting, and estimation, but to be replaced by primary or region-specific data where materiality demands.
For the accounting frameworks that govern how these factors are applied, the value-chain rules of the GHG Protocol Scope 3 Standard and the product-footprint rules of ISO 14067 are the governing references; Poore & Nemecek supplies data that those frameworks consume, not a method that competes with them. The GreenCalculus food product-carbon-footprint calculator and its methodology document how food-sector factors of this kind are applied in practice.
Relationship with LCA Standards and Databases
Poore & Nemecek is a dataset built on top of the LCA method; it does not define the method. Understanding where it sits relative to the standards and databases that govern LCA is essential to using it correctly.
| Reference | What it provides | Relationship to Poore & Nemecek |
|---|---|---|
| ISO 14040 / 14044 | The principles and framework for conducting any LCA | Governing method — the rules the underlying farm studies were meant to follow |
| ISO 14067 | Requirements specific to product carbon footprints | Governing method for the carbon indicator specifically |
| ecoinvent | A background LCI database of unit-process data | Upstream data source — several source studies and Nemecek’s own work draw on ecoinvent |
| GHG Protocol / Land Sector & Removals | Corporate and value-chain GHG accounting rules, incl. land | Downstream consumer — frameworks that use datasets like this as secondary factors |
| Poore & Nemecek (2018) | Harmonised, multi-indicator footprints for 40 foods | A synthesised dataset sitting between the LCA method and its accounting applications |
The practical distinction is that ISO 14040/14044 and ISO 14044 tell you how to do an LCA, databases such as ecoinvent supply the background data an LCA consumes, and Poore & Nemecek supplies finished, comparable results for food specifically. It is neither a method nor a raw database; it is a curated results layer — which is exactly why it is so citable and, equally, why it must be used within the boundaries of its own vintage and assumptions.
Common Misinterpretations
The dataset’s per-product figures are global medians with a 50-fold spread behind them. Treating “beef = X” as a fixed property of beef, rather than as a midpoint of a wide distribution, is the error the study’s central finding exists to warn against.
The dataset has a median reference year of 2010 and was fixed at publication. It does not reflect subsequent changes in farming practice, feed, or energy systems. Using it as a live current picture, rather than as a dated baseline, overstates its currency.
Per kilogram, per 100 g of protein, and per 1,000 kcal give different rankings. Comparing a per-kg figure for one food with a per-protein figure for another — a frequent error in popular graphics — produces a meaningless comparison.
The study measured GHGs, land, acidification, eutrophication, and water — and found they correlate weakly. Quoting only the carbon figure discards most of the analysis and can reverse a ranking on land or water.
Cradle-to-retail excludes consumer transport, cooking, and home food waste. A footprint from this dataset is not a full plate-level footprint, and adding consumer-stage impacts requires data the study did not provide.
The study is an environmental analysis, not a nutritional or ethical prescription. Its dietary-shift conclusion is about environmental impact per unit of nutrition; it does not, by itself, resolve questions of nutrition, affordability, livelihoods, or land suited only to grazing.
Common Application Errors
- Ignoring the 2019 erratum. Quoting original-release figures for animal products or land calculations that the erratum revised.
- Mixing functional units. Placing a per-kilogram value beside a per-protein value in the same comparison or chart.
- Attributing OWID-derived figures to the paper. Citing a value Our World in Data calculated to fill a gap as if it were an original Poore & Nemecek output.
- Treating the median as the applicable factor. Applying a global median to a specific supplier or region whose actual footprint could sit anywhere across the 50-fold range.
- Quoting a single indicator as “the footprint”. Reporting only GHGs and implying it represents overall environmental impact, when land or water may tell the opposite story.
- Blending dairy-beef and beef-herd beef. Using one “beef” number where the study deliberately separates the two because of allocation to milk.
- Extending the boundary silently. Presenting a cradle-to-retail figure as a plate-level or consumer footprint without adding — and disclosing — the missing stages.
Criticisms and Limitations
The study is widely admired and widely debated. A complete reference sets out the substantive criticisms alongside the authors’ own stated limitations.
Grassland, grazing, and soil carbon
Critics from the grazing-livestock community argue the analysis under-credits well-managed grazing systems — particularly the potential for soil-carbon sequestration under managed grazing, and the use of marginal land unsuitable for crops. The counter-argument is that soil-carbon gains are finite, reversible, and small relative to ruminant methane, and that most livestock is not raised on land that could not grow crops. The debate is genuine and unresolved at the margins, but it does not overturn the central animal-versus-plant ranking.
Land-use-change allocation
How to attribute the emissions of deforestation to the products grown on newly cleared land is methodologically contested, and land-use-change assumptions materially affect the footprints of products linked to deforestation. The study made defensible choices, but different allocation conventions would shift some figures.
A dated, median-based snapshot
The 2010 median reference year and the reliance on medians are limitations by construction. Farming practices, feed efficiency, and energy systems have moved since; and a median cannot represent a specific supply chain. The dataset is a baseline, not a live feed.
Regional and smallholder coverage
Although the dataset spans 119 countries, LCA literature is unevenly distributed, with richer coverage of high-income agriculture and thinner coverage of some smallholder and tropical systems. Modelled values fill gaps, but coverage is not uniform.
Popular oversimplification
Much of the criticism directed “at the study” is really criticism of how it has been used — median league tables, single-indicator rankings, mixed functional units. The paper itself is careful about variation and trade-offs; the simplifications are downstream.
The limitations are real, and the grazing and land-use-change debates are legitimate scientific disagreements rather than settled points. But none displaces the study’s core, repeatedly-replicated conclusions: food is a major share of global impact, the same product varies enormously by producer, and plant proteins generally impose lower burdens than animal proteins per unit of nutrition. The dataset should be used with its vintage, its median nature, and its erratum attached — not discarded, and not treated as gospel.
Legacy and Influence
Few environmental datasets have shaped a public conversation as thoroughly. Three strands of influence stand out.
The reference layer for food-footprint communication. Through Our World in Data and countless derivative works, the study became the default source for comparing the environmental cost of foods. Its median figures anchor consumer calculators, product labels, and journalism.
Evidence for dietary-shift policy. The finding that plant proteins outperform even low-impact animal proteins per unit of nutrition became a central citation in debates over dietary guidelines, institutional catering, and food-system decarbonisation strategy.
A model for meta-analytic LCA. Methodologically, the study demonstrated that a heterogeneous LCA literature could be standardised into a comparable multi-indicator dataset at global scale — a template that later food and agricultural syntheses have followed. Its supplementary materials remain a reference for how to screen, harmonise, and document such a synthesis.
Its long-run significance is less any single number than the shift it produced: from fragmented, incomparable food footprints to a shared, if imperfect, evidential baseline that policy, business, and the public could argue over on common terms.
Frequently Asked Questions
It is the largest analysis of food’s environmental impact ever assembled. Joseph Poore and Thomas Nemecek combined life-cycle data from 570 studies — covering about 38,700 farms in 119 countries and 40 products — into one comparable dataset, measuring five environmental impacts per unit of nutrition. It found food supplies around a quarter of global greenhouse-gas emissions and that the same product can vary up to 50-fold in impact depending on how and where it is produced.
Greenhouse-gas emissions (kg CO₂eq, GWP100), land use (m²·year), terrestrial acidification (g SO₂eq), eutrophication (g PO₄eq), and scarcity-weighted freshwater withdrawal (litres weighted by local water scarcity). A key finding is that these indicators correlate weakly, so a food that scores well on one can score poorly on another — ranking foods on carbon alone is misleading.
That the lowest-impact animal products typically still exceed the impacts of their plant-based substitutes across indicators, measured per unit of nutrition such as 100 g of protein. In other words, choosing a better-farmed animal product generally does not close the gap to the plant alternative — the ranking holds even at the low-impact end of animal production. The authors described this as new evidence for the importance of dietary change.
Producing the same food, to the same nutritional unit, can create up to fifty times the environmental impact depending on the producer, method, and location. This is arguably the study’s most important result: it means a single median footprint hides a wide distribution, the biggest mitigation gains come from targeting the highest-impact producers, and two identical-looking products can have very different planetary costs.
On 22 February 2019, Science published a formal erratum correcting specific values in the original paper, principally around land and the carbon consequences of dietary change — recognising a larger potential for carbon capture on land freed by reduced animal-product demand, and revising some animal-product figures. An erratum corrects values without retracting the study; this one reinforced rather than reversed the conclusions. Any quantitative use of the data should apply the corrected values.
That is the study’s headline figure: the food supply chain generates roughly 13.7 billion tonnes of CO₂eq per year, about 26% of anthropogenic greenhouse-gas emissions. Adding non-food agriculture and other drivers of deforestation (~2.8 billion tonnes, ~5%) brings agriculture and land use to about 31% of the global total. These are the figures as reported in the paper.
Because the study’s stage decomposition shows transport is a small share of most foods’ cradle-to-retail footprint — the farm stage and, for some products, land-use change dominate. Switching what you eat therefore moves the total far more than switching to local produce. This is the evidence base for the widely-cited conclusion that dietary composition matters more than food miles for most products’ climate footprint.
No — it is a dataset, not an accounting standard. In carbon accounting it serves as a source of globally representative secondary emission factors for food, useful for screening and estimation when primary data is unavailable. The governing methods remain the GHG Protocol Scope 3 Standard and ISO 14067; Poore & Nemecek supplies data those frameworks consume. Its global medians should be replaced with product- or region-specific data where materiality demands.
Our World in Data adapted the paper into accessible charts and is how most people encounter the figures. It uses the published values where available and calculates additional figures to fill gaps — for example, per-kilogram values where the paper gave only per-protein units. Those OWID-derived figures are adaptations, not original study outputs, and should be attributed to OWID as adapting Poore & Nemecek, not to the paper directly.
The main substantive criticisms are that it may under-credit well-managed grazing and soil-carbon sequestration, that land-use-change allocation is methodologically contested, that it is a 2010-median snapshot rather than current data, and that LCA coverage is uneven across regions. Much criticism aimed at the study is really about how it has been oversimplified downstream. None of these overturns the core findings, but they mean the data should be used with its vintage, median nature, and erratum attached.
Sources and References
Every numerical and methodological claim on this page reconciles to the primary sources below. The paper and its supplementary materials are the definitive record; the erratum is part of the citable record; secondary sources are used only for interpretation and are noted as such. All values are hardcoded to their dated source.
Primary source
- J. Poore & T. Nemecek, “Reducing food’s environmental impacts through producers and consumers,” Science 360(6392), 987–992 (1 June 2018). DOI: 10.1126/science.aaq0216.
- Supplementary Materials to Poore & Nemecek (2018) — methodology, inclusion criteria, full data tables, and sensitivity analyses (published with the article).
- Erratum, “Reducing food’s environmental impacts through producers and consumers,” Science 363(6429), eaaw9908 (22 February 2019). DOI: 10.1126/science.aaw9908.
- Accepted-manuscript version, Oxford University Research Archive (ORA), open access.
Dataset adaptation
- Our World in Data, “Environmental impacts of food production” and associated data explorers (GHG, land use, water, eutrophication per kg and per 100 g protein), adapting Poore & Nemecek (2018).
Methodological and scientific context
- ISO 14040:2006 and ISO 14044:2006 — Environmental management: Life cycle assessment, principles, framework, and requirements.
- ISO 14067 — Greenhouse gases: Carbon footprint of products.
- ecoinvent LCI database — background life-cycle inventory data underpinning much of the source literature.
- IPCC Assessment Reports — the GWP100 basis used for the greenhouse-gas indicator.
- GHG Protocol Corporate Value Chain (Scope 3) Standard and Land Sector and Removals Standard — the accounting frameworks that consume food-sector secondary factors.
Related GreenCalculus reference pages
- ISO 14040 / 14044 — Life Cycle Assessment
- ISO 14067 — Product Carbon Footprint
- ecoinvent LCI Database
- GHG Protocol Scope 3 Standard
- GHG Protocol Land Sector and Removals Standard
- Agriculture and AFOLU emissions
- Food product-carbon-footprint calculator
- Food product-carbon-footprint methodology
Editorial scope and methodology
Editorial scope. This page documents Poore & Nemecek (2018) as a fixed, published study with a single subsequent erratum. The dataset is not updated; its figures are a snapshot with a median reference year of 2010. Primary sources should be consulted for any quantitative application. GreenCalculus is independent of the authors and their institutions and provides this reference for informational and educational purposes.
Methodology. Every value is hardcoded against the paper, its supplementary tables, or the 2019 erratum, and figures adapted by third parties (e.g. Our World in Data) are attributed as adaptations. No live-reference shortcodes are used on this page — a published study is a historical record by construction. If the record changes (a further correction, a new adaptation), this page is reviewed and revised through the GreenCalculus changelog process at /changelog/.