
Food Product Carbon Footprints

A sector-specific method for calculating the cradle-to-grave carbon footprint of a food or beverage product: choosing the functional unit, drawing the system boundary at and beyond the farm gate, handling biogenic carbon and land use change at product level, allocating emissions across farm and processing co-products, and reconciling the answer across ISO 14067, the GHG Protocol Product Standard, and the EU Product Environmental Footprint. Aligned to ISO 14067:2018, the GHG Protocol Product Standard, PEF food category rules, the WBCSD PACT Pathfinder Framework, and IPCC AR6 global warming potentials.
This page is the food-sector execution layer. It takes the boundary and allocation rules from the PCF standards, the science from IPCC AR6, and the factors from the data layer, and tells you exactly how to turn one food product into a defensible carbon-footprint number. It does not re-derive the generic PCF mechanics — it points to them where they already live and concentrates on the decisions that are unique or uniquely hard for food.
This methodology is about the footprint of a single food product (one kilogram of cheese, one ready meal, one litre of plant drink) over its life cycle. It is distinct from three neighbouring methods. Corporate land-sector inventories and SBTi land targets are covered in the FLAG emissions methodology — that answers an organisational question, not a product one. The framework-agnostic boundary mechanics live in the cradle-to-gate and cradle-to-grave methodology pages, and the generic allocation hierarchy in the PCF allocation methodology. This page applies all of those specifically to food, where biogenic carbon, land use change, farm-gate co-products, and the functional-unit problem make the generic method insufficient on its own.
Provider directory
Now it has to hold up all year.
See who does this work. Every listing names the standards it works to, and paid placements are labelled. Including Attain Zero and KERAMIDA.
Browse 6 carbon accounting & inventory providers →Do this work? A listing is US$390 a year. Get listed →
What a Food Product Carbon Footprint Measures
A product carbon footprint (PCF) is the sum of greenhouse gas emissions and removals across the life cycle of a single product, expressed in carbon dioxide equivalent (CO₂e) per declared functional unit. For most manufactured goods the calculation is a supply-chain bill of materials run through emission factors. Food is the hard case: the largest share of a food product’s footprint is biological, not industrial, and the biological sources behave in ways that generic PCF methods do not anticipate.
Why food is the hard case for PCF
For a typical food product the farm stage dominates — frequently 60–90% of the cradle-to-grave total — and that farm stage is built from methane from enteric fermentation and manure, nitrous oxide from soil and fertiliser, biogenic CO₂ cycling through crops and animals, and carbon released or sequestered by changing land. None of these are constant per unit of output, all of them carry large measurement uncertainty, and several require accounting conventions (biogenic neutrality, land use change amortisation, co-product allocation) that have no analogue in a footprint for, say, a laptop. A food PCF that treats the farm as a single spend-based line item misses the point of the exercise.
The five food-specific divergences
Five decisions separate a food PCF from a generic one. Each is treated in full below; together they are the reason this page exists.
1 · Functional unit
A widget has one obvious unit. Food can be declared per kilogram, per kilogram of protein, per serving, or per unit of nutrition delivered — and the choice changes the ranking between products.
2 · Biogenic carbon
Crops absorb atmospheric CO₂ and release it on consumption or decay. The default treats this cycle as climate-neutral, but methane from biogenic carbon is not — and the bookkeeping must keep the two separate.
3 · Land use change
Converting forest or grassland to produce a commodity emits carbon that must be amortised into the product over a 20-year window — the single largest driver of variance for beef, soy, palm, and cocoa.
4 · Farm-gate allocation
A dairy farm yields milk and meat; an oil mill yields oil and meal. The split of farm emissions between co-products is a methodological choice that materially moves the answer.
5 · Use and loss
Cooking energy, refrigeration, and food loss and waste across the chain are in scope for a cradle-to-grave food PCF and are routinely omitted in weaker assessments.
Governing Frameworks for Food PCF
Four frameworks govern food PCF. They nest rather than compete — a lower layer supplies method, an upper layer supplies product-category specificity — but they are not numerically interchangeable, and a product footprint is only comparable to another calculated under the same framework with the same category rules.
standard
The anchor. Specifies principles, requirements, and guidelines for quantifying a product carbon footprint, building on the ISO 14040/14044 LCA framework. Defines the partial (cradle-to-gate) and full (cradle-to-grave) footprint, the treatment of biogenic carbon, land use change, and the rules for comparative assertions. Requires a product category rule (PCR) for any comparison.
framework
The corporate-reporting-aligned route to a product footprint. Closely harmonised with ISO 14067 on boundary and allocation, with its own inventory and reporting requirements. Often the framework of choice where a product PCF must roll up into a company’s Scope 3 inventory.
rules
The EU method, with binding Product Environmental Footprint Category Rules (PEFCRs) for specific food categories — dairy, feed, beer, pasta, packed water, and others. PEFCRs fix the functional unit, boundary, allocation, and default datasets for a category, which is what makes two PEF footprints in the same category comparable. The PACT Pathfinder rules below borrow heavily from PEF for primary-data exchange.
protocol
Not a competing accounting method but a harmonisation and data-exchange protocol — how a supplier’s verified cradle-to-gate PCF is calculated consistently and transmitted to a customer for their own footprint. Critical for food supply chains where primary data must move across many tiers. Builds on ISO 14067, the GHG Protocol Product Standard, and PEF.
For a side-by-side of how these four diverge on biogenic carbon, allocation defaults, and required comparability, see the dedicated PCF frameworks comparison methodology. The practical implication for food: pick one framework, declare it, apply its category rule end-to-end, and never blend defaults across frameworks inside a single footprint.
The same cheese calculated under PEF (with the dairy PEFCR’s fixed datasets and biophysical milk allocation) and under ISO 14067 (with supplier primary data and economic allocation) will produce different numbers — sometimes by 20% or more — without either being wrong. A footprint is only a comparative claim against another product calculated the same way. State the framework, the category rule, the allocation method, and the data vintage on every reported PCF, or the number cannot be checked or compared.
Functional Unit and the Reference Product
The functional unit (FU) is the quantified performance of the product against which all emissions are normalised. Everything in the footprint is expressed per FU, so the choice of FU is the first and most consequential decision in a food PCF — it can reverse the ranking between two products.
Mass-based vs nutritional functional units
Mass (per kilogram or per litre) is the default and is what most PEFCRs fix. It is simple, auditable, and appropriate when the product’s function is to deliver that mass. But food’s function is nutrition, and a mass-based FU flatters energy-dense, nutrient-poor products and penalises high-protein foods on a per-kilogram basis. Nutritional functional units — per kilogram of protein, per 100 kcal, or per unit of a composite nutrient-density score — capture this, at the cost of added complexity and contested weighting choices. The same product looks very different under each:
| Functional unit | Worked-example cheese value | Best when | Risk |
|---|---|---|---|
| Per kg product | 12.41 kg CO₂e/kg | Mass is the delivered function; category PEFCR fixes it | Penalises nutrient-dense foods; flatters bulky low-nutrition foods |
| Per kg protein | 49.63 kg CO₂e/kg protein | Comparing protein sources across categories | Ignores other nutrients; protein quality varies |
| Per serving (30 g) | 372 g CO₂e/serving | Consumer-facing labels; realistic portions | Serving size is arbitrary and gameable |
| Per 100 kcal | illustrative — derive from product energy density | Energy-delivery framing | Rewards calorie density over nutrition quality |
Choosing the reference product and declared unit
ISO 14067 separates the functional unit (the function delivered) from the reference flow (the quantity of product needed to deliver it) and the declared unit (used for a partial, cradle-to-gate footprint where the full function is not yet defined). For an intermediate food commodity sold business-to-business — bulk milk powder, refined oil, flour — a declared unit (per kilogram at the factory gate) is correct, because the downstream function is unknown at that point. For a finished consumer product, a full functional unit including the use phase is required for a cradle-to-grave claim. Fix this before any data collection: a footprint built to the wrong unit cannot be re-based without recalculation.
System Boundary for Food Products
The system boundary defines which life-cycle stages are inside the footprint. Food PCF uses two standard boundaries, and the farm gate is a structural divide within both.
Cradle-to-gate vs cradle-to-grave
A cradle-to-gate footprint (lca.boundary.cradle_to_gate in the methodology layer) runs from primary production to the point the product leaves the producing organisation’s gate — the correct boundary for a B2B intermediate and for the supplier PCF exchanged under Pathfinder. A cradle-to-grave footprint extends through distribution, retail, consumer use, and end of life — required for a consumer-facing product claim and for use-phase-dominated products. The boundary mechanics are framework-general and covered in the cradle-to-gate and cradle-to-grave methodology pages; what follows is the food-specific stage map.
The farm gate as a boundary
The farm gate is to a food PCF what the factory gate is to a manufactured-goods PCF: the point at which primary production ends and processing begins, and the point at which farm-level co-product allocation is resolved. Everything upstream of it — animals, crops, feed, fertiliser, on-farm energy, land use change — is primary production and carries the biological emission sources. Everything downstream is processing and logistics, which behave like a conventional industrial footprint. Drawing the gate cleanly is what lets a processor combine a supplier’s cradle-to-farm-gate PCF with its own gate-to-gate emissions without double counting.
Life-cycle stages in scope
The dashed line after stage 1 marks the farm gate — the cradle-to-farm-gate cut used for supplier PCF exchange. Stages 1–3 give the partial cradle-to-gate footprint; stages 1–7 give the full cradle-to-grave footprint.
Biogenic Carbon and Land Use Change at Product Level
This section is the heart of what makes food PCF different. Two biological carbon flows — biogenic CO₂ cycling and land use change — must be accounted for at the level of a single product, using conventions that have no equivalent in an industrial footprint.
Biogenic CO₂ accounting
Biogenic carbon is carbon that was recently absorbed from the atmosphere by a growing crop. When that crop is eaten, processed, or decays, the same carbon returns to the atmosphere. Under ISO 14067 and the GHG Protocol Product Standard the default treatment sets the characterisation factor for biogenic CO₂ uptake and release to zero — the cycle is climate-neutral over the assessment period, so biogenic CO₂ in and biogenic CO₂ out cancel. In the methodology layer the default biogenic-CO₂ global warming potential is 0 (dimensionless), and the stoichiometric uptake convention is 3.667 kg CO₂ per kg of biogenic carbon.
Biogenic CO₂ is neutral by default; biogenic methane is not. When biogenic carbon is released as CH₄ — enteric fermentation, manure, anaerobic decay of food waste — it has a warming effect over its atmospheric lifetime before oxidising back to CO₂. It must be counted at its global warming potential, AR6 GWP-100 biogenic CH₄ = 27 [GreenCalculus gwp.CH4_biogenic.ar6_100 · IPCC AR6 · v2026.203], not zeroed with the biogenic CO₂. The accounting rule: the biogenic carbon cycle nets to zero on the CO₂ leg, and the methane leg carries the GWP charge. Conflating the two — zeroing biogenic methane because “the carbon was atmospheric” — is the single most common error in farm-stage food footprints, and on a ruminant product it understates the farm stage by an order of magnitude.
Biogenic carbon temporarily stored in a durable product (for instance, carbon locked into long-life packaging or a stored agricultural product) may be credited only where storage exceeds the permanence threshold the framework sets — in the methodology layer, 100 years. Below that threshold, no storage credit applies. Most food products turn over far faster than this, so storage credits are rare in food PCF and must be justified explicitly when claimed.
Direct vs statistical land use change for a product
Land use change (LUC) is the carbon released when natural ecosystem is converted to produce a commodity. At product level the same direct-versus-statistical choice applies as in corporate land accounting, driven by how far the product is traceable to a specific parcel:
Worked sLUC mini-example, embodied in a product: if 1 kg of milk embodies 0.4 kg of imported soy in feed, and the illustrative regional sLUC factor for that soy is 3.2 kg CO₂e per kg, the feed-LUC contribution is 0.4 × 3.2 = 1.28 kg CO₂e per kg milk before allocation. The farm N₂O side of feed production is covered separately in the fertiliser and soil N₂O methodology.
The 20-year LUC amortisation
Direct LUC carbon is spread evenly across a 20-year window from the year of conversion, matching the IPCC convention and the GHG Protocol Land Sector and Removals Standard. The methodology layer expresses the annual amortisation share as 5% per year. The dLUC equation at parcel level:
For illustration, converting 100 ha of forest (120 tC/ha) to cropland (30 tC/ha) releases (120 − 30) × 3.667 × 100 = 33,000 tCO₂ total, or 1,650 tCO₂ per year across the 20-year window, then divided over the parcel’s annual commodity output to reach a per-kilogram LUC factor. Restating supplier traceability does not zero out conversion already inside the 20-year window — a feature that prevents gaming the cutoff.
Allocation at the Farm Gate
Most agricultural systems produce more than one output. A dairy farm produces milk and meat; an oilseed crush produces oil and meal; a cereal harvest produces grain and straw. The footprint of the system must be divided between these co-products, and the division method is a methodological choice with a large effect on the answer. ISO 14067 sets the hierarchy — avoid allocation by subdivision or system expansion where possible, then allocate by an underlying physical relationship, then by another relationship such as economic value. The generic hierarchy is detailed in the PCF allocation methodology; the food-specific decision is which physical or economic basis applies at the farm gate.
Economic, biophysical, and mass allocation
The dairy co-product decision, worked
The three methods give materially different answers for the same farm. Take an illustrative dairy farm producing 1,000,000 kg of milk and 50,000 kg of liveweight meat (cull cows and surplus calves) per year, with a total farm footprint of 1,230,000 kg CO₂e:
| Method | Basis | Share to milk | Milk footprint |
|---|---|---|---|
| Mass | 1,000,000 ÷ (1,000,000 + 50,000) | 95.2% | 1.171 kg CO₂e/kg |
| Economic | milk £450,000 ÷ (milk £450,000 + meat £125,000) | 78.3% | 0.963 kg CO₂e/kg |
| Biophysical (IDF) | 1 − 6.04 × (meat ÷ milk) | 69.8% | 0.859 kg CO₂e/kg |
The spread between mass and biophysical allocation is 0.31 kg CO₂e/kg milk — a 27% swing on the same farm, the same emissions, and the same product. This is why the method must be fixed by the category rule and disclosed: it is not a rounding detail.
Emission Sources Across the Food Chain
A complete food PCF accounts for every emission source across the seven stages. The table maps each source to its stage, dominant gas, and the methodology or factor source that quantifies it. Farm-stage gases carry their AR6 GWP-100 charge — biogenic CH₄ at 27 [GreenCalculus gwp.CH4_biogenic.ar6_100] and N₂O at 273 [GreenCalculus gwp.N2O.ar6_100 · IPCC AR6 WGI Ch 7 Table 7.SM.7 (2021) — AR6 GWP-100].
| Source | Stage | Dominant gas | Quantified by |
|---|---|---|---|
| Enteric fermentation | Farm | Biogenic CH₄ | IPCC Tier 1/2 livestock factors × GWP; see FLAG methodology |
| Manure management | Farm | Biogenic CH₄ + N₂O | IPCC manure factors by AWMS and climate × GWP |
| Fertiliser and soil N₂O | Farm | N₂O | Fertiliser and soil N₂O methodology |
| Rice cultivation | Farm | Biogenic CH₄ | IPCC rice CH₄ factors × GWP |
| Feed production (incl. feed LUC) | Farm | CO₂ + N₂O | Crop LCI + sLUC factor on embodied feed mass |
| On-farm energy | Farm | Fossil CO₂ | Fuel and grid factors — not biological, behaves like an industrial source |
| Process energy (thermal + electric) | Processing | Fossil CO₂ | Fuel and grid factors per unit processed |
| Processing refrigerant loss | Processing | HFCs | Refrigerant leakage mass-balance |
| Packaging embodied carbon | Packaging | Fossil CO₂ | Material LCI factors per packaging mass |
| Distribution + cold-chain energy | Distribution | Fossil CO₂ + HFCs | Freight factors + refrigerated-transport energy + refrigerant loss |
| Retail refrigeration | Retail | Fossil CO₂ + HFCs | Store energy allocated to product + display refrigerant loss |
| Consumer cooking + refrigeration | Use | Fossil CO₂ | Use-phase energy model per cooking/storage scenario |
| Food waste + packaging end-of-life | End of life | Biogenic CH₄ + CO₂ | IPCC waste-treatment factors by disposal route |
The pattern to notice: the farm stage is biological and methane-dominated, every stage after the farm gate is industrial and fossil-CO₂-dominated, and the two halves require different factor sources and different gas treatment. The boundary between them is the farm gate.
Data Quality and Emission Factor Sources
Food PCF data follows the same hierarchy as any inventory — primary supplier data outranks secondary database data — but food has two characteristics that make data quality harder: the farm stage carries the largest uncertainty and the largest share of the footprint at once, and food LCI databases differ enough that the database choice itself moves the answer.
Use this priority order: primary supplier-specific data > regional secondary data matched to actual sourcing > generic database average > proxy. The principal secondary sources for food are ADEME’s Agribalyse (the French national food LCI database, EU-applicable methodology), the World Food LCA Database, and ecoinvent for background processes. Whichever is used, the dataset, its version, and its geography are part of the footprint and must be disclosed.
PEF and Pathfinder both require a data quality rating (DQR) scored on technological, geographical, and temporal representativeness plus completeness. A footprint built on default proxies scores poorly and is unsuitable for a comparative claim; the path to a defensible food PCF runs through replacing the highest-impact secondary factors — usually the dominant farm ingredient — with primary or regionally matched data first.
The same product modelled in Agribalyse, the World Food LCA Database, and ecoinvent can differ by 20–40% on the farm stage alone, because of different system models, allocation defaults, and LUC treatment baked into each database. This is not a data error — it is a methodological difference that propagates silently into the footprint. Never mix datasets from different databases inside one product model without confirming they share system-model and allocation conventions, and never compare a footprint built in one database to one built in another as if the difference were real-world performance.
The Food PCF Calculation Workflow
The full calculation chains the preceding decisions into one equation. The footprint per functional unit is the sum of stage emissions, each adjusted for allocation and grossed up for food loss and waste downstream of the farm gate, all divided by the functional output.
Build it in stage order: quantify each stage’s gross emissions, apply the allocation factor at the farm gate and at processing, sum to the boundary you are reporting (gate or grave), gross up for loss and waste, and normalise to the functional unit. The worked example below runs the full chain end to end.
Worked Example: 1 kg Semi-Hard Cheese, Cradle-to-Grave
A complete food PCF computed end to end, every figure shown. All factors are illustrative and hardcoded as an audit record at this revision’s snapshot date; gases are charged at AR6 GWP-100. This demonstrates the method — it is not a reference footprint for cheese.
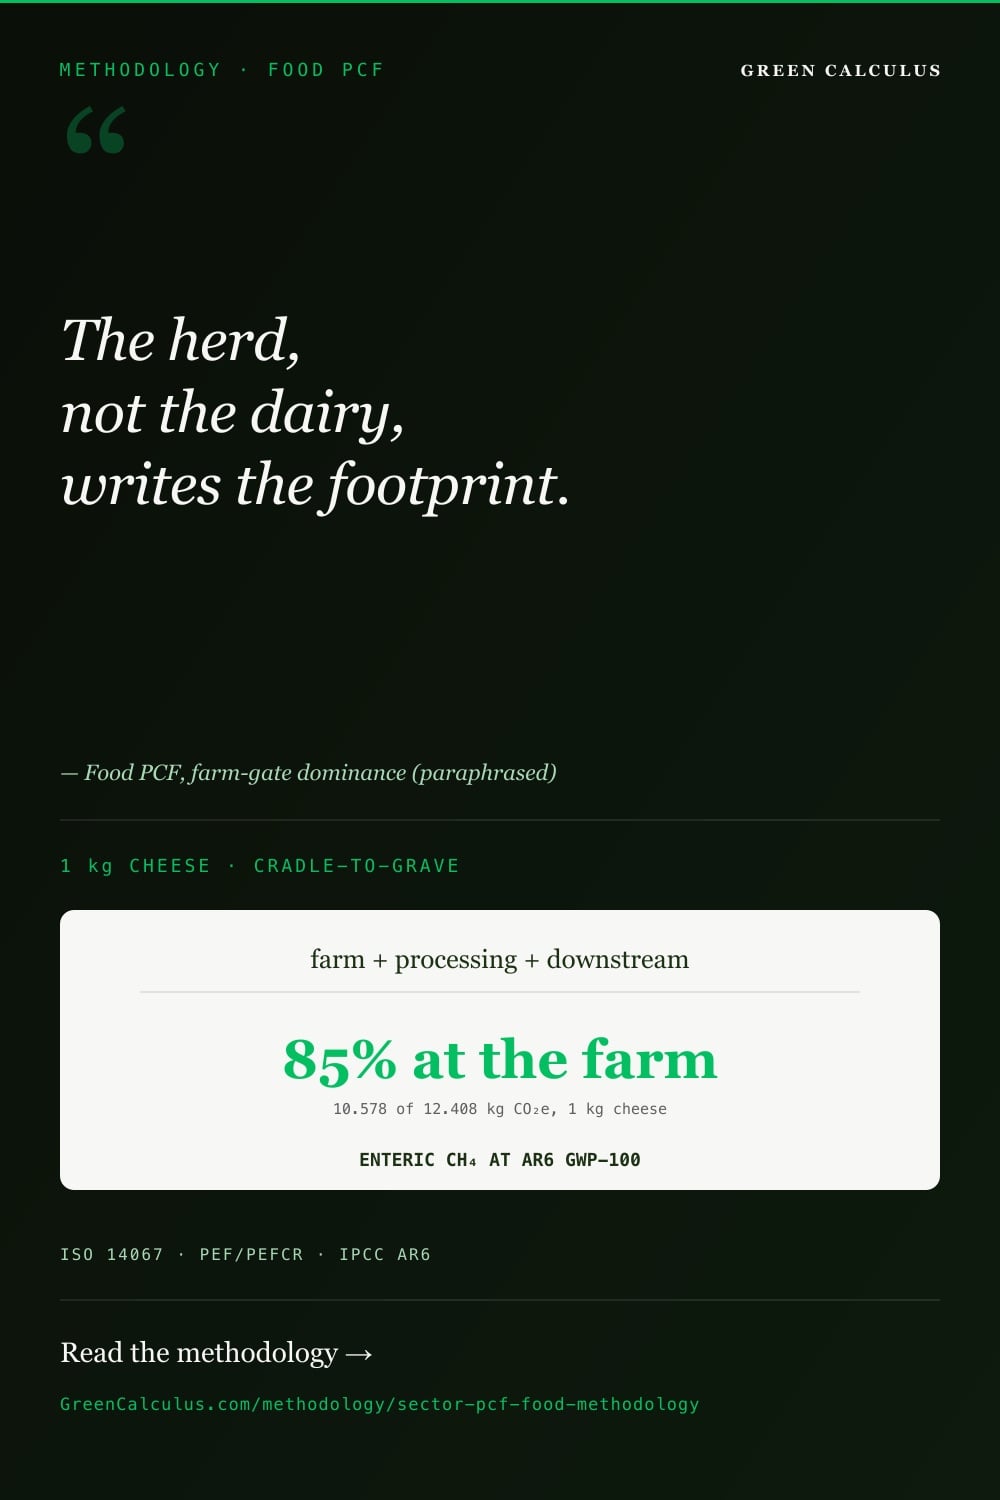
The farm stage is 10.578 of 12.408 kg CO₂e — 85.3% of the cradle-to-grave total before loss gross-up, which is typical for a ruminant dairy product and confirms where mitigation effort and data-quality investment belong. Expressed against alternative functional units (per the §3 table): 49.63 kg CO₂e per kg protein, or 372 g CO₂e per 30 g serving. The 12% food-loss gross-up lifts the per-kg figure from 12.41 to 14.10 kg CO₂e — the burden of product lost downstream is carried by the product that survives to consumption.
This worked example is hand-computed for transparency. A production food PCF with full audit trail belongs in a dedicated calculator — none is published for this method yet; track the PCF frameworks comparison methodology and the IPCC AFOLU factor data in the interim.
Food Loss and Waste in PCF
Food loss and waste (FLW) is product that is grown or made but never consumed. Its emissions do not vanish — they are redistributed onto the product that does reach consumption, because the footprint is normalised per functional unit delivered, not per unit produced. A food PCF that ignores FLW understates the footprint of the consumed product.
The convention is to gross up the surviving product’s footprint by the cumulative loss fraction downstream of the accounting point: surviving footprint = stage footprint ÷ (1 − FLW). Loss compounds along the chain, so the fraction grows from farm gate to plate. Indicative stage loss rates vary widely by product and region — perishable produce loses far more than shelf-stable goods — and must be sourced for the specific product rather than assumed:
| Stage | Loss mechanism | PCF treatment |
|---|---|---|
| Post-harvest / processing | Trim, spoilage, off-spec rejection | Gross up upstream footprint onto saleable output |
| Distribution + retail | Damage, date expiry, over-ordering | Gross up cradle-to-retail footprint onto sold product |
| Consumer | Plate waste, fridge spoilage, over-purchase | Gross up onto consumed product; waste emissions added at end of life |
Verification, Comparability, and Carbon Claims
A food PCF intended for external use — a label, a customer disclosure, a marketing claim — must clear a higher bar than an internal screening footprint.
- Critical review for comparative assertions. ISO 14067, built on ISO 14040/14044, requires an independent critical review (panel review for public comparative assertions). Verification of the underlying inventory follows ISO 14064-3 principles. A comparison between two products is only valid where both share functional unit, boundary, allocation method, and data vintage.
- Comparability is conditional. Two footprints are comparable only under the same framework and category rule. A PEF-based footprint and an ISO-14067-based footprint of the same product are not directly comparable, and presenting them as if they were is a misrepresentation — see the framework warning in §2.
- Neutrality and offset claims sit on top, not inside. A “carbon neutral” claim invokes ISO 14068-1 or PAS 2060, which require the PCF first and then govern the reduction-and-offset claim built on it. The footprint is the input; the neutrality claim is a separate, additional assertion with its own evidence requirements.
- Disclosure is the integrity control. Every reported food PCF states its functional unit, framework, category rule, boundary, allocation method, GWP basis, and data vintage. A footprint number without this metadata cannot be verified, compared, or trusted — and in the EU, an unsubstantiated comparative environmental claim is a regulated greenwashing exposure.
Error Traps with Calculable Magnitudes
The errors below are specific to food PCF and each produces a quantifiable distortion. Magnitudes are illustrated against the worked-example cheese where applicable.
| Error | What happens | Magnitude | How to avoid |
|---|---|---|---|
| Zeroing biogenic methane | Treating enteric and manure CH₄ as climate-neutral because the carbon was atmospheric. | Understates farm stage ~28× on the methane component — biogenic CH₄ is charged at GWP 27.9, not zero. |
Net biogenic CO₂ to zero; charge biogenic CH₄ at its AR6 GWP. The two legs are accounted separately. |
| Wrong allocation basis | Using mass allocation where the category rule mandates biophysical, or undisclosed economic allocation. | ~27% swing milk: 1.171 (mass) vs 0.859 (IDF) kg CO₂e/kg — same farm. |
Use the method the PCR/PEFCR fixes; disclose it. Never pick the method that flatters the result. |
| Omitting land use change | Excluding feed or ingredient sLUC because it is hard to source. | Can be the largest single term for beef, soy, palm, cocoa — omission can halve the apparent footprint. |
Apply dLUC or sLUC per the §5 decision; never drop the term. Use a screening factor until traceability improves. |
| Ignoring food loss and waste | Normalising per unit produced rather than per unit consumed. | +14% in the example 12.41 → 14.10 kg CO₂e/kg at 12% cumulative FLW. |
Gross up surviving product by 1 ÷ (1 − FLW); add consumer-waste emissions at end of life. |
| Mixing LCI databases | Combining Agribalyse, WFLDB, and ecoinvent rows with different system models in one product. | 20–40% farm-stage drift from inconsistent allocation and LUC conventions across databases. |
Use one database family per product, or confirm system-model and allocation consistency before mixing. |
| Wrong functional unit for the claim | Comparing a high-protein and a low-protein food per kilogram instead of per unit of nutrition. | Ranking can reverse per-kg vs per-kg-protein change relative standing entirely. |
Match the FU to the function being compared; declare it; never switch FU mid-comparison. |
| Blending frameworks | Taking a PEF default dataset into an ISO 14067 economic-allocation model. | Uncheckable result defaults assume a framework’s full method; mixing breaks comparability. |
Pick one framework and its category rule; apply end to end; declare it. |
Methodology Metadata for Inventory Documentation
Copy into the methodology statement of a food PCF report for transparency. Adjust the framework, category-rule, allocation, and data-vintage lines to the actual assessment.
PCF methodology series. Core methods: cradle-to-gate, cradle-to-grave, allocation, frameworks comparison, sensitivity & hotspots. Sector methods: food, apparel & textile, electronics, packaging, beverages.
Choosing between the sector methods. This is one of five sector product-carbon-footprint methods. For which one applies to a given product, what all five share, and why the emissions hotspot sits in a different life-cycle stage in each, see Sector Product Carbon Footprints.
Frequently Asked Questions
Yes. Biogenic carbon dioxide is treated as neutral because the same carbon was recently absorbed by the crop and returns to the atmosphere as CO₂ — uptake and release cancel. But when that carbon is released as methane instead of CO₂, it spends decades in the atmosphere as a far stronger warming agent before oxidising back to CO₂. That warming is real and is charged at the AR6 GWP-100 for biogenic methane, 27 [GreenCalculus gwp.CH4_biogenic.ar6_100], not zeroed. Netting biogenic CO₂ to zero is correct; extending that to methane is the most common and most damaging error in farm-stage food footprints.
It depends on what the footprint is for. Per kilogram is the default, is auditable, and is what most PEF category rules fix — use it when mass is the delivered function or when the category rule requires it. A nutritional functional unit (per kilogram of protein, per 100 kcal, or a nutrient-density score) is more appropriate when comparing the climate cost of delivering a nutrient across different product types, because a per-kilogram basis penalises nutrient-dense foods and flatters bulky low-nutrition ones. The key rule is to declare the functional unit and never switch it inside a comparison — the choice can reverse the ranking between two products.
They answer different questions with shared science. The FLAG methodology covers an organisation’s land-sector greenhouse gas inventory and its science-based reduction target — a corporate accounting and target-setting exercise. This page covers the footprint of a single food product over its life cycle — a product accounting exercise for a label or a customer disclosure. Both use IPCC AFOLU science, biogenic carbon conventions, and land-use-change accounting, but FLAG aggregates emissions to a company boundary while a food PCF allocates them down to one kilogram of product. A company can have a FLAG target and PCFs for its products simultaneously; they are not substitutes.
Because the answer depends on choices that are all legitimate but not interchangeable: the framework (ISO 14067, GHG Protocol Product, PEF, Pathfinder), the allocation method at the farm gate, the LCI database, the land-use-change treatment, and the data vintage. The same cheese under the dairy PEFCR with biophysical allocation and fixed default datasets can differ by 20% or more from the same cheese under ISO 14067 with supplier primary data and economic allocation — without either being wrong. This is why a footprint is only a comparative claim against another product calculated identically, and why every reported PCF must disclose its full method.
For a cradle-to-grave footprint, yes — both are in scope. Consumer cooking and refrigeration are use-phase emissions and can dominate for products needing long cooking or freezing, while being near-zero for ready-to-eat foods. Food loss and waste is handled by grossing up the surviving product’s footprint, because emissions from product that is never consumed are redistributed onto the product that is. For a cradle-to-gate footprint — the boundary used for a business-to-business intermediate or a supplier PCF exchanged under Pathfinder — neither is included, because the boundary ends at the producing organisation’s gate. Match the inclusion to the boundary you are reporting.
Primary supplier-specific data always outranks any database. Where secondary data is needed, the principal food sources are ADEME’s Agribalyse, the World Food LCA Database, and ecoinvent for background processes. The important rule is consistency: each database carries its own system model, allocation defaults, and land-use-change treatment, and the same product can differ by 20–40% on the farm stage between them. Use one database family per product model, disclose the dataset, version, and geography, and prioritise replacing the highest-impact secondary factor — usually the dominant farm ingredient — with primary or regionally matched data first.
The PCF is the necessary first step but not the claim itself. A carbon-neutral claim is governed by ISO 14068-1 or PAS 2060, which require a quantified footprint and then add their own requirements for reduction commitments and the quality and retirement of any offsets. The footprint is the input; neutrality is a separate assertion with its own evidence bar. In the EU, an unsubstantiated comparative or neutrality claim is a regulated greenwashing exposure, so the underlying PCF must be method-disclosed and, for comparative assertions, critically reviewed before any public claim is built on it.