
Plastics and Packaging Embodied Emissions

A drinks bottle, a corrugated case, a film wrap — each is a few grams of material and a decade of accounting argument. The carbon of packaging is rarely contested at the factory gate; it is contested at the two seams where the rules are softest: how recycled content is credited, and what happens at end-of-life.
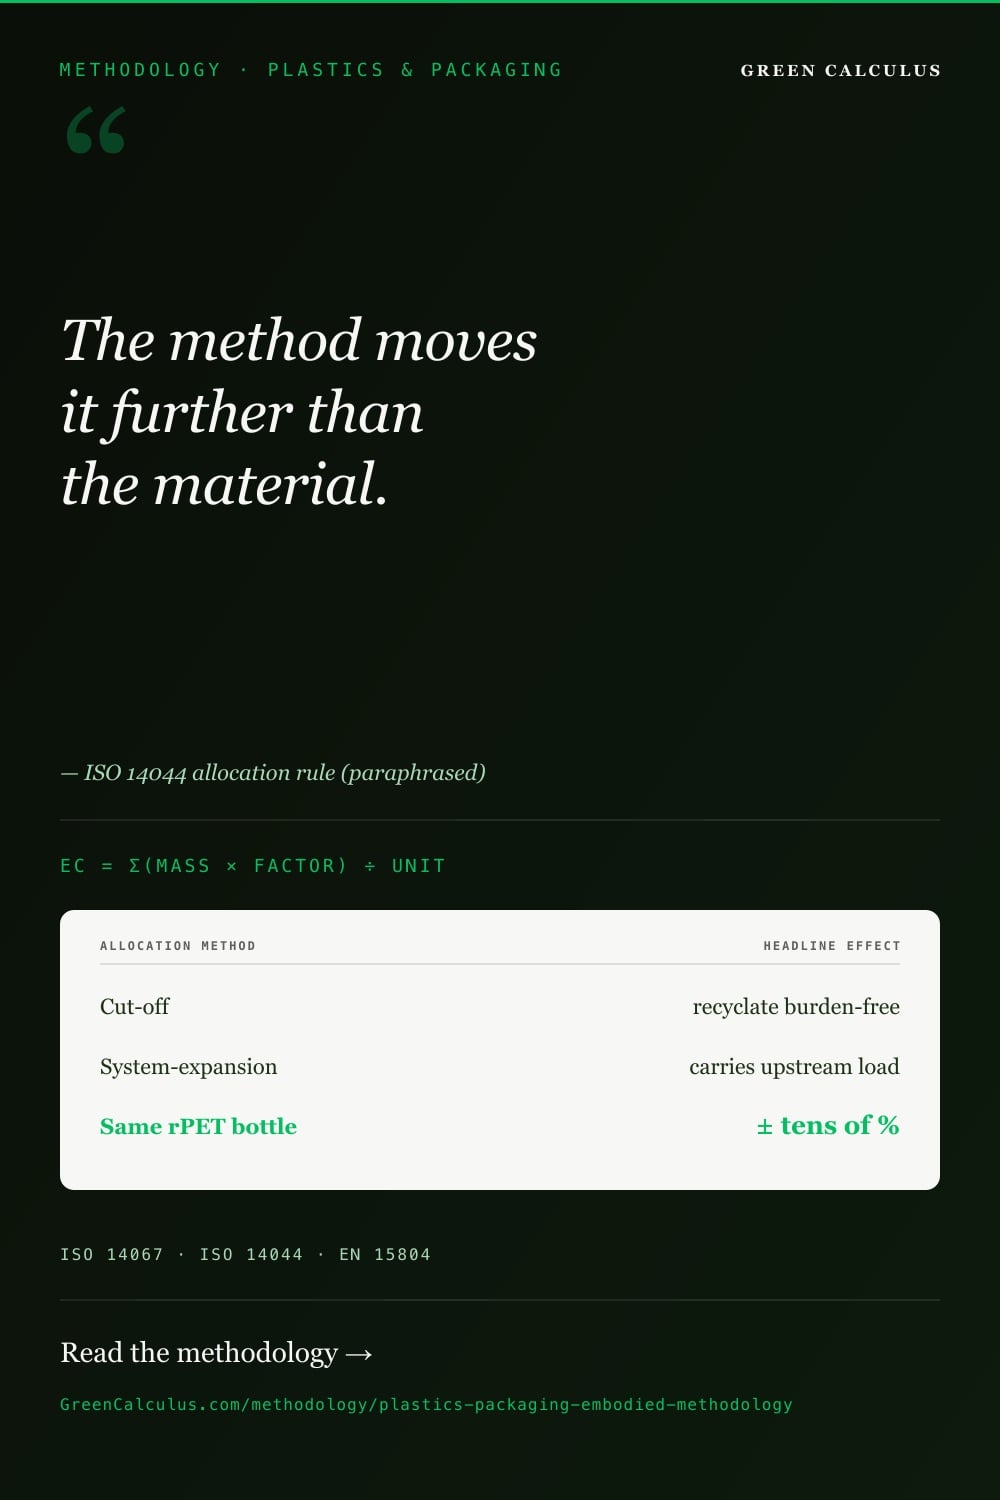
For most packaging, the allocation method you choose moves the number further than the material you specify.
Packaging embodied carbon is each material's mass × its cradle-to-gate factor, normalised to a functional unit, with recycled content credited by a stated allocation method. Biogenic carbon and the end-of-life route are reported separately.
Put this into practice with the Embodied Carbon — Plastics & Packaging Calculator, which implements the method described on this page.
What Plastics and Packaging Embodied Carbon Covers
Packaging embodied carbon is the cradle-to-gate (and, where the boundary extends, cradle-to-grave) greenhouse-gas burden of the materials that protect, contain and present a product. It spans rigid and flexible plastics, fibre-based board and paper, and the multi-material laminates that combine them. Unlike structural building materials, packaging is short-lived, high-volume, and tightly coupled to a downstream waste stream — so its accounting is dominated by feedstock origin (virgin vs recycled) and by what happens after a single use.
1.1 Polymer families
The high-volume packaging polymers each carry a distinct cradle-to-gate profile driven by their feedstock and polymerisation route:
- PET (polyethylene terephthalate) — bottles and trays; the most commonly recycled packaging polymer, with a mature recycled grade (rPET) whose factor depends heavily on the recycling allocation method.
- HDPE / LDPE (high- and low-density polyethylene) — bottles, films, caps. LDPE film dominates flexible packaging.
- PP (polypropylene) — caps, tubs, films, fibres.
- PVC (polyvinyl chloride) — rigid trays and some films; chlorine chemistry gives it a distinct end-of-life profile.
- PS / EPS (polystyrene, expanded polystyrene) — trays and protective packaging.
- Bio-based plastics — PLA (polylactic acid) and bio-PE, which introduce biogenic carbon and a different end-of-life logic (see §8).
1.2 Fibre-based packaging (paper and board)
Kraft paper, corrugated board and cartonboard carry biogenic carbon from their wood-pulp feedstock and a recycling loop that is well-established but quality-limited (fibres shorten with each cycle). Fibre packaging’s cradle-to-gate factor is sensitive to the recycled-content fraction and to the energy mix of the mill, and its biogenic carbon must be tracked explicitly rather than assumed neutral.
1.3 Multi-material and composite packaging
Laminate cartons, metallised films and barrier structures combine polymer, fibre and sometimes aluminium in thin layers that cannot be mechanically separated. These resist clean recycling and are the hardest packaging to account for: each layer carries its own cradle-to-gate factor, and the composite’s end-of-life route is usually incineration or landfill rather than recycling, which changes both the C-module and any recycling credit.
| Family | Typical formats | Dominant accounting driver | Biogenic carbon? |
|---|---|---|---|
| PET | Bottles, trays | Recycled-content allocation (rPET) | No (fossil) |
| HDPE / LDPE | Bottles, film, caps | Virgin vs recycled feedstock | No (fossil) |
| PP / PS / EPS / PVC | Tubs, trays, protective | End-of-life route | No (fossil) |
| Bio-plastics (PLA, bio-PE) | Cups, films | Biogenic uptake / release symmetry | Yes |
| Paper / board | Cartons, corrugated cases | Recycled fibre fraction + biogenic carbon | Yes |
| Multi-material laminate | Cartons, barrier films | Per-layer factors; non-recyclable EoL | Partial |
Provider directory
Now it has to survive the next design change.
See who does this work. Every listing names the standards it works to, and paid placements are labelled. Including Circular Ecology and Enviropass Consulting.
Browse 4 embodied carbon & LCA providers →Do this work? A listing is US$390 a year. Get listed →
The Functional-Unit Problem
Before any factor is applied, the assessment must fix a functional unit — the basis on which the result is expressed and compared. Packaging is uniquely prone to functional-unit errors because it is bought by mass, used per pack, and judged per delivered product, and these three bases do not move together.
- Per kilogram of material. The basis of the underlying emission factors. Correct for factor application, but a poor basis for comparison — a lighter package that protects the product better can carry more carbon per kilogram yet less per delivered product.
- Per pack (per unit of packaging). Mass of each material in one pack × its factor, summed. The basis for a single SKU’s footprint.
- Per delivered product (the functional unit). The carbon of packaging required to deliver a defined quantity of product intact to the consumer — the only basis on which two packaging designs can be fairly compared, because it captures lightweighting, product protection, and waste avoidance together.
Comparing two designs per kilogram of packaging rewards heavy, over-protective packaging and penalises efficient lightweighting. Comparing per delivered product — including any product loss the packaging prevents — is the only fair basis. A flexible pouch may carry more carbon per kilogram than a rigid bottle yet far less per litre of product delivered. Fix the functional unit first; apply factors second.
Life-Cycle Module Structure
Packaging embodied carbon is reported by life-cycle module, using the module convention shared across ISO 14067, the GHG Protocol Product Standard and EN 15804. The module a figure belongs to determines what it can be compared against — a cradle-to-gate figure and a cradle-to-grave figure for the same package can differ by a wide margin once end-of-life is included.
A1–A3 · cradle-to-gate
Raw-material supply, transport to the converter, and conversion (polymerisation, extrusion, moulding, forming). The dominant module for most packaging and the one carried by a product EPD’s headline figure.
A4–A5 · distribution & fill
Transport of empty packaging to the filling line (A4) and any packaging waste at filling (A5). Smaller than A1–A3 for most formats but not negligible for heavy or long-haul packaging.
C1–C4 · end-of-life
Collection, sorting, and treatment of the used package — recycling, incineration or landfill. For packaging this module is large relative to the product stage and is where most accounting disputes arise (see §9).
D · beyond the boundary
Net benefits from recycling and energy recovery beyond the package’s life — reported separately, never netted into the A–C total. The recycling credit for recovered polymer and fibre lives here.
The boundary an assessment claims must be stated explicitly. The MasterBrain lca methodology section carries the boundary definitions used across these frameworks — lca.boundary.cradle_to_gate and lca.boundary.cradle_to_grave are the two boundaries a packaging assessment selects between.
Where Packaging Sits in the GHG Inventory
Packaging appears in a corporate Scope 3 inventory in two distinct categories, depending on whether the reporting entity buys the packaging or sells a product wrapped in it.
- Purchased packaging → Scope 3 Category 1 (Purchased Goods and Services). A brand owner or co-packer buying bottles, film and cases books the cradle-to-gate (A1–A3) embodied carbon of that packaging as Cat 1 in the year of purchase. Embodied-material rows in the dataset carry
scope='scope3_cat1'for this purchased-goods framing. - End-of-life of sold packaging → Scope 3 Category 12 (End-of-Life Treatment of Sold Products). The downstream treatment of packaging that leaves with a sold product is the seller’s Category 12 emission. The end-of-life treatment methodology covers the IPCC waste-model basis for this module.
All packaging carbon is expressed in CO₂-equivalent, with cradle-to-gate factors aggregating the upstream well-to-tank energy and feedstock emissions of polymer and fibre production. The same physical package can therefore appear as Cat 1 embodied carbon for the buyer and Cat 12 end-of-life carbon for the seller — two different reporting entities, two different categories, one physical material.
Governing Standards
These element-level factors roll up into the building-scale whole-building LCA methodology and the RICS whole life carbon methodology; for design-option comparisons, see the material-substitution methodology.
Packaging embodied-carbon assessment nests several standards. Unlike building materials, where EN 15978/EN 15804 dominate, packaging sits primarily in the product-carbon-footprint family.
ISO 14067 — product carbon footprint
The primary standard for a packaging PCF: quantification rules, the cradle-to-gate vs cradle-to-grave boundary, biogenic-carbon treatment, and the allocation requirements. The MasterBrain biogenic and boundary rules are anchored to ISO_14067_2018.
GHG Protocol Product Standard
The corporate-aligned product accounting framework, used where packaging carbon must reconcile with a Scope 3 inventory rather than a standalone product claim.
ISO 14040 / 14044
The LCA backbone — goal and scope, inventory analysis, and the allocation hierarchy that governs how recycled-content burden is split. The cut-off and system-expansion rules trace here.
EU PEF & WBCSD Pathfinder
The Product Environmental Footprint method (with its Circular Footprint Formula) and the Pathfinder product-footprint exchange framework — the two frameworks driving comparable, exchangeable packaging PCFs.
For factor data, the hierarchy runs from product-specific EPDs to background LCI. The ecoinvent database is the usual source of generic polymer and fibre factors where a product EPD is unavailable, and it underlies most packaging PCF tools. The sibling material methodologies for timber and bio-materials (the biogenic-carbon companion), steel and aluminium, and the building envelope share the same module method with different factor families.
The Calculation Method
6.1 The master equation
ECmodule = Σ ( mi × EFi,module ) ÷ FU
where mi is the mass of material i in the package (kg), EFi,module is that material’s emission factor for the module (kg CO₂e per kg), and FU is the functional unit (e.g. number of delivered products). The factor already embeds the recycled-content allocation choice (§7); the biogenic and end-of-life modules are reported alongside, not folded in.
6.2 From bill of materials to functional unit
The takeoff is a bill of materials: each component’s mass and polymer/fibre grade. Packaging factors are almost always declared per kilogram, so unit reconciliation is simpler than for bulk building materials — the discipline shifts from unit conversion to feedstock attribution (what fraction is virgin, what fraction recycled) and to selecting the allocation method that governs how that split is credited.
The Recycled-Content Allocation Problem
This is the single most consequential decision in packaging accounting. When a package contains recycled material, or is itself recycled at end-of-life, the burdens and credits of recycling must be split between the product that supplies the recyclate and the product that uses it. Different allocation methods split that burden differently — and they can move the headline figure of a recycled-content package by tens of percent without changing a single gram of material.
The MasterBrain lca section encodes the ISO 14044 allocation hierarchy. The recycled-content special case sits at rank 7 [GreenCalculus lca.allocation.hierarchy.special.cut_off_recycled_content · ISO 14044 2006 · v2026.203] (rank (7 = special-case method)) in that hierarchy — a methodological ranking, not a carbon value. Three methods are in mainstream use.
7.1 Cut-off (recycled-content / 100:0) method
The cut-off method assigns the burden of producing recyclate to the product that uses it, and gives the product that discards material to recycling no credit. Recycled input enters the using product carrying only the (low) burden of the recycling process itself, not the virgin production it displaces. It is simple, avoids double-counting, and rewards using recycled content — which is why it is the default in many corporate and EPD contexts.
7.2 System-expansion / avoided-burden (0:100) method
System expansion credits the product that supplies material to recycling with the virgin production it avoids downstream, and charges the using product the full burden of the recyclate’s prior life. It rewards designing for recyclability and end-of-life recovery rather than recycled-content use. The two methods can produce materially different results for the same package, which is why the chosen method must be stated and held constant across any comparison.
7.3 PEF Circular Footprint Formula (CFF)
The EU Product Environmental Footprint method requires the Circular Footprint Formula, which blends recycled-content and end-of-life-recycling credit through an allocation factor and material quality ratios. The MasterBrain records that CFF is required under PEF — lca.pef.recycling.cff_required renders 1 [GreenCalculus lca.pef.recycling.cff_required · EU PEF 2021] (boolean) — and that Pathfinder recommends CFF alignment (lca.pathfinder.pcf.recycling.cff_alignment_recommended = 1 [GreenCalculus lca.pathfinder.pcf.recycling.cff_alignment_recommended · WBCSD PATHFINDER]). The CFF allocation factor and quality ratios are method parameters defined in the JRC guidance text, not numeric dataset rows — they are applied per the published CFF, not looked up.
| Method | Rewards | Credits recycled content? | Credits end-of-life recycling? | Typical use |
|---|---|---|---|---|
| Cut-off (100:0) | Using recycled input | Yes (low recyclate burden) | No | EPDs, many corporate PCFs |
| System expansion (0:100) | Designing for recovery | No (full prior-life burden) | Yes (avoided virgin credit) | Consequential LCA, recyclability claims |
| PEF CFF | Both, blended | Yes (weighted) | Yes (weighted) | EU PEF, Pathfinder-aligned PCFs |
A recycled-content packaging figure with no stated allocation method cannot be verified or compared — cut-off and system-expansion can differ by tens of percent for the same rPET bottle. Comparing a cut-off figure for one design against a system-expansion figure for another manufactures a difference that is pure method artefact. Fix one method, state it, and apply it consistently across every option in a comparison.
Biogenic Carbon in Paper and Bio-Based Plastics
Paper, board, PLA and bio-PE sequester biogenic carbon during feedstock growth and release it at end-of-life. Under ISO 14067, this flow is tracked explicitly — uptake and release recorded as matched flows — rather than claimed as a permanent removal. The MasterBrain biogenic rules, all anchored to ISO_14067_2018, set the conventions.
| Rule | Value (live) | Unit (live) | MasterBrain key |
|---|---|---|---|
| Biogenic CO₂ uptake per kg biogenic carbon | 3.667 | kg CO2 (atmospheric uptake) per kg biogenic-C content | lca.biogenic.uptake.co2_per_kg_biogenic_carbon |
| Default GWP of biogenic CO₂ | 0 | dimensionless (GWP equivalent for biogenic CO2) | lca.biogenic.gwp_bio.default |
| Carbon-storage permanence threshold | 100 | years | lca.biogenic.carbon_storage.permanence_required_years |
| Land-use-change amortisation rate | 5 | percent of dLUC emissions amortized per year | lca.biogenic.luc.amortization_per_annum_pct |
| dLUC Tier-1 accounting period | 20 | years | lca.biogenic.luc.dluc_tier1_period_years |
| Delayed-emissions threshold | 10 | years | lca.biogenic.delayed_emissions.threshold_years |
| PEF short-rotation biogenic GWP | 0.7 | dimensionless | lca.biogenic.gwp_bio.short_rotation_pef |
Source: MasterBrain lca section, anchored to ISO_14067_2018 (biogenic rules) and EU_PEF_REC_2021_2279 (short-rotation PEF value). Values render live via the factor shortcode.
The default GWP of biogenic CO₂ is zero, reflecting the convention that biogenic carbon taken up in growth and released at end-of-life is climate-neutral over the assessment unless permanent storage (beyond the permanence threshold) is demonstrated. The practical rule for packaging: a paper or bio-plastic package may show negative biogenic carbon at the cradle-to-gate boundary because of uptake, but the matching release must appear at end-of-life. Reporting the uptake without the release overstates the saving.
One exception matters for short-rotation feedstocks: the PEF method applies a non-zero biogenic GWP of 0.7 [GreenCalculus lca.biogenic.gwp_bio.short_rotation_pef · EU PEF 2021] to short-rotation biomass, recognising the temporary atmospheric effect of the harvest-regrowth cycle. Where a packaging PCF is PEF-aligned, this value supersedes the default for short-rotation fibre.
End-of-Life: Recycling, Incineration, Landfill
End-of-life is where packaging accounting diverges most from building materials. A package’s used life is measured in days, so its C-module and Module D credit are proportionally large and frequently contested. Three routes dominate, each with a distinct treatment.
| Route | C-module emissions | Module D credit | Accounting risk |
|---|---|---|---|
| Mechanical recycling | Sorting + reprocessing energy | Avoided virgin production (system-expansion) or zero (cut-off) | Double-counting credit with recycled-content claim |
| Incineration with energy recovery | Fossil CO₂ from polymer combustion (biogenic for fibre tracked separately) | Avoided grid/heat energy (where claimed) | Claiming both the material recycling credit and the energy credit |
| Landfill | Polymer inert; fibre decays (IPCC FOD model) | None | Treating inert polymer as a stored-carbon credit |
A package cannot claim a recycled-content credit on its input and a recycling credit on its output under the same allocation method — that double-counts the single physical recycling event. Cut-off credits the input; system-expansion credits the output; the CFF blends them with weighting that prevents the overlap. Choosing one method and applying it end-to-end is what keeps the credit from being booked twice. Likewise, incineration with energy recovery yields an energy credit, not a material recycling credit — claiming both for the same package is a verification finding.
Factor Data and Sourcing
The per-kilogram cradle-to-gate factors for each polymer and fibre are selected in descending order of specificity: a product-specific EPD first, a generic LCI database value (ecoinvent, PEF-compliant datasets) next, and a spend-based or sector-average figure only as a screening floor. State the tier used for every line item.
At the current MasterBrain version, the embodied-carbon dataset does not yet carry per-kilogram cradle-to-gate rows for packaging polymers (HDPE, LDPE, PET, PP, PVC, PS, EPS, PLA, bio-PE) or paper grades (kraft, corrugated, cartonboard). These factors must currently be sourced from a product EPD or a background LCI database (ecoinvent, PlasticsEurope or FEFCO eco-profiles) and applied per the method above. The table below carries the canonical dataset keys for these factors so that the values render automatically once the rows are added — until then the value cells are intentionally blank.
| Material | A1–A3 factor (live when available) | Reserved MasterBrain key |
|---|---|---|
| PET — virgin | sourced from EPD / ecoinvent | materials.plastics.pet.virgin.module_a1_a3 |
| PET — recycled (rPET) | sourced from EPD / ecoinvent | materials.plastics.pet.recycled.module_a1_a3 |
| LDPE — recycled | sourced from EPD / ecoinvent | materials.plastics.ldpe.recycled.module_a1_a3 |
| PP — virgin | sourced from EPD / ecoinvent | materials.plastics.pp.virgin.module_a1_a3 |
| PVC — virgin | sourced from EPD / ecoinvent | materials.plastics.pvc.virgin.module_a1_a3 |
| PS — virgin | sourced from EPD / ecoinvent | materials.plastics.ps.virgin.module_a1_a3 |
| PLA (bio-plastic) | sourced from EPD / ecoinvent | materials.plastics.pla.module_a1_a3 |
| Kraft paper | sourced from EPD / ecoinvent | materials.paper.kraft.module_a1_a3 |
| Corrugated board | sourced from EPD / ecoinvent | materials.paper.corrugated.module_a1_a3 |
| Cartonboard | sourced from EPD / ecoinvent | materials.paper.cartonboard.module_a1_a3 |
Keys reserved per the live materials.<class>.<variant>.module_<x> convention. Until the rows are sourced, these cells show the EPD/ecoinvent sourcing note rather than a value — no figure is asserted that the dataset does not yet hold.
Worked Example — A PET Bottle with Recycled Content
A single-serve PET bottle with 30% recycled content, assessed cradle-to-gate, to show how the allocation method — not the material — drives the result. The example teaches the method; the absolute factor values are sourced live (or from an EPD/ecoinvent dataset) rather than asserted, because the polymer rows are not yet in the dataset.
One 500 ml PET bottle: bottle body 24 g PET (30% recycled, 70% virgin); HDPE cap 2 g; LDPE label film 0.5 g. Functional unit: one delivered bottle. Masses are illustrative; real takeoff comes from the component specification.
| Component | Mass | A1–A3 factor (live / EPD) | Line A1–A3 |
|---|---|---|---|
| PET body — virgin fraction (70% × 24 g = 16.8 g) | 0.0168 kg | EF_PET_virgin | 0.0168 × EFPET virgin |
| PET body — recycled fraction (30% × 24 g = 7.2 g) | 0.0072 kg | EF_rPET | 0.0072 × EFrPET |
| HDPE cap | 0.002 kg | EF_HDPE | 0.002 × EFHDPE |
| LDPE label film | 0.0005 kg | EF_LDPE | 0.0005 × EFLDPE |
| Bottle A1–A3 total (cut-off allocation) | 0.0273 kg | — | Σ of the four lines |
Under cut-off allocation, the recycled PET fraction carries only the (low) burden of the recycling process, so the bottle total is the virgin-PET line plus the small rPET line plus the cap and label. Under system-expansion allocation, the recycled fraction would carry the full burden of its prior life, and the bottle would earn an end-of-life credit only if it were itself recovered for recycling — producing a different total for the identical bottle. The two methods are both defensible; the result is comparable only within one method.
A methodology worked example is normally a hardcoded audit record whose arithmetic reconciles to factor values on the review date. The per-kilogram PET, HDPE and LDPE factors are not yet in the dataset, so the absolute kg CO₂e total is not asserted here — the line factors render live (or carry an EPD-sourcing placeholder) and the arithmetic structure is shown. Once the polymer rows are sourced, this example converts to a frozen audit record with both a cut-off and a system-expansion total stated. The method shown — bill of materials, feedstock split, allocation choice, module sum per functional unit — is complete regardless.
Edge Cases and Common Pitfalls
- Multi-material laminates. Metallised film and barrier cartons combine layers that cannot be separated. Each layer carries its own factor, and the composite’s end-of-life is usually incineration or landfill, not recycling — so no Module D recycling credit applies.
- Recycled content vs recyclability. These are different claims with different allocation consequences. Recycled content is an input attribute (credited by cut-off); recyclability is an end-of-life attribute (credited by system-expansion). Conflating them double-counts.
- Caps, closures and labels. Small by mass, but different polymers from the body — a PP cap on a PET bottle is a separate line, and a mixed-polymer closure can render the whole pack non-recyclable.
- Ink, adhesive and coating. Frequently omitted from the bill of materials; individually tiny, but they affect recyclability and therefore the end-of-life route.
- Biogenic carbon netting (paper, PLA). Booking the cradle-to-gate biogenic uptake as a reduction without carrying the matching end-of-life release overstates the saving — the same error as in any bio-based assessment.
- Reuse vs single-use functional unit. A refillable package’s carbon must be amortised over its reuse cycles; comparing a single-use design per-pack against a reusable design per-pack ignores the reuse count and is unfair.
Implementation Workflow
1 · Fix the functional unit
Define the basis — per delivered product, not per kilogram — including any product loss the packaging prevents. Every later step normalises to this unit.
2 · Build the bill of materials
List every component, its mass, its polymer/fibre grade, and its recycled-content fraction. Include caps, labels, inks and adhesives.
3 · Choose the allocation method
Select cut-off, system-expansion or CFF — and record the choice. It governs how recycled content and end-of-life recycling are credited, and must be held constant across any comparison.
4 · Source factors by tier
Product EPD first, ecoinvent/PEF dataset next, spend-based screening floor last. Record the tier per line item.
5 · Calculate by module
Compute A1–A3 (dominant), then A4–A5 and C as scope requires. Track biogenic carbon and Module D as separate lines.
6 · Report and document
Report per module and per functional unit, with allocation method, biogenic flows and Module D all explicit. Document factor sources and tiers for verification.
Verification and Data Quality
A packaging PCF faces the same assurance ladder as any product LCA under ISO 14040/14044, with packaging-specific scrutiny on three points.
- Allocation method declaration. The single most-examined item. The assessment must state the allocation method, apply it consistently, and never compare across methods. An undeclared method is an automatic finding.
- Recycled-content evidence. A recycled-content fraction claimed for an allocation credit must be substantiated — mass-balance certification or supplier declaration, not an assumed percentage.
- Biogenic and Module D separation. Biogenic uptake/release and Module D credits must appear as separate, labelled lines, never netted into the cradle-to-gate figure.
Data-quality grading follows the LCA convention: a product-specific EPD is highest quality; a generic LCI database value (ecoinvent, PEF dataset) is mid-tier, suitable for early-stage and immaterial components; a spend-based or sector-average figure is screening-grade only and should be replaced before publication.
Error Traps with Calculable Magnitudes
Each error below produces a specific, quantifiable distortion. Magnitudes are directional — exact values depend on the live polymer factors once sourced — but the direction and order of magnitude are robust.
| Error | What happens | Magnitude / direction | How to avoid |
|---|---|---|---|
| Mixing allocation methods | Cut-off figure for one design compared to a system-expansion figure for another. | Manufactures a difference of tens of percent that is pure method artefact, not material performance. | Fix one method; apply it to every option in the comparison; state it. |
| Double-counting the recycling credit | Recycled-content credit on input and recycling credit on output, same package. | Understates the package by the full value of one recycling credit booked twice. | One allocation method end-to-end; cut-off credits input, system-expansion credits output, never both. |
| Per-kg instead of per-functional-unit comparison | Two designs compared per kilogram of packaging. | Rewards heavy over-protective packaging; can reverse the correct ranking of two designs. | Compare per delivered product, including prevented product loss. |
| Netting biogenic uptake into A1–A3 | Paper/PLA cradle-to-gate uptake booked as a reduction without the end-of-life release. | Overstates the saving by the full biogenic-carbon content of the package. | Record uptake and release as separate matched flows per ISO 14067. |
| Claiming energy + material credit at incineration | Both an energy-recovery credit and a material-recycling credit for the same incinerated package. | Double credit; a verification finding. | Incineration yields an energy credit only; recycling is a different route. |
| Treating landfilled polymer as stored carbon | Inert fossil polymer in landfill claimed as a sequestration credit. | Fabricates a credit; fossil carbon in landfill is not a removal. | Landfilled fossil polymer earns no Module D credit; only demonstrable storage qualifies. |
Frequently Asked Questions
Because recycling is a single physical event whose burdens and credits must be split between the product that supplies recyclate and the product that uses it — and different methods split it differently. Cut-off allocation gives the using product the low burden of the recycling process and no end-of-life credit; system-expansion charges the full prior-life burden but credits avoided virgin production at recovery. For the same recycled-content package these can differ by tens of percent. The material has not changed — only the accounting rule has. This is why the allocation method must always be stated, and why two figures using different methods cannot be compared.
It depends on whether you buy the packaging or sell a product wrapped in it. A brand owner or co-packer purchasing bottles, film and cases books their cradle-to-gate embodied carbon as Scope 3 Category 1 (Purchased Goods and Services) in the year of purchase. The downstream end-of-life treatment of packaging that leaves with a sold product is the seller’s Scope 3 Category 12 (End-of-Life Treatment of Sold Products). The same physical package can therefore be Cat 1 for the buyer and Cat 12 for the seller — two entities, two categories, one material.
By tracking uptake and release as matched flows under ISO 14067, not by claiming a permanent removal. The default GWP of biogenic CO₂ is zero, reflecting the convention that carbon taken up in feedstock growth and released at end-of-life is climate-neutral over the assessment unless permanent storage beyond the permanence threshold is demonstrated. A paper or bio-plastic package may show negative biogenic carbon at the cradle-to-gate boundary because of uptake, but the matching release must appear at end-of-life. For short-rotation feedstocks, the PEF method applies a non-zero biogenic GWP rather than zero, recognising the temporary atmospheric effect of the harvest-regrowth cycle.
No — not under the same allocation method, because that double-counts a single recycling event. Cut-off allocation credits the recycled input; system-expansion credits the end-of-life output; the PEF Circular Footprint Formula blends both with weighting designed to prevent the overlap. The rule is to choose one method and apply it end-to-end. Separately, a package sent to incineration with energy recovery earns an energy credit, not a material recycling credit — claiming both for the same package is a verification finding.
Not necessarily — it depends on the functional unit. Comparing two designs per kilogram of packaging rewards heavy, over-protective packaging and penalises efficient lightweighting, and can reverse the correct ranking. The fair basis is per delivered product, which captures lightweighting, product protection and prevented product loss together. A flexible pouch may carry more carbon per kilogram than a rigid bottle yet far less per litre of product delivered. Fix the functional unit before applying any factors.
From product-specific Environmental Product Declarations where available, and otherwise from background life-cycle-inventory databases — ecoinvent, or polymer- and fibre-specific eco-profiles such as those from PlasticsEurope and FEFCO. Select in descending order of specificity: a product EPD for the exact specified material first, a generic LCI value next, and a spend-based or sector-average figure only as a screening floor. State the factor tier for every line item, because comparing a product-EPD option against a generic-database baseline can manufacture an apparent difference that reflects data source rather than material performance.