
Scope 3 Cat 5 Waste by Disposal Route Calculator (Landfill / Incineration / Recycling / Composting)
Compute operational waste emissions for GHG Protocol Scope 3 Category 5 by treatment route — landfill, incineration, recycling, composting, and anaerobic digestion — on the IPCC 2006 Guidelines Volume 5 waste model, expressed in CO₂e on an AR6 GWP-100 basis.
The route is the emission. A tonne of waste carries almost no fixed carbon number — its emissions depend entirely on where it goes. The same tonne of food waste sent to landfill emits roughly eighty times what it emits sent to anaerobic digestion, because landfill converts its degradable carbon to methane while digestion captures most of it. This calculator computes the disposal emission for each treatment route from the IPCC 2006 Volume 5 waste model, the same scientific basis national inventories use.
The model, not a flat factor. There is no single per-tonne disposal factor in this engine. Landfill is computed from the waste’s degradable organic carbon, the site’s methane correction factor, oxidation, and any gas capture; incineration from the waste’s carbon content and its fossil fraction; composting and digestion from process CH₄ and N₂O emission factors. Each route is a different equation operating on different parameters, which is why the routes are reported separately rather than rolled into one waste number.
1 · Landfill — committed methane.
CH₄ (kg) = Mass × DOC × DOCf × MCF × F × (16 ÷ 12) × (1 − OX) × (1 − R), then × GWPCH₄ biogenic
Landfill is the dominant route for degradable waste because its carbon leaves as methane, not CO₂. The model takes the degradable organic carbon (DOC), the fraction that actually decomposes (DOCf), the methane correction factor for the site type (MCF), the methane fraction of landfill gas (F), the carbon-to-methane molecular ratio (16/12), surface oxidation (OX), and any gas capture rate (R). For a single corporate reporting year the model accounts the total committed methane of the waste disposed that year, rather than distributing it across the decades over which it physically escapes.
2 · Incineration — fossil carbon only.
Fossil CO₂ (kg) = Mass × dm × CF × FCF × OF × (44 ÷ 12), plus process N₂O and CH₄
Incineration converts the waste’s carbon to CO₂, but only the fossil fraction (FCF) counts toward the inventory — the biogenic fraction is reported separately and not added to the headline. The dry-matter content (dm), carbon content (CF), fossil carbon fraction (FCF), and oxidation factor (OF) set the fossil CO₂; small process N₂O and CH₄ emissions are added. This is why incinerating food waste emits almost nothing to the headline figure while incinerating plastic emits a large fossil-CO₂ number.
3 · Composting and anaerobic digestion — process CH₄ and N₂O.
Emissions (kg) = Mass × (CH₄ EF × GWPCH₄ biogenic + N₂O EF × GWPN₂O)
The biological-treatment routes emit small quantities of methane and nitrous oxide as process by-products. The biogenic CO₂ they release is not counted (it is part of the short carbon cycle). Anaerobic digestion that flares or captures its biogas zeroes the methane emission factor; composting carries both a CH₄ and an N₂O factor. These routes sit at the low-emission end of the waste hierarchy for organic material.
4 · Recycling — cut-off, booked at zero.
Recycling Cat 5 = 0
This calculator uses a cut-off boundary for recycling: the disposal emission booked to your Category 5 inventory is zero, because the emissions of reprocessing the material are attributed to the recycler and the next user of the recovered material. The calculator does not apply avoided-burden credits and never returns a negative number. This is a deliberate, conservative boundary choice — stated here so it is never mistaken for an omission.
The routes are reported separately, never blended into one factor. Because each route is a different equation on different parameters, the calculator builds a portfolio: each waste stream is entered as a material, a route, and a mass, and the engine reports the per-route breakdown and a diversion KPI. The Category 5 total is the sum of the per-stream disposal emissions — collection haulage is handled separately (see below).
GWP basis. Emissions are converted to CO₂e on an IPCC AR6 GWP-100 basis by default, with an AR5 toggle. Methane from landfill, composting, and digestion is converted on the biogenic-methane GWP; methane from incineration on the fossil-methane GWP; nitrous oxide on the AR6 N₂O GWP. The data-sources section sets out the exact constants.
Category boundary. This calculator covers waste generated in the reporting company’s own operations and sent for third-party treatment (GHG Protocol Scope 3 Category 5). The end-of-life treatment of sold products after they leave the company is Category 12, a separate calculator. Collection and haulage of the waste to the treatment site is properly Category 4 transport and is offered here only as an optional, separately reported memo.
IPCC 2006 Guidelines Volume 5 (Waste) — landfill first-order-decay (methane commitment), incineration carbon balance, and composting/AD default factors. Reads MasterBrain V3 live.
Add a waste stream above and click Calculate
Results appear with a by-route breakdown, landfill-diversion KPI, biogenic-CO₂ memo, an indicative IPCC range, diversion scenarios, full audit trail, and export.
Results are indicative and for organisational greenhouse-gas accounting under the GHG Protocol Scope 3 Standard (Category 5, Waste Generated in Operations). Emission models are the IPCC 2006 Guidelines Volume 5 Tier-1 defaults, which carry material uncertainty — site-measured or contractor-confirmed factors should replace them for assured reporting. Landfill emissions are computed on a single-year methane-commitment basis (not a multi-year decay projection). Fossil CO₂e only is reported in the headline; biogenic CO₂ is shown as a separate memo and collection transport as a separate Scope 3 Category 4 line. Verify boundary, treatment routes and tonnage against waste-transfer records before external reporting; for assured disclosure obtain third-party verification under ISO 14064-3.
A tonne of food waste has no carbon footprint until you decide where to send it. Drop it in a landfill and its degradable carbon turns to methane; send it to anaerobic digestion and almost all of that methane is captured and burned. Same tonne, same kitchen — two emission figures that differ by a factor of more than sixty.
In waste accounting, the disposal route is not a detail. It is the entire number.
Scope 3 Category 5 waste emissions depend on the disposal route. Landfill emits methane and is highest; incineration emits the fossil-carbon fraction; composting and digestion emit small process gases; recycling is booked at zero under a cut-off boundary.

What Category 5 waste covers — and the Cat 5 vs Cat 12 line
GHG Protocol Scope 3 Category 5 — waste generated in operations — covers the disposal and treatment of waste produced by the reporting company’s own activities, handled by a third party. Office and canteen waste, manufacturing offcuts, packaging discarded on site, wastewater the company sends for treatment: the emissions of treating that waste are Category 5. This calculator computes those treatment emissions by route, on the IPCC 2006 Volume 5 waste model.
Operational waste, not product end-of-life
The most common scoping error in waste accounting is confusing Category 5 with Category 12. Category 5 is the waste your operations generate — the things your sites throw away. Category 12 is the end-of-life treatment of the products you sold, once a customer disposes of them. A drinks manufacturer’s factory food waste is Category 5; the disposal of the bottles its customers empty and bin is Category 12. The treatment science is the same model in both cases, but the activity data and the category line differ entirely. This calculator is the Category 5 tool; the Category 12 end-of-life calculator handles sold-product disposal.
Route boundary — what’s in, what’s a separate calculator
| Covered in this calculator | Out of scope — separate calculator or category |
|---|---|
| Disposal-route emissions for each waste stream — landfill, incineration, recycling, composting, and anaerobic digestion — on the IPCC 2006 Vol 5 model | End-of-life treatment of sold products: see the Scope 3 Cat 12 End-of-Life Calculator |
| A portfolio of mixed streams and routes, with a per-route breakdown and a diversion-from-landfill KPI | Detailed material-stream accounting — C&D, e-waste, hazardous, textile, packaging: see the Scope 3 Cat 5 Waste Streams Calculator |
| Landfill site management — methane correction factor, oxidation cover, and gas-capture rate as a reduction on emitted methane | Collection and haulage of the waste to the treatment site — properly Scope 3 Category 4 transport (offered here as an optional separate memo, not in the Cat 5 total) |
| The fossil-versus-biogenic carbon split at incineration, with the biogenic CO₂ reported as a separate memo | Wastewater treatment emissions in depth — the model carries wastewater parameters, but dedicated wastewater accounting is a waste-streams concern |
Category 5 is the waste your operations generate. Category 12 is the end-of-life of the products you sold. They use the same IPCC treatment model but sit in different inventory lines on different activity data — booking sold-product disposal to Category 5, or operational waste to Category 12, is a boundary error an assurer will catch.
The disposal routes, ranked by emission intensity
For a given material, the five treatment routes span more than two orders of magnitude in emissions. The ranking below holds for degradable organic waste like food; for inert or fossil-derived waste like plastic the order changes, because the dominant emission shifts from landfill methane to incineration fossil-CO₂.
Landfill
Highest for degradable waste. Carbon leaves as methane, a high-GWP gas. Driven by degradable organic carbon, site type, oxidation, and gas capture — not a fixed factor.
Incineration
Emits the fossil carbon fraction as CO₂; biogenic carbon is reported separately and excluded. High for plastics, near-zero headline for food. Plus small process N₂O and CH₄.
Composting
Low. Process CH₄ and N₂O only; the biogenic CO₂ is not counted. The aerobic route for organic material.
Anaerobic digestion
Lowest active-treatment route for organics. Biogas is captured and burned; flaring or closed digestion zeroes the methane factor, leaving only minor residual emissions.
Recycling
Booked at zero under a cut-off boundary — reprocessing emissions are attributed to the recycler and the next user, not to your Category 5. No avoided-burden credit.
One tonne of food waste, by route
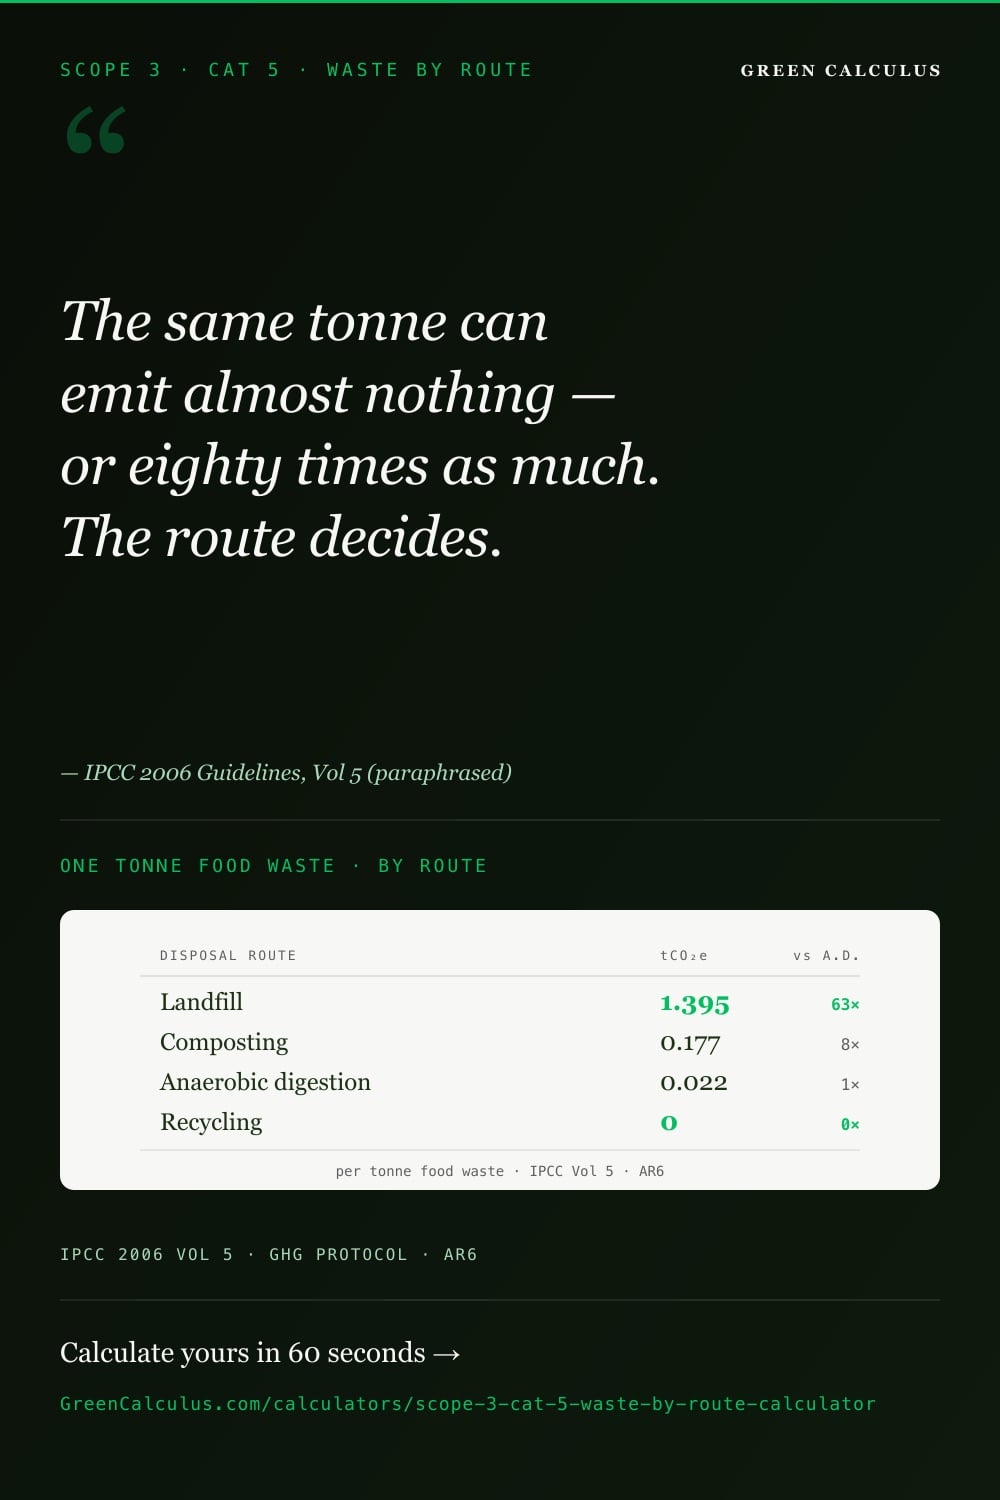
The chart below shows the calculator’s verified emission for one tonne of food waste sent to each route, on the AR6 basis. Landfill dominates because its degradable carbon converts to methane; the biological routes and incineration sit far below; recycling is a zero bar. This single comparison is the clearest statement of why the route, not the tonnage, drives the number.
One tonne of food waste, IPCC 2006 Vol 5 model, AR6 GWP-100, headline CO₂e (biogenic CO₂ excluded). Landfill on managed-anaerobic site with no oxidising cover and no gas capture; incineration on a continuous stoker. Engine-verified figures; the worked example below shows the full parameters. Other materials and site settings produce different values, computed live in the calculator.
The route ranking is the decarbonisation map. Moving degradable waste up the hierarchy — landfill to digestion, or landfill to recycling — cuts the Category 5 line directly, and the diversion-from-landfill KPI quantifies it. For fossil-derived waste like plastic the lever is different: there the dominant emission is incineration fossil-CO₂, and the abatement is reducing the plastic itself, not changing its disposal route.
Why landfill needs a model, not a flat factor
Most online waste calculators multiply tonnes by a single landfill factor. That is wrong for the same reason a flat “transport factor” would be wrong: the methane a tonne of waste produces depends on what the waste is made of and how the site is run. The IPCC 2006 Volume 5 model computes it from the waste’s chemistry and the site’s management, not from an average.
Committed methane, not a decay curve
Landfilled organic waste does not release its methane all at once — it decays over decades, governed by a first-order decay rate. That decay rate matters enormously for a national inventory tracking emissions year by year. For a single corporate reporting year, the defensible accounting choice is different: you account the total committed methane of the waste your operations sent to landfill in that year, regardless of the calendar over which it physically escapes. This collapses the time-distributed decay model to its committed-total form. The model carries the decay-rate parameter for completeness, but this calculator does not present a multi-year decay curve as the basis of a corporate single-year figure — the committed total is the honest unit for the inventory year.
A flat “tonnes to landfill times one number” estimate cannot distinguish a tonne of food waste from a tonne of inert rubble, or a capped gas-capture site from an open dump. The IPCC model can, because it computes methane from the waste’s degradable carbon and the site’s management — which is exactly the information an assurer expects to see behind the number.
The parameters that drive the landfill figure
| Parameter | What it is | Role in the calculation |
|---|---|---|
| DOC | Degradable organic carbon — kg C per kg wet waste | The carbon available to become methane. Food waste is high; inert waste is near zero. |
| DOCf | Fraction of DOC that actually decomposes | Not all degradable carbon breaks down; the default is around half. |
| MCF | Methane correction factor — by site type | How anaerobic the site is. Managed-anaerobic 1.0 down to unmanaged-shallow 0.4. |
| F | Fraction of methane in landfill gas | Typically 0.5 — the rest of the landfill gas is CO₂ (biogenic, uncounted). |
| OX | Oxidation factor of the cover soil | Methane oxidised in the cap before it escapes. None 0; oxidising cover 0.1. |
| R | Gas-capture (recovery) rate | Captured and flared or used for energy. Applied as a ×(1−R) reduction on emitted methane. |
IPCC 2006 Guidelines for National GHG Inventories, Volume 5 (Waste), Chapter 3. The decay-rate parameter k is carried in the model but is informational for the corporate single-year committed-methane basis used here. Parameter defaults are hardcoded from the MasterBrain waste keyspace; the calculator exposes site type, oxidation cover, and capture rate as inputs.
Site management and gas capture
Two of the landfill parameters are operational choices, and the calculator exposes them because they change the result substantially. The methane correction factor reflects how anaerobic the site is: a managed, capped, anaerobic landfill scores 1.0 — maximum methane generation — while a semi-aerobic site scores 0.5, an unmanaged deep dump 0.8, an unmanaged shallow one 0.4, and an uncategorised site 0.6. Oxidation cover, where present, oxidises a tenth of the methane in the cap before it escapes. Gas capture is the largest operational lever: a site capturing and flaring its landfill gas applies a multiplicative reduction of one minus the capture rate to the emitted methane.
Landfill gas capture is modelled as a multiplicative reduction on emitted methane — a ×(1−R) term — not as a separate negative credit line. A site at 60% capture emits 40% of its committed methane. The same logic applies to anaerobic digestion: a digester that flares or closes its biogas zeroes the methane emission factor entirely, because the carbon leaves as combusted CO₂ rather than fugitive methane.
How the calculation works — route by route
Each route is its own equation. The calculator runs the one that matches the route the waste stream is sent to, converts the resulting gases to CO₂e, and sums the per-stream results into the Category 5 total.
Landfill: CH₄ = Mass × DOC × DOCf × MCF × F × (16/12) × (1−OX) × (1−R) → × GWPCH₄ bio
Incineration: fossil CO₂ = Mass × dm × CF × FCF × OF × (44/12) → + process N₂O and CH₄
Composting / AD: Mass × (CH₄ EF × GWPCH₄ bio + N₂O EF × GWPN₂O)
Recycling: 0 (cut-off)
Pick the material
Each waste stream starts with its material. The material sets the chemistry — degradable carbon, carbon content, fossil fraction — and constrains the valid routes. Organic materials unlock composting and digestion; inert and fossil-derived materials do not.
Pick the route and mass
Select the treatment route and enter the mass in tonnes. For landfill, set the site type, oxidation cover, and capture rate. The engine runs the route equation against the material’s hardcoded IPCC parameters.
Read the portfolio
Add as many streams as the inventory needs. The calculator reports each stream’s emission, the per-route breakdown, the Category 5 total, and a diversion-from-landfill KPI for the portfolio.
Fossil versus biogenic carbon at incineration
Incineration is where the fossil-biogenic distinction does the most work. The model burns the waste’s carbon to CO₂, but only the fossil-carbon fraction counts toward the inventory headline — the biogenic fraction, being part of the short carbon cycle, is reported as a separate memo and excluded from the Category 5 total. This is why incinerating a tonne of food waste contributes almost nothing to the headline (its carbon is biogenic) while incinerating a tonne of plastic contributes a large fossil-CO₂ figure (its carbon is fossil-derived). The fossil carbon fraction parameter is what flips between the two. Reporting the biogenic CO₂ separately, rather than silently dropping it, is what lets an assurer see the full carbon flow without it inflating the inventory.
Do not add the biogenic CO₂ memo to your Category 5 total. The biogenic carbon released by incinerating or composting organic waste is excluded from the headline by design — it is part of the biogenic carbon cycle, not a net addition to the atmosphere on inventory timescales. The calculator reports it separately so the carbon flow is visible; folding it into the total double-counts carbon the standard intends to exclude.
Collection and haulage — the optional Category 4 memo
Getting the waste to the treatment site burns diesel, and that haulage emission is real — but it is transport, which belongs in Scope 3 Category 4, not in the Category 5 disposal figure. The calculator offers an optional collection-transport module that estimates the haulage on live road-freight tonne-kilometre factors and reports it as a separate memo line. It is switched off by default and is never summed into the Category 5 total. If you enable it, carry the result to your Category 4 inventory, not your Category 5 one — booking collection haulage to Category 5 is a category error, and double-booking it across both is worse.
Gases and GWP — CH₄, N₂O, and the AR6 basis
Waste is not a CO₂ story. The carbon that matters in waste accounting leaves as methane and nitrous oxide — gases tens to hundreds of times more potent than CO₂ — which is why the global warming potential conversion dominates the result.
Why waste is a methane and nitrous-oxide story
Landfilled organic carbon converts to methane, not CO₂, and methane carries an AR6 GWP-100 of around twenty-eight to thirty. Composting and digestion emit both methane and nitrous oxide; nitrous oxide carries an AR6 GWP-100 of 273. A small mass of either gas converts to a large CO₂e figure, which is the whole reason landfill ranks so far above the biological routes. The biogenic CO₂ that organic waste also releases is excluded — it is the methane and nitrous oxide that the inventory is counting.
The GWP basis this calculator uses
The calculator runs on AR6 GWP-100 by default — the “Regulatory · AR6” setting — with an “Engineering · AR5” toggle for inventories that must stay on the older basis. The methane GWP applied depends on the carbon’s origin: methane from landfill, composting, and digestion is biogenic and uses the biogenic-methane GWP; methane from incineration is treated on the fossil-methane GWP. Nitrous oxide uses the single AR6 N₂O GWP. The exact constants are set out in the data-sources section.
The methane GWP is not one number. Biogenic methane — from landfill, composting, and digestion — and fossil methane — from incineration — carry slightly different GWP-100 values, because fossil methane adds carbon to the fast cycle that was previously locked away. The calculator applies the correct one per route automatically; an assurer checking a manual inventory will look for the same distinction.
Worked example — one tonne of food waste, five routes
This example sends the same tonne of food waste through all five routes, then adds a plastics-incineration row to show the fossil-carbon point. All figures are engine-verified on the AR6 basis. The food rows share the same mass and material; only the route changes — which is exactly how the comparison is built in the calculator, as five stream cards on one material.
The same tonne, five routes
| Stream (1 tonne, AR6) | Key parameters | Headline (tCO₂e) | Biogenic CO₂ memo |
|---|---|---|---|
| Food → Landfill (managed-anaerobic, no cover, 0% capture) | DOC 0.15, DOCf 0.5, MCF 1.0, F 0.5, OX 0 → CH₄ 50 kg × 27.9 | 1.395 | — |
| Food → Composting (wet) | CH₄ 4 kg/t × 27.9 + N₂O 0.24 kg/t × 273 | 0.1771 | not quantified |
| Food → Anaerobic digestion (wet, open) | CH₄ 0.8 kg/t × 27.9; N₂O 0 | 0.0223 | — |
| Food → Incineration (continuous stoker) | FCF 0 → fossil CO₂ = 0; N₂O 50 g/t × 273 + CH₄ 0.2 kg/Gg | 0.0137 | 0.557 |
| Food → Recycling | Cut-off boundary | 0 | — |
| Plastics → Incineration (continuous stoker) | dm 1.0, cc 0.75, FCF 1.0, OF 1.0 → fossil CO₂ 2.75 t + N₂O 13.65 kg | 2.7637 | 0 |
IPCC 2006 Vol 5 model, AR6 GWP-100. Constants: CH₄ biogenic 27.9, N₂O 273; landfill molecular ratio 16/12, incineration 44/12. Food landfill: 1 t × 0.15 × 0.5 × 1.0 × 0.5 × (16/12) = 50 kg CH₄ × 27.9 = 1.395 tCO₂e. Plastics incineration: 1 t × 1.0 × 0.75 × 1.0 × 1.0 × (44/12) = 2.75 t fossil CO₂, plus 13.65 kg N₂O. All values asserted against the live MasterBrain to 1e-6.
Two lessons sit in this table. First, for organic waste the route is everything: the same tonne of food spans from 1.395 tCO₂e at landfill to zero recycled, a range driven entirely by the disposal decision. Second, incineration is material-dependent in the opposite direction — it is near-zero for food, because food carbon is biogenic and excluded, but it is the dominant figure for plastic, because plastic carbon is fossil. A waste portfolio that incinerates both will see almost all of its incineration emissions come from the plastic, not the food, even at equal mass.
When you build a portfolio, watch where the total concentrates. For most operational waste mixes the Category 5 figure is dominated by two lines: degradable organic waste sent to landfill, and fossil-derived waste sent to incineration. Diverting the first up the hierarchy and reducing the second at source are the two levers that move the number — the rest is usually noise around them.
Data quality and the default hierarchy
The reporting expectation is to use the most specific data available and improve toward measured tonnages and known site management where the emissions are material. For waste, the largest accuracy gains come from weighing the streams accurately, getting the material composition right, and — for landfill — knowing the actual site type and gas-capture rate rather than defaulting them.
| Tier | Mass & composition | Treatment parameters |
|---|---|---|
| Primary / measured | Weighbridge or waste-contractor tonnages per stream, with material composition from a waste audit | Actual site type, oxidation cover, and measured gas-capture rate from the disposal contractor |
| Primary activity + default parameters | Measured tonnages per stream with assumed material composition | IPCC default site-type MCF and oxidation for the known disposal route |
| Default / fallback | Estimated tonnages from spend, headcount, or floor-area proxies | Conservative defaults — uncategorised-site MCF, no oxidation, no capture |
The single highest-value improvement for most inventories is splitting a generic “general waste to landfill” line into its actual materials, because the degradable organic fraction is what generates the methane. A tonne booked as undifferentiated landfill, modelled on a bulk-waste default, can materially misstate the methane against the same tonne resolved into its food, paper, and inert fractions. The honest disclosure names which streams rest on measured tonnages and which on proxies.
Audit checklist — what gets flagged in waste assurance
Waste assurance traces each stream from tonnage to the rolled-up total and pays close attention to the disposal route and the landfill parameters, because those are where the largest errors hide. The findings below are the issues raised most often on a Category 5 inventory.
01 — Flat landfill factor instead of the model
Multiplying tonnes by a single landfill number, ignoring material composition and site management. Understates methane for high-DOC waste and overstates it for inert waste. Use the IPCC model with the actual material and site type.
02 — Biogenic CO₂ added to the total
Folding the biogenic CO₂ from incineration or composting into the Category 5 headline. The standard excludes it by design; counting it double-counts carbon. Keep the biogenic memo separate from the total.
03 — Cat 5 vs Cat 12 boundary error
Booking sold-product end-of-life to Category 5, or operational waste to Category 12. Confirm whose waste it is — the company’s operations (Cat 5) or its customers’ disposal of sold products (Cat 12).
04 — Collection haulage in the Cat 5 figure
Summing the optional collection-transport memo into the disposal total. Haulage is Category 4 transport. Report it separately and carry it to the Category 4 line, never the Category 5 one.
05 — Recycling treated as a credit
Applying an avoided-burden credit to recycled streams and returning a negative number. This calculator uses a cut-off boundary — recycling is zero, not negative. Mixing cut-off and avoided-burden across a portfolio is inconsistent.
06 — Gas capture assumed without evidence
Claiming a high landfill gas-capture rate the disposal site cannot substantiate. Capture is a large multiplicative reduction; an unsupported rate understates methane. Use the contractor’s documented capture rate or a conservative default.
Reporting context — Scope 3, IFRS S2, CSRD, waste regs
Category 5 waste emissions feed the same disclosure regimes as the rest of the Scope 3 inventory. The rows below cover the disclosure surface a waste-reporting company navigates.
| Framework | Role for Category 5 waste emissions | Disclosure cadence |
|---|---|---|
| GHG Protocol Scope 3 Standard | The accounting standard. Defines Category 5 (waste generated in operations) and Category 12 (end-of-life of sold products), and the waste-specific and average-data methods the routes use. | Same as the institution’s reporting cycle |
| IPCC 2006 Guidelines, Volume 5 | The scientific basis for the disposal-route emissions — the landfill methane-commitment model, incineration carbon balance, and composting and digestion emission factors. | Stable between guideline revisions |
| IPCC AR6 | The GWP-100 source for converting methane and nitrous oxide to CO₂e. The default basis; an AR5 toggle is available for inventories on the older vintage. | Stable between assessment reports |
| IFRS S2 (ISSB) | The global disclosure baseline. Requires Scope 3 disclosure including waste where material, with the calculation methodology disclosed. | Annual, aligned with financial statements |
| CSRD ESRS E1 (EU) | The EU sustainability-reporting mandate. ESRS E1 requires Scope 3 disclosure for in-scope companies; ESRS E5 (resource use and circular economy) covers the waste-quantity reporting that pairs with these emissions. | Annual sustainability statement |
Data sources, model parameters, and GWP basis
The waste model — source and structure
The disposal emissions are computed from the IPCC 2006 Guidelines for National Greenhouse Gas Inventories, Volume 5 (Waste), retrieved for the MasterBrain factor set. This is the same model national inventories use. There are no DEFRA per-tonne waste-disposal factors involved in the Category 5 figure — DEFRA factors enter only through the optional collection-transport module, which applies road-freight tonne-kilometre factors to the haulage and reports it as a separate Category 4 memo. The model parameters — degradable organic carbon, methane correction factors, oxidation, carbon content, fossil carbon fractions, and the composting and digestion emission factors — are hardcoded from the MasterBrain waste keyspace, because they are model coefficients rather than single renderable factors.
GWP constants — source and basis
The methane and nitrous-oxide global warming potentials come from the IPCC assessment reports. On the AR6 GWP-100 basis the calculator uses, biogenic methane is converted at 27.9, fossil methane at 29.8, and nitrous oxide at 273; the AR5 toggle uses 28.0 for both methane variants and 265 for nitrous oxide. For background on how the assessment-report bases differ, see the global warming potential definition and the AR6 GWP values reference. The per-gas methane distinction — biogenic versus fossil — is applied automatically by route.
Versioning and update cadence
The IPCC waste model is stable between guideline revisions, and the GWP values are stable between assessment reports, so this calculator’s basis changes rarely. The MasterBrain version against which a result was computed is stamped on the output, so a figure computed against one factor set and the same figure recomputed against a later one are distinguishable in restatement work. The optional collection-transport module tracks the annual DEFRA road-freight factor refresh. The full underlying parameter tables sit in the DEFRA emission factors reference for the transport module; the IPCC waste parameters are documented in the paired methodology page below.
What’s next — completing your Category 5 inventory
A complete waste inventory usually needs more than the by-route view this page provides. The companion calculators below cover material-stream detail, the downstream end-of-life of sold products, and the collection transport that pairs with disposal.
Live
Waste Streams
The by-material companion — C&D, food, e-waste, hazardous, textile, packaging, plastic, and wastewater on the same IPCC model.
Live
Cat 12 End-of-Life
The downstream sibling — the end-of-life treatment of sold products after they leave the company, on the same disposal-route model.
Live
Waste by Disposal Route
By-route operational waste — landfill, incineration, recycling, composting, and digestion. The calculator on this page.
Live
Road Freight
For the collection-haulage memo — tonne-kilometre road-freight factors, booked to Category 4, not Category 5.
Live
GHG Inventory Aggregator
Roll Category 5 together with every other Scope 1, 2 and 3 source into one auditable corporate carbon footprint — the organisation-level inventory this category feeds into.
For the full methodological treatment — the landfill committed-methane derivation, the incineration carbon balance, the cut-off recycling boundary, and the AR6 GWP handling — see the paired waste disposal route methodology page, with the material-stream detail on the waste streams methodology page and the downstream framing on the end-of-life treatment methodology page.
Frequently asked questions
Category 5 is waste generated in operations — the disposal and treatment of waste the reporting company’s own activities produce, handled by a third party. It covers office, canteen, manufacturing, and packaging waste sent to landfill, incineration, recycling, composting, or digestion. It does not cover the end-of-life of products the company sold, which is Category 12.
Category 5 is the waste your own operations generate; Category 12 is the end-of-life treatment of the products you sold, once your customers dispose of them. Both use the same IPCC treatment model, but they sit in different inventory lines on different activity data. A factory’s own food waste is Category 5; the disposal of the packaging its customers throw away is Category 12.
Because the route, not the tonnage, sets the emission. Landfill converts a waste’s degradable carbon to methane, a high-GWP gas; digestion captures most of that methane; recycling is booked at zero. The same tonne of food waste emits 1.395 tCO₂e at landfill and 0.022 tCO₂e at anaerobic digestion on the AR6 basis — a difference of more than sixty times, driven entirely by where it goes.
The disposal emissions come from the IPCC 2006 Guidelines for National GHG Inventories, Volume 5 (Waste) — the landfill methane-commitment model, the incineration carbon balance, and the composting and digestion emission factors. There are no DEFRA per-tonne waste-disposal factors; DEFRA factors appear only in the optional collection-transport module, which is a separate Category 4 memo.
The calculator uses a cut-off boundary. Under cut-off, the emissions of reprocessing recycled material are attributed to the recycler and the next user of the recovered material, not to your Category 5 inventory — so your disposal emission for recycling is zero. The calculator does not apply avoided-burden credits and never returns a negative number. The boundary is stated explicitly rather than hidden.
Because food carbon is biogenic. Incineration only counts the fossil-carbon fraction toward the inventory headline; the biogenic CO₂ is reported separately and excluded as part of the short carbon cycle. Food waste has a fossil carbon fraction of zero, so its incineration headline is near-zero — only small process N₂O and CH₄ remain. Plastic, with a fossil carbon fraction of one, produces a large incineration figure.
Gas capture is modelled as a multiplicative reduction on emitted methane — a factor of one minus the capture rate. A site capturing 60% of its landfill gas emits 40% of its committed methane. It is not a separate negative credit line. The site’s methane correction factor and any oxidation cover apply alongside it. Use the disposal contractor’s documented capture rate; an unsupported rate understates the methane.
AR6 GWP-100 by default, with an AR5 toggle. On AR6, biogenic methane converts at 27.9, fossil methane at 29.8, and nitrous oxide at 273; AR5 uses 28.0 for methane and 265 for nitrous oxide. The methane GWP applied depends on the carbon’s origin — landfill, composting, and digestion methane is biogenic, incineration methane is fossil — and the calculator applies the correct one per route.
No — not in the Category 5 disposal total. The calculator offers an optional collection-transport module that estimates haulage on road-freight tonne-kilometre factors, but it is off by default and reported as a separate memo. Collection haulage is transport and belongs in Scope 3 Category 4. If you enable the module, carry its result to your Category 4 line, not your Category 5 one.
Because the methane a tonne of waste produces depends on what the waste is and how the site is run. The IPCC model computes it from the degradable organic carbon, the site’s methane correction factor, oxidation, and gas capture — so it distinguishes food waste from inert rubble, and a capped capture site from an open dump. A flat per-tonne factor cannot, which is why it misstates the methane for most real waste streams.
Methodology notes and limitations
Model source and vintage. The disposal-route emissions implement the IPCC 2006 Guidelines for National GHG Inventories, Volume 5 (Waste) — the landfill methane-commitment model, the incineration carbon balance, and the composting and anaerobic-digestion emission factors. There are no DEFRA per-tonne waste-disposal factors; DEFRA road-freight factors enter only through the optional collection-transport module. GWP conversion is on the IPCC AR6 GWP-100 basis by default with an AR5 toggle.
Landfill is a committed-methane figure. The landfill route accounts the total committed methane of the waste disposed in the reporting year, rather than distributing it across the decades over which it physically escapes. The decay-rate parameter is carried in the model but is informational for this corporate single-year basis; the calculator does not present a multi-year decay curve as the headline. Site type, oxidation cover, and gas-capture rate are inputs; capture is applied as a multiplicative reduction on emitted methane, not a separate credit line.
Fossil versus biogenic carbon. Incineration counts only the fossil-carbon fraction toward the headline; the biogenic CO₂ is reported as a separate memo and excluded from the Category 5 total. The same exclusion applies to the biogenic CO₂ from composting and digestion. Folding the biogenic memo into the total double-counts carbon the standard excludes by design.
Recycling is cut-off. Recycled streams are booked at zero disposal emission under a cut-off boundary; reprocessing emissions are attributed to the recycler and the next user. The calculator applies no avoided-burden credits and returns no negative values. Mixing cut-off and avoided-burden boundaries across a portfolio is inconsistent and should be avoided.
Per-gas GWP origin. Methane from landfill, composting, and digestion is converted on the biogenic-methane GWP; methane from incineration on the fossil-methane GWP; nitrous oxide on the AR6 N₂O GWP. The distinction is applied automatically by route.
Collection transport is a separate Category 4 memo. The optional collection-transport module estimates haulage on road-freight tonne-kilometre factors and is reported separately from the Category 5 disposal total. It is off by default. Enabling it does not change the Category 5 figure; its result belongs in Category 4.
Activity data taken as entered. The calculator uses the masses, materials, routes, and site settings the user enters; it does not independently verify them. The user is responsible for the activity-data basis and for documenting the material composition, route, and site management per stream.
No assurance opinion. Results are estimates and do not constitute an assurance opinion. They should be reviewed by a qualified practitioner before use in IFRS S2 disclosures, CSRD ESRS E1 datapoints, or other regulatory submissions. The full methodological deep-dive is published on the paired waste disposal route methodology page.