
Waste Disposal Route Emissions

The same tonne of food waste emits almost nothing when composted, a few hundred kilograms of CO₂e when incinerated, and — sent to an unmanaged landfill — can release the warming equivalent of more than a tonne of CO₂ as methane over the decades that follow. The waste does not change. The disposal route does.
Waste accounting is the rare category where the destination, not the material, drives most of the footprint — and where the headline emission for landfill has not even occurred yet in the year you report it.
Waste emissions depend overwhelmingly on disposal route. Landfill uses the IPCC First-Order Decay model (methane over decades); incineration and composting use per-tonne treatment factors. Generated waste is Scope 3 Category 5; collection transport is Category 4.
Step-by-step method for quantifying emissions from waste generated in operations by disposal route: setting the boundary (Category 5 treatment, Category 4 collection, and the recycling cut-off), applying the correct model for each of the four routes (landfill First-Order Decay, incineration combustion factors, composting and anaerobic digestion biological factors, recycling cut-off), separating fossil from biogenic carbon, and converting to CO₂e. Frameworks: IPCC 2006 Guidelines Volume 5 (Waste), the GHG Protocol Scope 3 Standard, DEFRA 2025 conversion factors for collection transport, and IPCC AR6 global warming potentials.
The worked-example arithmetic
A landfill emission is a multi-step derivation — mass × DOC × DOCf × MCF, then decay, then × F × 16/12, then × (1−OX) — not a single headline-factor lookup. There is no one “emission factor” to surface; the CH₄ figure is computed. the worked-example steps, inputs and results are hardcoded with their source, for audit reproducibility.
MB parameters, transport & GWP
The individual IPCC parameters are each a canonical MB row (waste.landfill.docf.default → 0.5, and so on), so the reference tables render them live via gc_factor — the number hyperlinks to its MB source. Collection transport (gc_factor) and the CH₄/N₂O global warming potentials (gc_gwp) likewise render live. Only the multiplication chain in a worked example is pinned.
Provider directory
Now it has to hold up all year.
See who does this work. Every listing names the standards it works to, and paid placements are labelled. Including KERAMIDA and Small World Consulting.
Browse 6 carbon accounting & inventory providers →Do this work? A listing is US$390 a year. Get listed →
Why the Disposal Route Is the Dominant Variable
For most emission categories the activity data — kilometres, kilowatt-hours, kilograms of material — sets the footprint, and the factor is a fixed property of the activity. Waste inverts this. A tonne of mixed municipal waste has no single emission factor; its footprint depends almost entirely on where it goes. Landfilled, its degradable organic fraction generates methane for decades. Incinerated, its fossil carbon oxidises to CO₂ within seconds and its biogenic carbon is reported separately. Composted, it produces a small amount of methane and nitrous oxide and nothing else of consequence. The spread between routes for the same tonne is commonly an order of magnitude.
The GHG Protocol Scope 3 Standard places emissions from waste generated in operations in Category 5, and the upstream collection and haulage of that waste in Category 4. The treatment emissions themselves are quantified with the IPCC 2006 Guidelines Volume 5 models — a different, route-specific model for each destination. This is why a waste methodology cannot be a single factor table: it is four models wearing one category label.
Unlike combustion, where the emission is instantaneous, the First-Order Decay model spreads landfill methane generation across the decades after deposition. The figure attributed to a tonne landfilled this year is a modelled projection of gas it will release in future years, not a measurement of this year’s release. This time-dependence is the single most misunderstood feature of waste accounting, and it changes how a landfill figure should be interpreted in an annual inventory.
When to Use This Methodology
Use this methodology when
You are quantifying emissions from waste your operations generate and send to third-party treatment — landfill, incineration (with or without energy recovery), composting, anaerobic digestion, or recycling — for Scope 3 Category 5; when you need to compare disposal routes for the same waste stream; or when you are building the treatment side of a waste inventory under the GHG Protocol with IPCC 2006 Volume 5 models.
Do not use this methodology when
You need the per-material breakdown of a mixed waste stream (C&D, food, e-waste, hazardous, textile, packaging, plastic, wastewater) — that is the waste-streams methodology, which composes the same IPCC models per material; when the waste is treated in equipment you own and operate (the treatment emissions become Scope 1, though the model is identical); or when you only need the collection leg, which is the transport methodology.
Step 1 — Set the Boundary: Category 5, Category 4 & the Recycling Cut-Off
Three boundary decisions precede any calculation: which scope the treatment falls in, whether collection transport is in scope, and how recycling is treated at the system boundary.
| Element | Scope / category | Notes |
|---|---|---|
| Treatment of waste you generate, handled by a third party | Scope 3 Cat 5 | Waste generated in operations. The default case this page addresses. |
| Collection & haulage to the treatment site | Scope 3 Cat 4 | Upstream transport & distribution — the live-rendered stream (Step 4). |
| Treatment in equipment you own/operate | Scope 1 | Same IPCC model, direct emission. On-site landfill, incinerator or composter. |
| Recycling of materials sent off-site | Cut-off | Under the GHG Protocol cut-off, the disposal-stage emission is the collection transport plus any sorting/processing energy — not an avoided-burden credit. |
A frequent error is booking recycling as avoided emissions — a credit for displacing virgin material. Standard corporate inventory under the GHG Protocol uses the recycled-content (cut-off) approach: the recycler, not the generator, carries the downstream burden, and the generator’s disposal-stage emission is limited to collection transport and any on-site processing energy. Avoided-burden credits belong in a separate, clearly labelled consequential analysis, never in the attributional Category 5 figure.
Step 2 — The Four Disposal Routes
Each route has its own model and its own dominant gas. The four are summarised here; the landfill FOD model — the only time-dependent one — gets its own step below.
Landfill CH₄ dominant
Degradable organic carbon in the waste decomposes anaerobically, generating landfill gas that is roughly half methane. The IPCC First-Order Decay (FOD) model projects this generation over time from the waste’s degradable organic carbon content, the fraction that actually dissimilates, the methane correction factor for the site type, and a decay rate. Managed sites apply methane recovery and a surface oxidation credit. This is Step 3.
Incineration fossil CO₂ CH₄ N₂O
Combustion oxidises the waste’s carbon immediately. The headline emission is fossil CO₂ — the fossil carbon fraction of the waste multiplied by its oxidation factor and the stoichiometric carbon-to-CO₂ ratio — plus small CH₄ and N₂O contributions. Biogenic CO₂ (from food, paper, wood) is reported separately and excluded from the headline, exactly as in combustion accounting. Energy recovery from the plant is a Scope 2 displacement credit handled elsewhere, not a reduction in the incineration emission factor.
| Parameter | Symbol | Indicative value | Basis |
|---|---|---|---|
| Carbon fraction (clinical waste, dry) | CF | 0.6 kg C / kg | IPCC 2006 Vol 5 Ch 5 (sample row) |
| Fraction of carbon that is fossil | FCF | by waste type | IPCC 2006 Vol 5 Ch 5 |
| Oxidation factor | OF | 1.0 (default) | IPCC 2006 Vol 5 Ch 5 |
| Carbon → CO₂ ratio | 44/12 | 3.667 | stoichiometric |
Incineration coefficients are MB waste.incineration.* rows carrying IPCC 2006 Volume 5 Chapter 5 provenance. The fossil-CO₂ figure is a derivation — Fossil CO₂ = mass × CF × FCF × OF × 3.667 — so the worked-example inputs and result are hardcoded with citation, while CH₄ and N₂O add per-tonne contributions converted at their GWP (gc_gwp, live). The carbon-fraction and fossil-fraction figures vary by waste type; confirm the specific MB row for your stream.
Composting & anaerobic digestion CH₄ N₂O biogenic CO₂ excluded
Controlled biological treatment of organic waste produces modest CH₄ and N₂O per tonne; the CO₂ released is biogenic and excluded from the headline. The IPCC default composting factor is on the order of a few kilograms of CH₄ per tonne (the sample MB row gives 10 kg CH₄ per Gg on a dry-weight basis for one stream), with a smaller N₂O term. Anaerobic digestion carries its own CH₄ and N₂O defaults. Both are far below the landfill figure for the same organic mass, because the methane is captured or oxidised rather than vented over decades — which is the entire decarbonisation argument for diverting organics from landfill.
Recycling cut-off boundary
Recycling has no treatment emission factor in this model, by design. Under the cut-off boundary the generator’s responsibility ends at the collection and any pre-processing; the recovered material enters the next product system carrying its own burden. The disposal-stage Category 5 emission for a recycled stream is therefore the collection transport (Step 4) plus on-site sorting energy, if any — not a negative number and not a treatment factor.
Step 3 — The IPCC First-Order Decay Model (Landfill)
Landfill is the only route whose emission is time-distributed, and the FOD model is the reason. It estimates the methane generated in a given year from the decomposable carbon deposited in current and prior years, decaying exponentially at a rate set by waste type and climate. For an annual corporate inventory, the Tier-1 simplification attributes a tonne’s lifetime methane potential to the year of deposition.
The FOD parameters
| Parameter | Symbol | Meaning | Value (live, MB waste.landfill.*) |
|---|---|---|---|
| Degradable organic carbon | DOC | kg C per kg wet waste, per waste component (no aggregate row) | food 0.15 · garden 0.20 · paper 0.40 · wood 0.43 · textiles 0.24 · inert 0.00 |
| Fraction of DOC dissimilated | DOCf | portion that actually decomposes | 0.5 |
| Methane correction factor | MCF | site-management adjustment | 1.0 managed-anaerobic · 0.5 semi-aerobic · 0.8 unmanaged-deep · 0.4 unmanaged-shallow · 0.6 uncategorised |
| CH₄ fraction in landfill gas | F | methane share of generated gas | 0.5 |
| Decay rate constant | k | first-order decay, yr⁻¹, by waste-stream category × climate zone | bulk MSW boreal/temperate-wet 0.09 (t½ ≈ 7.7 yr) |
| Oxidation factor | OX | CH₄ oxidised in cover soil | 0.1 covered-oxidising (managed) · 0.0 uncovered |
| Recovery | R | CH₄ captured (flared/utilised) | site-specific |
Each parameter here is a confirmed MasterBrain waste.landfill.* row carrying its IPCC 2006 Volume 5 provenance natively (exact chapter, section and table reference — e.g. DOCf → Ch 3 §3.2.3, k → Ch 3 Table 3.3, MCF → Ch 3 Table 3.1, OX → Ch 3 Table 3.2). The table renders each value live via gc_factor, so every number hyperlinks to its MB row and updates if the source is revised. What is hardcoded is the worked-example arithmetic below: a landfill emission is a multi-step derivation, not a single headline-factor lookup, the multiplication chain and its result are pinned with citation for audit reproducibility. DOC is per-component (no aggregate row); k is keyed by waste-stream category × climate zone. Source: IPCC 2006 Guidelines, Volume 5, via the MB waste.landfill.* family.
The methane generation equation, recovery and oxidation
The Tier-1 methane potential of a tonne deposited, before recovery and oxidation, follows the IPCC methane-generation relation:
Recovery (R) and oxidation (OX) are the only two legitimate reductions in the landfill figure. Both apply to managed sites: gas captured for flaring or energy is subtracted as recovered, and a fraction of the remaining methane oxidises to CO₂ as it passes through the cap. An unmanaged site has no recovery and an oxidation factor of zero — which, combined with the same DOC, is why the unmanaged route can more than double the managed figure for identical waste.
Step 4 — Collection Transport (the Live-Rendered Stream)
The one part of this methodology that updates with its source dataset is collection and haulage. Waste collection vehicles are heavy goods vehicles, so the transport emission uses the DEFRA per-vehicle-km factors (own or contracted refuse fleet) or the GLEC per-tonne-km road-freight intensity for longer hauls to a treatment site. These render live via the gc_factor shortcode:
| Vehicle / basis | Unit | Factor (live) |
|---|---|---|
| Rigid HGV — all, empty running | kg CO₂e/vehicle-km | 0.68691 |
| HGV — all types, empty running | kg CO₂e/vehicle-km | 0.66699 |
| EU/SA artic 34–40t (haul to site) | kg CO₂e/tonne-km | 0.101 |
Collection-transport factors: DEFRA 2026 (per vehicle-km) and GLEC v3.2 (per tonne-km). These are the only live values in the model — the transport factor updates when DEFRA or GLEC release; the IPCC treatment model does not. Do not mix per-vehicle-km and per-tonne-km in one term. See the road-freight methodology for the full vehicle-band selection.
Collection transport is usually a small fraction of the total for landfill or incineration — the treatment emission dominates — but it is the entire disposal-stage Category 5 emission for a recycled stream, where there is no treatment factor. That is why it is never omitted, even when it looks negligible against a landfill figure.
Step 5 — Combine and Convert to CO₂e
The total for a waste stream is the route’s treatment emission plus its collection transport, with every non-CO₂ gas converted at its global warming potential:
The biogenic / fossil carbon split
The most consequential conversion choice is which carbon counts. Carbon of biogenic origin — food, paper, wood, garden waste — is treated as part of the short biological cycle: its CO₂ on combustion or decomposition is reported separately and excluded from the headline total, consistent with combustion accounting. Only fossil-derived carbon (plastics, synthetic textiles) produces headline CO₂. Methane is the exception that makes landfill so damaging: biogenic methane from anaerobic decomposition is counted in full, because methane’s warming is not part of the neutral biogenic-CO₂ cycle.
Convert landfill and treatment methane at the AR6 100-year GWP: 29.8 [GreenCalculus gwp.CH4_fossil.ar6_100 · IPCC AR6 WGI Ch 7 Table 7.SM.7 (2021) — AR6 GWP-100 · v2026.203] for fossil-origin methane and 27 [GreenCalculus gwp.CH4_biogenic.ar6_100 · IPCC AR6] for biogenic methane (the dominant case for landfill organics). Nitrous oxide converts at 273 [GreenCalculus gwp.N2O.ar6_100 · IPCC AR6 WGI Ch 7 Table 7.SM.7 (2021) — AR6 GWP-100]. Use AR6 throughout for corporate reporting; AR5 only in DEFRA regulatory mode. The biogenic-methane GWP is the right multiplier for landfill — most landfill methane is biogenic in origin, but its warming is counted in full regardless.
Worked Examples
Three fully reconciled worked examples for a fictional manufacturer, Meridian Components Ltd, disposing of 1,000 tonnes of mixed municipal solid waste. The IPCC model parameters are confirmed MasterBrain waste.landfill.* rows (carrying IPCC 2006 Volume 5 provenance), hardcoded with their MB-key citation for audit-trail integrity; the collection-transport factor and GWPs are the live-rendered values as published in the data layer on 2026-06-08. Examples 1 and 2 show the same tonnage by two routes, to demonstrate the route swing.
Composition × DOC (MB
waste.landfill.doc.msw.*, IPCC Eq. 3.7): food 30%×0.15 + garden 15%×0.20 + paper 20%×0.40 + wood 5%×0.43 + textiles 5%×0.24 + inert 25%×0 = weighted bulk DOC 0.1885DOCf 0.5 | MCF 1.0 (managed_anaerobic) | F 0.5 | OX 0.1 (covered_oxidising) | R 20% | 16/12 = 1.333 All values are confirmed MB waste.landfill.* rows (IPCC 2006 Vol 5 Ch 2–3 provenance) — they render live in the parameter table above; here in the worked example the inputs and the multiplication chain are hardcoded snapshots (a derivation, not a single-factor lookup). DOC is per-component; bulk DOC weighted via Eq. 3.7 from the stated composition.
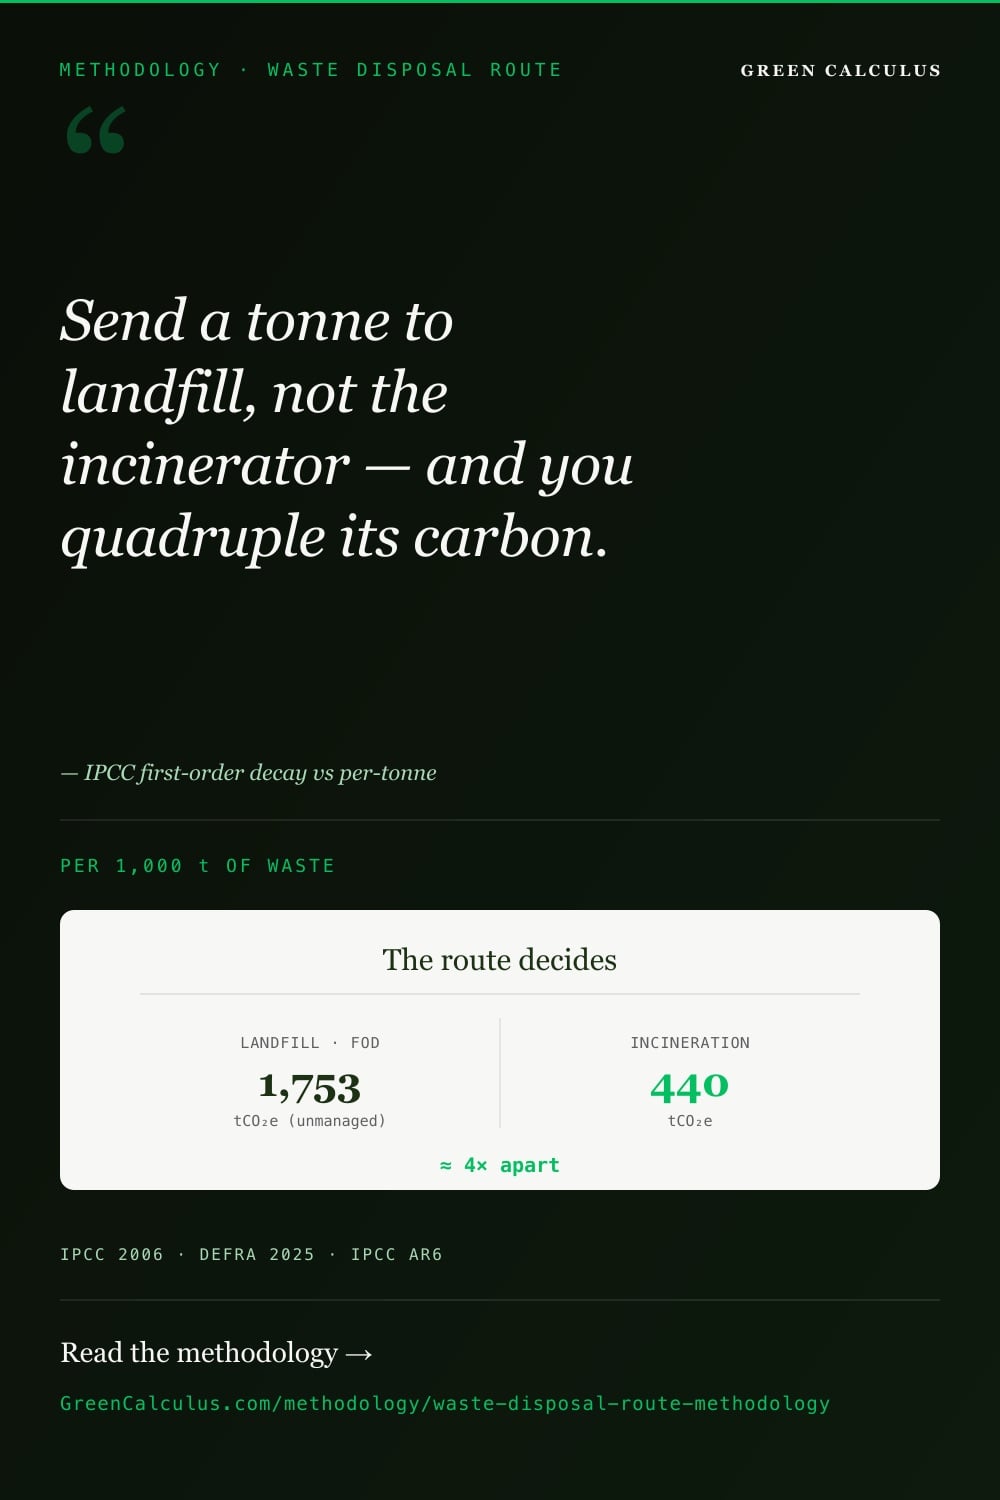
ox.uncovered = 0 and no recovery, with a higher MCF for an unmanaged-deep site — on the same waste would emit 62.83 × 27.9 = 1,753 t CO₂e at the same MCF, about 39% higher purely from losing the recovery and oxidation reductions. This is the managed-vs-unmanaged lever; the full MCF set (1.0 / 0.5 / 0.8 / 0.4 / 0.6) lets you model the site type explicitly.Total C 0.30 kg/kg | fossil fraction FCF 0.40 | oxidation OF 1.0 | 44/12 = 3.667 Illustrative carbon profile; organic-rich waste is mostly biogenic carbon. Fossil CO₂ only enters the headline; biogenic CO₂ is a memo item.
Factor: 0.67912 kg CO₂e/vehicle-km (DEFRA 2025, rigid HGV all, empty-running band — live gc_factor value) Per vehicle-km (DEFRA). This live value updates with DEFRA releases; the IPCC treatment model in Examples 1–2 does not.
Disposal-Route Comparison Matrix
Illustrative headline treatment emissions per 1,000 t of the same mixed MSW, from the worked examples (composting indicative). Excludes collection transport and energy-recovery credits. The route, not the waste, drives the ~35× spread between composting and unmanaged landfill. Model values: confirmed MB waste.landfill.* rows (IPCC 2006 Vol 5), hardcoded; snapshot 2026-06-08.
| Route | Model | Dominant gas | Biogenic CO₂ treatment |
|---|---|---|---|
| Landfill | IPCC First-Order Decay (time-distributed) | CH₄ (biogenic, counted in full) | N/A — gas is methane, not CO₂ |
| Incineration | Combustion: C × FCF × OF × 44/12 | fossil CO₂ (+ CH₄, N₂O) | Reported separately, excluded from headline |
| Composting | Per-tonne biological EF | CH₄ + N₂O | Excluded (biogenic) |
| Anaerobic digestion | Per-tonne biological EF | CH₄ + N₂O | Excluded (biogenic); biogas energy credited elsewhere |
| Recycling | Cut-off — no treatment EF | transport + processing only | N/A |
Edge Cases & Error Traps
| Error | What happens | Consequence | How to avoid |
|---|---|---|---|
| Treating landfill methane as instantaneous | Assuming the landfill figure is this year’s measured release rather than a modelled lifetime projection. | Misread inventory Under Tier-1 the tonne’s lifetime CH₄ is booked at deposition; this is a modelling convention, not a measurement of the reporting year. |
Apply the IPCC FOD Tier-1 convention and state it. Do not reconcile against measured site gas for the same year. |
| Counting recycling as avoided emissions | Booking a negative number for recycled material in the attributional Category 5 figure. | Overstated reduction Cut-off accounting gives the generator no avoided-burden credit; the recycler carries the downstream burden. |
Use cut-off: recycling’s disposal emission is transport + processing only. Keep avoided-burden in a labelled consequential analysis. |
| Putting biogenic CO₂ in the headline | Counting CO₂ from food/paper/wood combustion or decomposition in the total. | Double-counted carbon Biogenic CO₂ is part of the short cycle; counting it overstates the total and breaks comparability with combustion accounting. |
Report biogenic CO₂ as a memo item, excluded from the headline. Count biogenic methane in full — that is the exception. |
| Double-counting methane recovery | Subtracting recovered gas AND crediting the energy it generates against the same waste. | Overstated reduction Recovery (R) reduces the landfill CH₄; the energy displacement is a separate Scope 2 credit, not a second deduction here. |
Subtract R once in the FOD net-CH₄ step; account any energy credit separately, clearly labelled. |
| Expecting a single aggregate DOC row | Looking up one “DOC for MSW” value instead of weighting the per-component rows. | Wrong methane potential There is no aggregate DOC row — DOC is per waste component. A single guessed value can misstate the landfill term substantially. |
Weight the per-component DOC rows by your waste composition (IPCC Eq. 3.7): bulk DOC = Σ DOCᵢ × Wᵢ. Show the composition you assume. |
| Omitting collection transport on recycled streams | Recording zero for a recycled stream because it has no treatment factor. | Understated Cat 5 For recycling, transport + processing IS the disposal-stage emission — zero is wrong. |
Always compute the Category 4 collection transport, even when the treatment term is zero. |
Governance, Assurance & Data Quality
A waste inventory is auditable when each route’s inputs trace to source: waste tonnage by destination to weighbridge tickets and waste-transfer notes; the disposal route to the contractor’s licensed treatment type; and the IPCC parameter choices to the published defaults or to site-specific measurements where available. The data-quality hierarchy mirrors the IPCC tiers.
- Tier 1 (default): IPCC 2006 Volume 5 default parameters by waste type and climate — the method on this page, suitable for most corporate inventories.
- Tier 2 (country/site): nationally or operator-derived DOC, k and MCF where the regulator or site publishes them.
- Tier 3 (measured): site-specific gas-capture and composition data, used where a landfill operator measures recovered methane directly.
- Transport: collection distance and vehicle band to telematics or contractor statements; render the DEFRA/GLEC factor live.
- Disclosure: state the tier, the GWP basis (AR6), the parameter source (IPCC 2006 Vol 5), and the biogenic/fossil split, so an assurer can replay each route.
Licensed waste contractors issue transfer notes recording tonnage and destination treatment type. These are the primary input to route allocation and convert directly to tier-appropriate activity data — linking the inventory to the transfer-note record removes most of the uncertainty in which IPCC model applies to which tonnage.
What a Calculator Handles vs What You Decide
The IPCC arithmetic is mechanical once the route and parameters are fixed; the judgement is in route allocation, parameter tiering and the biogenic split. The Waste by Disposal Route Calculator automates this arithmetic.
- Landfill FOD arithmetic (DOC × DOCf × MCF × F × 16/12, recovery, oxidation)
- Incineration combustion factors (C × FCF × OF × 44/12, plus CH₄/N₂O)
- Composting / anaerobic-digestion per-tonne factors
- CH₄ and N₂O → CO₂e at the AR6 GWP
- Collection-transport conversion (DEFRA per-km / GLEC per-tonne-km)
- Route allocation: which tonnage goes to which destination, from transfer notes
- Parameter tier: IPCC default vs country/site DOC, k, MCF
- Managed vs unmanaged: the MCF, recovery and oxidation that apply to the site
- Biogenic / fossil split: which carbon counts in the headline
- Recycling boundary: cut-off attributional vs labelled consequential
A dedicated waste-by-route calculator and a per-material waste-streams calculator are on the GreenCalculus roadmap. Until they ship, the per-route arithmetic above plus the live collection-transport factor produce the Category 5 and Category 4 figures this methodology requires.
Methodology Metadata — For Inventory Documentation
Copy into your waste-inventory documentation. The IPCC model parameters are cited constants; the collection-transport factor and GWPs are live references that update with their source datasets.
waste.landfill.* / waste.incineration.* / waste.composting.* rows carrying IPCC provenance natively — they render live via gc_factor in the reference tables; the worked-example derivations are hardcoded with citation (a multi-step calculation, not a single-factor lookup).
waste.landfill.* rows, hardcoded; transport + GWP live.
Frequently Asked Questions
Because each route releases the waste’s carbon and nitrogen differently. Landfill lets the degradable organic fraction decompose anaerobically into methane over decades — a powerful greenhouse gas. Incineration oxidises the carbon immediately, with only the fossil fraction counted in the headline. Composting and anaerobic digestion produce only small amounts of methane and nitrous oxide because the process is controlled. For the same organic-rich tonne the spread between composting and unmanaged landfill is commonly more than an order of magnitude — the destination, not the material, drives the footprint.
It is the IPCC 2006 Volume 5 method for estimating landfill methane. Rather than treating the emission as instantaneous, it models the degradable organic carbon decomposing exponentially over many years, at a decay rate set by waste type and climate. The methane generated is a function of the waste’s degradable organic carbon (DOC), the fraction that dissimilates (DOCf), the methane correction factor for the site (MCF), the methane share of the gas (F) and the decay constant (k). For an annual corporate inventory the Tier-1 simplification attributes a tonne’s lifetime methane to its deposition year — so the reported figure is a modelled projection, not a measurement of that year’s release.
Not in standard corporate accounting. The GHG Protocol uses the cut-off (recycled-content) approach: the generator’s responsibility ends at collection and any pre-processing, and the recovered material carries its own burden into the next product system. So a recycled stream’s disposal-stage Category 5 emission is the collection transport plus any sorting energy — not a credit. Avoided-burden benefits (displacing virgin material) belong in a separate, clearly labelled consequential analysis, never in the attributional inventory figure.
Biogenic CO₂ — from food, paper, wood and garden waste — is reported as a memo item and excluded from the headline total, consistent with how biogenic carbon is handled in combustion accounting, because it is part of the short biological cycle. The crucial exception is methane: biogenic methane from anaerobic decomposition in landfill is counted in full, because its warming effect is not part of the neutral biogenic-CO₂ cycle. So a landfill’s biogenic methane is a headline emission even though the equivalent biogenic CO₂ would not be.
The treatment emissions from waste your operations generate and send to a third party are Category 5 (waste generated in operations). The collection and haulage of that waste to the treatment site is Category 4 (upstream transport and distribution). If you treat the waste in equipment you own and operate, the treatment emission becomes Scope 1 — the IPCC model is identical, only the scope changes. Collection transport is computed for every route, because for recycling it is essentially the entire disposal-stage figure.
Yes, once. Recovered methane — captured for flaring or energy — is subtracted in the net-methane step of the FOD model, and a further oxidation factor reduces the methane that passes through the landfill cap. Both apply only to managed sites; an unmanaged site has no recovery and an oxidation factor of zero, which is why it can emit substantially more for identical waste. The energy generated from recovered gas is a separate Scope 2 displacement credit and must not be deducted a second time against the same waste.
The two are different things. Each parameter — DOC, DOCf, MCF, F, k, oxidation — is its own MasterBrain row with a real value, so the reference tables render it live and the number links to its source. But a landfill emission is not a single factor you look up; it is a multi-step derivation (mass × DOC × DOCf × MCF, then decay, then × F × 16/12, then × (1 − OX), then × the methane GWP). There is no one “landfill emission factor” row to surface, because the figure is computed. Under the editorial worked-example rule, a derivation and its result are hardcoded with citation so a verifier can replay the exact arithmetic the calculator produced on the review date. So the inputs render live; the calculation is pinned.