
RGGI: Allowance Price Today and How the Regional Greenhouse Gas Initiative Works

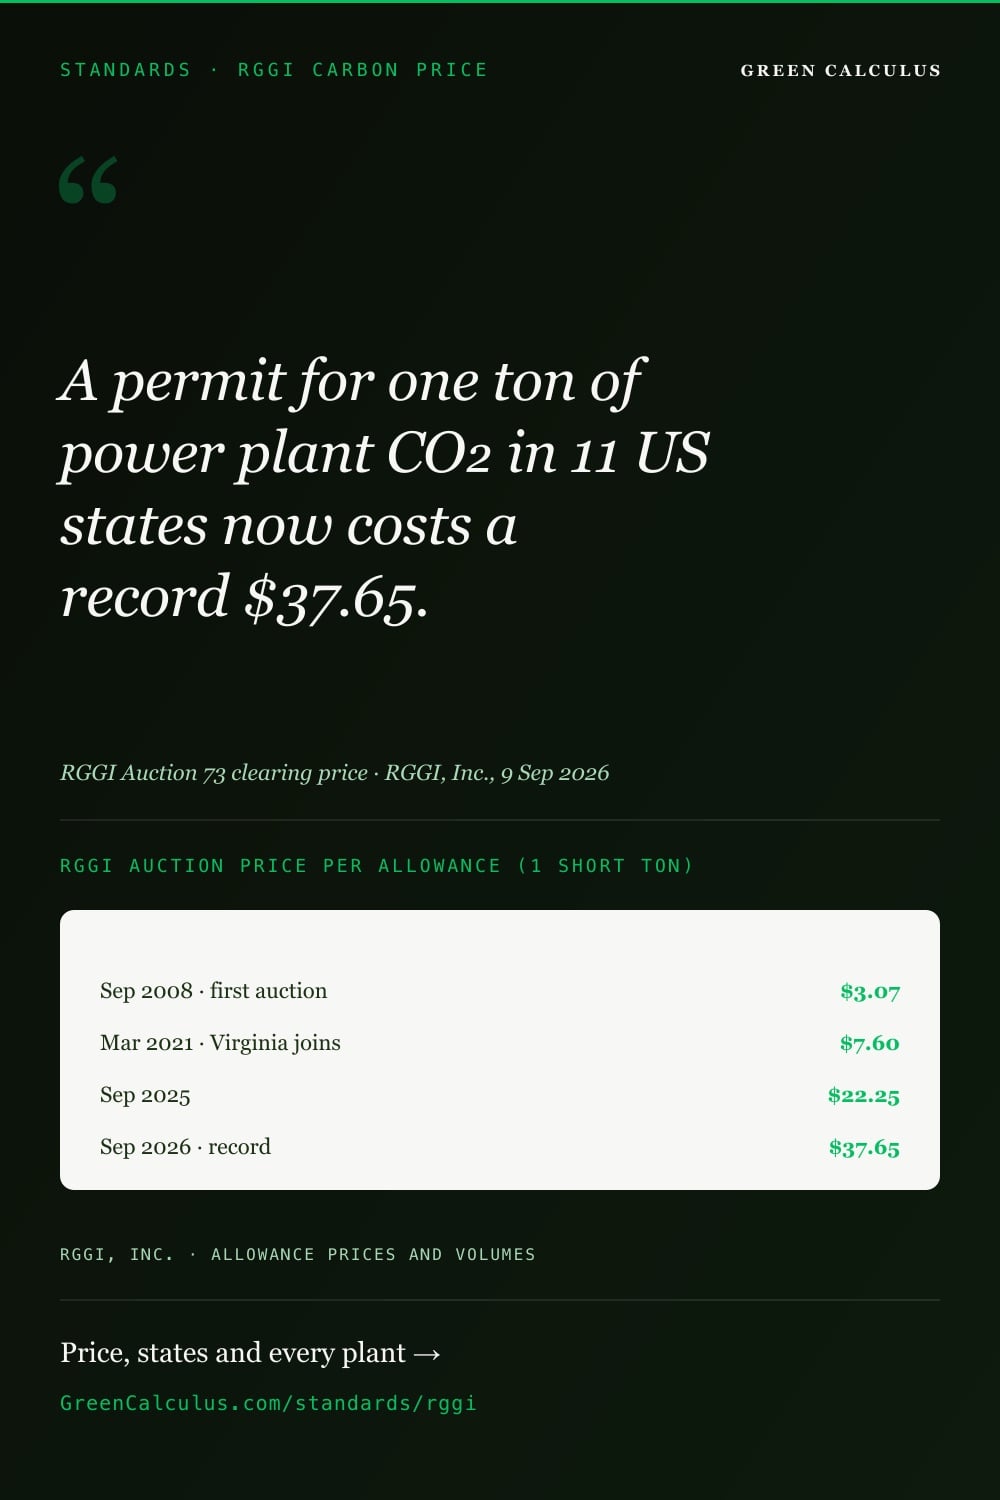
The Regional Greenhouse Gas Initiative (RGGI) is a cap-and-invest program for power plants in 11 eastern US states. Fossil-fuel plants of 25 MW or more must hold one allowance for each short ton of CO₂ they emit, and the states sell most allowances at quarterly auctions. The latest RGGI auction (Auction 73, 9 September 2026) cleared at $37.65 per allowance, the right to emit one short ton of CO₂, up 69% on a year earlier ($22.25). The next auction is on 2 December 2026.
Prices from RGGI, Inc.’s auction results, checked 2 November 2026 and refreshed automatically after each auction. GreenCalculus does not trade allowances, takes no commission from brokers, and this page has no affiliate links.
What changed recently
- 9 Sep 2026: Auction 73 cleared at $37.65, the highest price in RGGI’s history. All 1,148,000 cost containment reserve allowances on offer were sold, so none are left for Auction 74 on 2 December.
- 1 Jul 2026: Virginia rejoined RGGI. Its plants must cover their emissions for the second half of 2026, and Auction 73 included 5,740,000 Virginia allowances.
- Apr–May 2026: secondary market prices jumped from about $28 to a peak of $52. The states said around 60 million surplus allowances were in circulation and that a sustained period of high auction prices “would not meet” their goals.
- 12 Nov 2025: Pennsylvania’s legislature voted to withdraw the state from RGGI as part of its budget, ending a court fight that had kept it out since 2019.
- 3 Jul 2025: the states finished the Third Program Review. A lower cap, a $9.00 minimum price and a second reserve tier take effect on 1 January 2027.
RGGI price today and every auction since 2008
The RGGI price is the price of one allowance, the right to emit one short ton (2,000 pounds) of CO₂. The official price is the clearing price of the quarterly auction: every winning bidder pays the same price, and RGGI, Inc. publishes it two days after the auction.
Between auctions, allowances also trade on a secondary market, through futures on ICE and Nodal Exchange or directly between companies. Those prices move every day, so a live quote can differ from the last auction by several dollars. The chart shows every auction since the first one in September 2008.
Show every auction as a table
| Auction | Date | Clearing price | Reserve released |
|---|---|---|---|
| 73 | 9 Sep 2026 | $37.65 | 1,148,000 |
| 72 | 3 Jun 2026 | $35.00 | No |
| 71 | 11 Mar 2026 | $24.99 | 7,853,278 |
| 70 | 3 Dec 2025 | $26.73 | No |
| 69 | 3 Sep 2025 | $22.25 | No |
| 68 | 4 Jun 2025 | $19.63 | No |
| 67 | 12 Mar 2025 | $19.76 | 8,134,778 |
| 66 | 4 Dec 2024 | $20.05 | No |
| 65 | 4 Sep 2024 | $25.75 | No |
| 64 | 5 Jun 2024 | $21.03 | No |
| 63 | 13 Mar 2024 | $16.00 | 8,416,278 |
| 62 | 6 Dec 2023 | $14.88 | 5,565,291 |
| 61 | 6 Sep 2023 | $13.85 | No |
| 60 | 7 Jun 2023 | $12.73 | No |
| 59 | 8 Mar 2023 | $12.50 | No |
| 58 | 7 Dec 2022 | $12.99 | No |
| 57 | 7 Sep 2022 | $13.45 | No |
| 56 | 1 Jun 2022 | $13.90 | No |
| 55 | 9 Mar 2022 | $13.50 | No |
| 54 | 1 Dec 2021 | $13.00 | 3,919,482 |
| 53 | 8 Sep 2021 | $9.30 | No |
| 52 | 2 Jun 2021 | $7.97 | No |
| 51 | 3 Mar 2021 | $7.60 | No |
| 50 | 2 Dec 2020 | $7.41 | No |
| 49 | 2 Sep 2020 | $6.82 | No |
| 48 | 3 Jun 2020 | $5.75 | No |
| 47 | 11 Mar 2020 | $5.65 | No |
| 46 | 4 Dec 2019 | $5.61 | No |
| 45 | 4 Sep 2019 | $5.20 | No |
| 44 | 5 Jun 2019 | $5.62 | No |
| 43 | 13 Mar 2019 | $5.27 | No |
| 42 | 5 Dec 2018 | $5.35 | No |
| 41 | 5 Sep 2018 | $4.50 | No |
| 40 | 13 Jun 2018 | $4.02 | No |
| 39 | 14 Mar 2018 | $3.79 | No |
| 38 | 6 Dec 2017 | $3.80 | No |
| 37 | 6 Sep 2017 | $4.35 | No |
| 36 | 7 Jun 2017 | $2.53 | No |
| 35 | 8 Mar 2017 | $3.00 | No |
| 34 | 7 Dec 2016 | $3.55 | No |
| 33 | 7 Sep 2016 | $4.54 | No |
| 32 | 1 Jun 2016 | $4.53 | No |
| 31 | 9 Mar 2016 | $5.25 | No |
| 30 | 2 Dec 2015 | $7.50 | No |
| 29 | 9 Sep 2015 | $6.02 | 10,000,000 |
| 28 | 3 Jun 2015 | $5.50 | No |
| 27 | 11 Mar 2015 | $5.41 | No |
| 26 | 3 Dec 2014 | $5.21 | No |
| 25 | 3 Sep 2014 | $4.88 | No |
| 24 | 4 Jun 2014 | $5.02 | No |
| 23 | 5 Mar 2014 | $4.00 | 5,000,000 |
| 22 | 4 Dec 2013 | $3.00 | No |
| 21 | 4 Sep 2013 | $2.67 | No |
| 20 | 5 Jun 2013 | $3.21 | No |
| 19 | 13 Mar 2013 | $2.80 | No |
| 18 | 5 Dec 2012 | $1.93 | No |
| 17 | 5 Sep 2012 | $1.93 | No |
| 16 | 6 Jun 2012 | $1.93 | No |
| 15 | 14 Mar 2012 | $1.93 | No |
| 14 | 7 Dec 2011 | $1.89 | No |
| 13 | 7 Sep 2011 | $1.89 | No |
| 12 | 8 Jun 2011 | $1.89 | No |
| 11 | 9 Mar 2011 | $1.89 | No |
| 10 | 1 Dec 2010 | $1.86 | No |
| 9 | 8 Sep 2010 | $1.86 | No |
| 8 | 9 Jun 2010 | $1.88 | No |
| 7 | 10 Mar 2010 | $2.07 | No |
| 6 | 2 Dec 2009 | $2.05 | No |
| 5 | 9 Sep 2009 | $2.19 | No |
| 4 | 17 Jun 2009 | $3.23 | No |
| 3 | 18 Mar 2009 | $3.51 | No |
| 2 | 17 Dec 2008 | $3.38 | No |
| 1 | 25 Sep 2008 | $3.07 | No |
Source: RGGI, Inc., Allowance Prices and Volumes. Early auctions also sold a few future-year allowances at a separate price; those are left out here and kept in the JSON download.
For most of RGGI’s history the price stayed low. All 18 auctions before 2013 cleared between $1.86 and $3.51, and the price did not reach $10 until December 2021. It has climbed fast since: $19.76 to $26.73 across the four auctions of 2025, then $24.99, $35.00 and $37.65 in 2026. The amber dots mark the 8 auctions where prices passed the trigger and the states released extra allowances from the cost containment reserve.
| Year | Auctions | Allowances sold | Average (by volume) | Range | Proceeds |
|---|---|---|---|---|---|
| 2026 | 3 | 72,975,700 | $32.46 | $24.99–$37.65 | $2.37 billion |
| 2025 | 4 | 69,179,497 | $21.81 | $19.63–$26.73 | $1.51 billion |
| 2024 | 4 | 72,212,561 | $20.17 | $16.00–$25.75 | $1.46 billion |
| 2023 | 4 | 93,153,874 | $13.58 | $12.50–$14.88 | $1.26 billion |
| 2022 | 4 | 88,678,968 | $13.46 | $12.99–$13.90 | $1.19 billion |
| 2021 | 4 | 96,407,403 | $9.61 | $7.60–$13.00 | $926 million |
| 2020 | 4 | 64,974,925 | $6.41 | $5.65–$7.41 | $416 million |
| 2019 | 4 | 52,337,780 | $5.43 | $5.20–$5.62 | $284 million |
| 2018 | 4 | 54,275,548 | $4.41 | $3.79–$5.35 | $239 million |
| 2017 | 4 | 58,028,344 | $3.42 | $2.53–$4.35 | $198 million |
| 2016 | 4 | 59,631,014 | $4.47 | $3.55–$5.25 | $266 million |
| 2015 | 4 | 71,528,809 | $6.10 | $5.41–$7.50 | $436 million |
| 2014 | 4 | 77,751,106 | $4.72 | $4.00–$5.21 | $367 million |
| 2013 | 4 | 153,355,902 | $2.92 | $2.67–$3.21 | $448 million |
| 2012 | 4 | 86,863,000 | $1.93 | $1.93–$1.93 | $168 million |
| 2011 | 4 | 89,312,813 | $1.89 | $1.89–$1.89 | $175 million |
| 2010 | 4 | 140,459,993 | $1.93 | $1.86–$2.07 | $283 million |
| 2009 | 4 | 119,402,028 | $2.77 | $2.05–$3.51 | $349 million |
| 2008 | 2 | 44,071,285 | $3.29 | $3.07–$3.38 | $145 million |
Source: RGGI, Inc., Allowance Prices and Volumes. Averages weighted by allowances sold, worked out by GreenCalculus. Proceeds from all 73 auctions: $12.49 billion.
Secondary market prices
RGGI’s independent market monitor, Potomac Economics, reports secondary market prices every quarter. In the second quarter of 2026 (April to June) the averages were well above the auction price, after a spike in April and May:
| Price | Average | High | Low |
|---|---|---|---|
| ICE futures | $40.75 | $52.32 | $28.35 |
| Nodal Exchange futures | $43.58 | $52.38 | $37.94 |
| Transfers recorded in RGGI COATS | $40.78 | $50.30 | $23.37 |
| Auction 72 (3 June) | $35.00 | — | — |
Source: Potomac Economics, Report on the Secondary Market for RGGI CO₂ Allowances, Q2 2026, Figure 2 (volume-weighted averages; checked 2 November 2026).
Provider directory
Need help keeping this up all year?
See who does this work. Every listing names the standards it works to, and paid placements are labelled. Including Anthesis Group and KERAMIDA.
Browse 6 carbon accounting & inventory providers →Do this work? A listing is US$390 a year. Get listed →
Look up a power plant
Every RGGI power plant reports its emissions to the US EPA, which publishes them in its Clean Air Markets Program Data. We pulled the yearly totals for every plant with units in EPA’s RGGI program, so you can see what a plant emitted and roughly what that many allowances cost at today’s price. In 2025, 171 covered plants emitted 87.2 million short tons of CO₂.
209 plants with units in EPA's RGGI program in 2023–2025. Virginia plants also show 2025 emissions from before Virginia rejoined, marked as not covered.
| Plant | State | CO₂ 2025 (short tons) | Allowances at $37.65 |
|---|---|---|---|
| Linden Cogeneration Facility | NJ | 3,244,902 | $122 million |
| Brandon Shores | MD | 2,774,751 | $104 million |
| Astoria Energy | NY | 2,681,720 | $101 million |
| Northport | NY | 2,647,751 | $100 million |
| Independence | NY | 2,599,219 | $98 million |
| Lake Road Generating Company | CT | 2,407,142 | $91 million |
| Bethlehem Energy Center (Albany) | NY | 2,160,024 | $81 million |
| East River | NY | 2,010,404 | $76 million |
| Linden Generating Station | NJ | 2,000,090 | $75 million |
| CPV St. Charles Energy Center | MD | 1,982,955 | $75 million |
Source: US EPA, Clean Air Markets Program Data (annual emissions by facility, units in the RGGI program; public domain). The cost column is tons × the Auction 73 price, for scale only: plants buy across many auctions and the secondary market, and hold banked allowances.
Two cautions. First, EPA’s totals are not exactly the same as a plant’s RGGI obligation: some CO₂ from eligible biomass is not counted, and New York also covers plants from 15 MW. Second, the cost column is a scale, not a bill. Plants buy allowances across many auctions and on the secondary market, often years ahead, and many hold banked allowances bought at lower prices.
Which states are in RGGI?
Eleven states take part: Connecticut, Delaware, Maine, Maryland, Massachusetts, New Hampshire, New Jersey, New York, Rhode Island, Vermont and Virginia. Each runs its own CO₂ Budget Trading Program under its own law, based on a shared Model Rule, and a plant can use an allowance issued by any of them.
| State | Status | Membership | Covered plants 2025 | Covered CO₂ 2025 |
|---|---|---|---|---|
| Connecticut | In RGGI | Since 2009 | 15 | 9.9 million t |
| Delaware | In RGGI | Since 2009 | 8 | 2.2 million t |
| Maine | In RGGI | Since 2009 | 5 | 2.4 million t |
| Maryland | In RGGI | Since 2009 | 13 | 11.5 million t |
| Massachusetts | In RGGI | Since 2009 | 23 | 7.9 million t |
| New Hampshire | In RGGI | Since 2009 | 5 | 2.9 million t |
| New Jersey | In RGGI | 2009–2011, and again since 2020 | 23 | 13.8 million t |
| New York | In RGGI | Since 2009 | 72 | 32.7 million t |
| Rhode Island | In RGGI | Since 2009 | 5 | 3.8 million t |
| Vermont | In RGGI | Since 2009 | 2 | 0.0 million t |
| Virginia | In RGGI | 2021–2023, and again since 1 July 2026 | — | Not covered (31.6 million t) |
| Pennsylvania | Not in RGGI | Never an active member: directed to join in 2019, kept out by a court fight, then withdrawn by the legislature in November 2025 | — | — |
Membership from RGGI, Inc., Compliance (read 2 November 2026); plants and CO₂ from US EPA CAMPD.
Virginia and RGGI
Virginia first took part from 2021 to 2023, left, and resumed participation on 1 July 2026. Because it rejoined mid-year, its plants only have to cover their emissions for the second half of 2026. The states said in May 2026 that Virginia would bring 11.48 million allowances to the 2026 auctions, plus 1.148 million cost containment reserve allowances; 5.74 million Virginia allowances and all 1.148 million reserve allowances were sold in Auction 73.
The 26 Virginia plants that were in RGGI in 2023 emitted 31.6 million short tons of CO₂ in 2025, while Virginia was outside the program. You can look each one up above. Virginia will align its rules with the 2025 Model Rule by 1 January 2027, and the 2027 cap below already includes Virginia.
Is Pennsylvania in RGGI?
No. Governor Tom Wolf directed Pennsylvania to join RGGI in 2019, but a court fight over whether the program amounted to a tax, which only the legislature can impose, kept the state from ever becoming an active member. A state appeals court ruled against the regulation, and Governor Josh Shapiro appealed. On 12 November 2025 the legislature voted to withdraw from RGGI as part of a budget deal (156 to 47 in the House, 40 to 9 in the Senate), and the Pennsylvania Supreme Court then dismissed the remaining appeals as moot. Pennsylvania never took part in a RGGI auction.
New Jersey and RGGI
New Jersey was one of the original states in the first control period (2009 to 2011), left, and resumed participation in 2020. The largest single emitter in the program in 2025 was a New Jersey plant, Linden Cogeneration; the states table above shows each state’s covered plants and CO₂.
How RGGI works
RGGI is a cap-and-invest program. The states set a regional cap on CO₂ from power plants and issue one allowance for each short ton under it. Every fossil-fuel plant of 25 MW or more must hold allowances equal to its emissions. Most allowances are sold at auction, and the states spend the money on energy efficiency, clean energy and bill assistance. Selling allowances rather than giving them to plants is the “invest” part: RGGI says auctioning avoids windfall profits for plant owners and pays for those programs.
- Auctions. Four a year, sealed-bid and uniform price: the price is set where demand meets supply, and every winning bidder pays it. They are open to all qualified participants, not only power plants.
- Trading. Allowances can be held, banked for later years and traded. Anyone with an account in RGGI COATS, the tracking system, can hold and transfer allowances.
- Compliance. Plants hand over allowances in three-year control periods. In each of the first two years they must cover half that year’s emissions; at the end of the third year they cover everything that remains.
RGGI is not a tax. A tax sets the price and lets emissions vary; RGGI sets the quantity of allowances and lets auctions find the price, within a floor and some release valves. That question is the reason Pennsylvania’s courts got involved, and Pennsylvania’s appeals court did treat the state’s version as a tax. For how carbon taxes compare, see our carbon price explainer.
Price controls in 2026
- Reserve price, $2.69: the lowest price at which allowances can be sold at an auction.
- Cost containment reserve (CCR), trigger $18.22: extra allowances, up to 10% of the cap, released if bids would push the price above the trigger. It has been released in 8 auctions, including March and September 2026.
- Emissions containment reserve (ECR), trigger $8.41: allowances withheld if the price would fall below the trigger. Maine and New Hampshire do not take part. Prices have been well above it, and none were withheld in Auction 73.
Offset allowances, from projects outside the power sector, can cover up to 3.3% of a plant’s obligation today, but they have barely been used: only one RGGI offset project has ever been developed, earning 53,506 tons.
What changes on 1 January 2027
The Third Program Review ended on 3 July 2025 with a new Model Rule. Each state has committed to change its own rules to match, effective 1 January 2027. The main changes:
- A lower cap. 90,215,808 allowances in 2027 for the 11 states, against 97,837,784 under the old rule. It then falls by about 11.1 million a year to 2033 (roughly 10.5% of the 2025 budget each year), and by about 3.1 million a year from 2034 to 2037. Banked allowances are not cut; the states estimated the private bank at around 67 million in July 2025.
- A higher floor. The emissions containment reserve goes, replaced by a minimum reserve price of $9.00 in 2027, rising 7% a year.
- A second reserve tier. The cost containment reserve gets two tiers of about 15.18 million allowances each, triggered at $19.50 and $29.25 in 2027 and rising 7% a year. Both triggers are below today’s auction price.
- No new offsets. No new offset allowances will be awarded; ones already awarded can still be used within the limit.
- Unsold allowances retired at the end of each auction, and a Fourth Program Review to start no later than 2028.
| Year | Cap (allowances) | Minimum reserve price | CCR tier 1 trigger | CCR tier 2 trigger |
|---|---|---|---|---|
| 2027 | 90,215,808 | $9.00 | $19.50 | $29.25 |
| 2028 | 78,938,832 | $9.63 | $20.87 | $31.30 |
| 2029 | 67,661,856 | $10.30 | $22.33 | $33.49 |
| 2030 | 56,384,880 | $11.02 | $23.89 | $35.83 |
| 2031 | 45,482,056 | $11.79 | $25.56 | $38.34 |
| 2032 | 34,579,233 | $12.62 | $27.35 | $41.02 |
| 2033 | 23,676,410 | $13.50 | $29.26 | $43.89 |
| 2034 | 20,561,317 | $14.45 | $31.31 | $46.96 |
| 2035 | 17,446,225 | $15.46 | $33.50 | $50.25 |
| 2036 | 14,331,134 | $16.54 | $35.85 | $53.77 |
| 2037 | 11,216,041 | $17.70 | $38.36 | $57.53 |
Source: RGGI, Inc., Program Review: Summary of Program Review Changes, Figure 2, and the 2025 Model Rule. Each CCR tier holds 15,180,546 allowances a year. For comparison, 2026: cap 90,012,784, reserve price $2.69, CCR trigger $18.22, ECR trigger $8.41.
If every tier 1 reserve allowance were sold each year, the cap would still fall 74% by 2037 compared with 2025; if both tiers were sold every year, 60%. Those are the states’ own figures and leave out the bank.
Compliance deadline: 1 March 2027
The sixth control period runs from 1 January 2024 to 31 December 2026. Plants have already covered half of their 2024 and 2025 emissions; by 1 March 2027 they must hold allowances for everything that remains. Auction 74 on 2 December 2026 is the last auction before that deadline.
- Auction 74 The last quarterly auction before plants must cover their emissions for the sixth control period (2024–2026).
- New RGGI rules take effect Lower cap, a $9.00 minimum reserve price, a second cost containment reserve tier, and no new offset allowances.
- Fourth-quarter 2026 emissions data due to EPA
- Sixth control period compliance deadline Each power plant must hold allowances for all of its remaining 2024–2026 emissions by 11:59 pm Eastern.
- Compliance data made public Allowances in compliance accounts are frozen in RGGI COATS and the submitted data is published.
Dates from RGGI, Inc., Sixth Control Period Compliance Fact Sheet (31 August 2026). The 2027 auction dates are not yet published.
Does RGGI raise electricity bills?
Allowances are a cost for power plants, and some of it reaches wholesale electricity prices. How much shows up on a household bill depends on the price, the state’s power mix and how the auction money is spent. The best published estimate is the states’ own, for the 2027 changes, so read it with that in mind.
For the Third Program Review, the states had Analysis Group model monthly bills from 2028 to 2037 under the new rules against the old ones (with the allowance price at the average of the 12 auctions before mid-2025). For an average residential customer, the change was $0.40 a month higher (0.41%) in one policy scenario and $0.59 lower in the other, before any of the auction money was spent on bill assistance. All results were within 1%. The analysis compares the new rules with the old rules, not RGGI with no RGGI, and it was done before 2026’s higher prices.
The other side of the ledger is the auction money. RGGI auctions have raised $12.49 billion since 2008. In 2024 the states invested $856 million, 46% of it in energy efficiency, with the rest going to bill assistance, clean energy, electrification and other programs. The states project those 2024 investments will save households and businesses $2.6 billion on energy bills over their lifetime and avoid 4.4 million short tons of CO₂. Each state decides how to spend its share.
Has RGGI cut emissions?
Power-sector CO₂ in the RGGI states has fallen a lot. RGGI, Inc. reports that the ten long-standing states cut it 43% against a 2006 to 2008 baseline, faster than the US as a whole, and that the RGGI states have cut annual power-sector emissions 50% since 2005, using EIA data for 2024. Those figures show what happened, not how much of it RGGI caused: cheaper natural gas, state clean energy laws and new wind and solar all pushed the same way.
RGGI does put a number on one part of it: the CO₂ avoided by programs paid for with auction money. Its 2024 proceeds report estimates that programs funded in 2024 will avoid 267,502 short tons a year, and 4.4 million over their lifetime. Roger Caiazza, who has worked on New York’s power-plant cap-and-trade programs since they began, adds up the yearly figures (not the lifetime ones) from every proceeds report. By his count, RGGI-funded programs were avoiding about 5.0 million short tons a year by 2024: 8.7% of the 57.3 million ton fall from the 2006 to 2008 baseline in the nine states he tracks. He reads that as the part RGGI caused, with most of the rest down to power plants switching from coal and oil to natural gas. RGGI says its figures count only the direct benefits of funded projects, and leave out any wider effect of the cap and its price signal.
Year to year, emissions can still rise. In EPA’s data, covered plants emitted 82.9 million short tons in 2024 and 87.2 million in 2025, up 5%, in the same ten states. (2023’s 103.0 million included Virginia’s plants.)
RGGI, California and Washington compared
California’s cap-and-trade program and Washington’s cap-and-invest program are the two other large US state carbon markets. They cover far more of their economies: the World Bank puts their coverage at 76% and 71% of greenhouse gas emissions, against 14% for RGGI, which covers power plants only. Its prices on 1 April each year put the three side by side.
- 2021$8.69$17.94no market yet
- 2022$13.89$30.82no market yet
- 2023$15.39$29.84$22.20
- 2024$17.64$38.59$25.75
- 2025$23.32$29.27$50.00
- 2026$26.43$29.05$65.27
Show the numbers as a table
| Year | RGGI | California | Washington |
|---|---|---|---|
| 2021 | $8.69 | $17.94 | — |
| 2022 | $13.89 | $30.82 | — |
| 2023 | $15.39 | $29.84 | $22.20 |
| 2024 | $17.64 | $38.59 | $25.75 |
| 2025 | $23.32 | $29.27 | $50.00 |
| 2026 | $26.43 | $29.05 | $65.27 |
Source: World Bank, Carbon Pricing Dashboard (CC BY 4.0), as held in the GreenCalculus MasterBrain.
Treat the comparison as rough: the World Bank reports one day a year, and it says its prices are not directly comparable across programs because coverage and rules differ. For Europe and the UK, see the EU ETS and the UK ETS price tracker. To use a carbon price in your own planning, try the internal carbon price calculator; to see a plant’s CO₂ per megawatt-hour by grid region, see EPA eGRID.
Download the data
Everything in the charts and the lookup is free to download. The auction file updates after each auction, and the plant file when EPA publishes a new full year.
- Every auction (CSV)Date, allowances offered and sold, reserve allowances sold, clearing price and proceeds for all 73 auctions. Updated after each auction.
- Power plants (CSV)CO₂ by plant and year from EPA CAMPD, with whether RGGI covered it that year.
- Auctions (JSON)Every auction, the future-year allowances sold in early auctions, and the next auction, with sources.
Free to reuse with credit to GreenCalculus. Auction data from RGGI, Inc.; plant emissions from US EPA CAMPD (public domain).
Frequently asked questions
The latest RGGI auction (Auction 73, 9 September 2026) cleared at $37.65 per allowance, the right to emit one short ton of CO₂, up 69% on a year earlier ($22.25). The next auction is on 2 December 2026. Allowances also trade every day on the secondary market, where prices can differ from the last auction by several dollars.
A shared limit on CO₂ from power plants in 11 eastern states. The states issue one allowance per short ton under the limit, sell most of them at auction, and spend the money on energy programs. Each fossil-fuel plant of 25 MW or more must hold enough allowances to cover its emissions. It started in 2009.
Connecticut, Delaware, Maine, Maryland, Massachusetts, New Hampshire, New Jersey, New York, Rhode Island, Vermont and Virginia. Virginia rejoined on 1 July 2026. Pennsylvania is not a member.
Yes, again. Virginia took part from 2021 to 2023 and resumed participation on 1 July 2026. Its plants must cover emissions from the second half of 2026 onward, and Virginia allowances were first sold in Auction 73 in September 2026.
No. Pennsylvania was directed to join in 2019 but a court fight kept it from ever becoming an active member, and on 12 November 2025 the legislature voted to withdraw as part of the state budget. It never took part in an auction.
Auction 74 is on 2 December 2026, the last before the 1 March 2027 compliance deadline. RGGI publishes results two days after each auction, and the 2027 dates come out in the auction notices.
It is designed as a market, not a tax: the states fix the number of allowances and auctions set the price. Pennsylvania’s appeals court did treat the state’s version as a tax that needed the legislature’s approval, which is one reason Pennsylvania never joined.
Anyone can open a RGGI COATS account to hold and transfer allowances, and auctions are open to all qualified participants, not only power plants. This is not investment advice.
From 1 January 2027 the cap falls to 90.2 million allowances and keeps falling to 2037, the minimum auction price rises to $9.00, the cost containment reserve gets a second tier at $29.25, the emissions containment reserve ends, and no new offset allowances are awarded.
Sources and how we keep this page current
The auction prices and plant emissions come from the files behind the charts, rebuilt from the official publications below. The design figures (2026 prices, the 2027 to 2037 table, the states and the dates) were read from RGGI, Inc.’s pages on 2 November 2026 and are re-checked on a fixed timetable.
- RGGI, Inc., Allowance Prices and Volumes and Projected Auction Dates: every auction and the next one.
- RGGI, Inc., Auction 73 results (11 September 2026): Virginia allowances, CCR and ECR, cumulative proceeds.
- RGGI, Inc., Elements of RGGI: the 2026 cap, reserve price, CCR and ECR triggers, offsets.
- RGGI, Inc., Program Review and the 2025 Model Rule: the changes from 2027.
- RGGI, Inc., Compliance and the Sixth Control Period Compliance Fact Sheet (31 August 2026): states, control periods, deadlines.
- RGGI, Inc., RGGI States Monitoring the Market (8 May 2026): surplus allowances, Virginia’s 2026 supply.
- Potomac Economics, Secondary Market Report, Q2 2026.
- Analysis Group for the RGGI states, Customer Bill Analysis (June 2025); RGGI, Inc., The Investment of RGGI Proceeds in 2024 (June 2026), Table 1, and its press release (26 June 2026): the 2024 investments and the CO₂ they avoid. Table 1 gives 4,369,047 short tons over their lifetime; RGGI’s Proceeds Investments page shows the same figure as 4.3 million.
- Roger Caiazza, Pragmatic Environmentalist of New York, RGGI Investment Proceeds June 2026 Update (29 June 2026), Table 1: the 8.7% share (read 4 November 2026).
- RGGI, Inc., Emissions and RGGI 101 Factsheet: the 43% and 50% falls.
- US EPA, Clean Air Markets Program Data: annual CO₂ by plant (public domain).
- Pennsylvania: Inside Climate News, Pennsylvania to Leave RGGI as Part of an Overdue Budget Deal (12 November 2025); Pennsylvania Capital-Star, Pa. Supreme Court dismisses appeals to revive RGGI.
- World Bank, Carbon Pricing Dashboard (CC BY 4.0): RGGI, California and Washington prices on 1 April.
The auction prices update automatically after each auction, usually two days after it. We re-check the design figures and the state list on a fixed timetable, listed on our update schedule, and log every change on the changelog. This page explains the program for general information; it is not legal, tax or trading advice.