
Global Energy Monitor: The Trackers, the Coal Plant Pipeline, and How to Use GEM Data

Global Energy Monitor (GEM) is a US-based nonprofit that tracks energy infrastructure worldwide, plant by plant, in open databases such as the Global Coal Plant Tracker. Its July 2026 coal data counts 2,226 GW of coal power operating in 74 countries and 763 GW in development, 260 GW of it under construction. Its tracker data is free to reuse under CC BY 4.0 unless a dataset says otherwise.
Global Energy Monitor’s data turns up in IPCC and IEA reports, in bank coal policies and in news stories about new coal plants. This page explains who GEM is, lists all 25 of its trackers, and lets you look up any country in its Global Coal Plant Tracker: how much coal power runs there, how much is planned, what was built and retired each year, and who owns the most. It then checks GEM’s US figures against the US government’s, and shows how to cite and reuse the data.
1. What Global Energy Monitor is
Global Energy Monitor (GEM) is a non-profit research organisation that builds open databases of fossil fuel and clean energy projects, one plant, mine or pipeline at a time. Its About page says the work began in 2007, when a group of journalists and advocates started documenting proposals for new US coal plants. In 2008 the project, then called CoalSwarm, became affiliated with Earth Island Institute; it became an independent non-profit as Global Energy Monitor in 2017. Wikipedia names Ted Nace as its founder.
| What it is | A US non-profit research organisation (mailing address in Covina, California) |
|---|---|
| Size | 93 staff in 13 countries, by its About page |
| What it publishes | 25 open-access trackers covering more than 200 countries, interactive maps, the GEM.wiki encyclopedia of energy projects, and reports built on the trackers |
| Best-known dataset | The Global Coal Plant Tracker: every coal power unit of 30 MW or more worldwide, in July 2026 covering 14,674 units in 111 countries |
| Who uses it | Wikipedia lists the IPCC, the International Energy Agency, the World Bank and the IMF among its data users |
| Licence | Creative Commons Attribution 4.0 (CC BY 4.0) “unless otherwise noted”; GEM also offers a form to request a commercial exemption |
| Where to get it | Each tracker’s page on globalenergymonitor.org (summary tables, a map and a download form) and GEM.wiki |
Provider directory
Need help keeping this up all year?
See who does this work. Every listing names the standards it works to, and paid placements are labelled. Including Anthesis Group and KERAMIDA.
Browse 6 carbon accounting & inventory providers →Do this work? A listing is US$390 a year. Get listed →
2. All 25 GEM trackers
Each tracker is a separate database with its own release schedule and its own lower size limit. Release dates are the latest named on each tracker’s page when we read them on 1 November 2026.
| Tracker | What it covers | Latest release |
|---|---|---|
| Coal | ||
| Global Coal Plant Tracker | Coal power units of 30 MW or more: operating, proposed since 2010, retired since 2000. Updated in January and July | July 2026 |
| Global Coal Mine Tracker | Coal mines of 1 million tonnes a year or more (0.45 in China), plus mines closed since 2015 | Updated each year in the second quarter |
| Global Coal Terminals Tracker | Coal import, export and domestic terminals of 1 million tonnes a year or more | December 2024 |
| Global Coal Project Finance Tracker | Who lends to and invests in coal power projects, deal by deal | August 2026 |
| Oil and gas | ||
| Global Oil and Gas Plant Tracker | Oil- and gas-fired power units of 50 MW or more (20 MW in the EU and UK). Updated in January and July | August 2026 |
| Global Oil and Gas Extraction Tracker | Oil and gas fields producing 1 million barrels of oil equivalent a year, or holding 25 million in reserves | March 2026 |
| Global Gas Infrastructure Tracker | Gas transmission pipelines and LNG import and export terminals | Not dated on the page |
| Global Oil Infrastructure Tracker | Oil and natural gas liquids pipelines | June 2026 |
| Global Gas Finance Tracker | Finance for LNG terminals and gas power plants in development, in selected regions | July 2026 |
| Global Methane Emitters Tracker | Methane estimates for fossil fuel facilities, matched to plumes seen by satellite | December 2025 |
| Power from other sources | ||
| Global Solar Power Tracker | Utility-scale solar farms of 1 MW or more, plus distributed solar by country | February 2026 |
| Global Wind Power Tracker | Onshore and offshore wind farms of 10 MW or more | February 2026 |
| Global Hydropower Tracker | Hydropower plants of 45 MW or more | March 2026 |
| Global Nuclear Power Tracker | Nuclear reactors: status, technology, owner, construction start | August 2026 |
| Global Bioenergy Power Tracker | Bioenergy power plants of 10 MW or more | September 2026 |
| Global Geothermal Power Tracker | Geothermal power plants | March 2026 |
| Global Integrated Power Tracker | All the power trackers above in one file, across every major technology | September 2026 |
| Heavy industry | ||
| Global Iron and Steel Tracker | Iron and steel plants of 0.5 million tonnes a year or more | September 2026 |
| Global Iron Ore Mines Tracker | Iron ore mines operating, proposed, shelved, retired or mothballed since 2023 | Not dated on the page |
| Global Cement and Concrete Tracker | Cement and clinker plants: capacity, owner, status, production method | July 2026 |
| Global Chemicals Inventory | Production of eight building-block chemicals, including ethylene, ammonia and methanol | November 2025 |
| Owners, finance and regions | ||
| Global Energy Ownership Tracker | Who ultimately owns the assets in the other trackers, through every layer of companies (stakes of 5% or more) | October 2026 |
| Private Equity Tracker | Private equity ownership of energy assets and fossil fuel companies | March 2026 |
| Latin America Energy Tracker | Energy infrastructure across Latin America and the Caribbean | March 2026 |
| Global Energy Transition Tracker | Profiles of places with the potential to shift their energy systems | Not dated on the page |
3. Coal power in a country
Pick a country to see its coal fleet in the Global Coal Plant Tracker’s July 2026 release: capacity running now, capacity at each stage of development, what was built and retired each year since 2000, and the retirements its owners or government have announced. Capacity is the units’ rated output in megawatts (MW) or gigawatts (GW, 1,000 MW).
Coal power in a country
184 GW operating
United States: 375 coal units of 30 MW or more at 188 power stations, emitting about 794 million tonnes of CO₂ a year by GEM’s estimate.
In development: 4.3 GW, none of it under construction.
| Announced | 3.0 GW |
|---|---|
| Pre-permit | 1.3 GW |
| Permitted | 0 MW |
| Under construction | 0 MW |
| Shelved | 0 MW |
| Mothballed | 2.4 GW |
| Cancelled since 2010 | 28.2 GW |
| Retired since 2000 | 173 GW |
Owners or governments have announced the retirement of 97.6 GW of today’s operating capacity by 2040.
newly operating retired, by year
4. The world’s coal pipeline
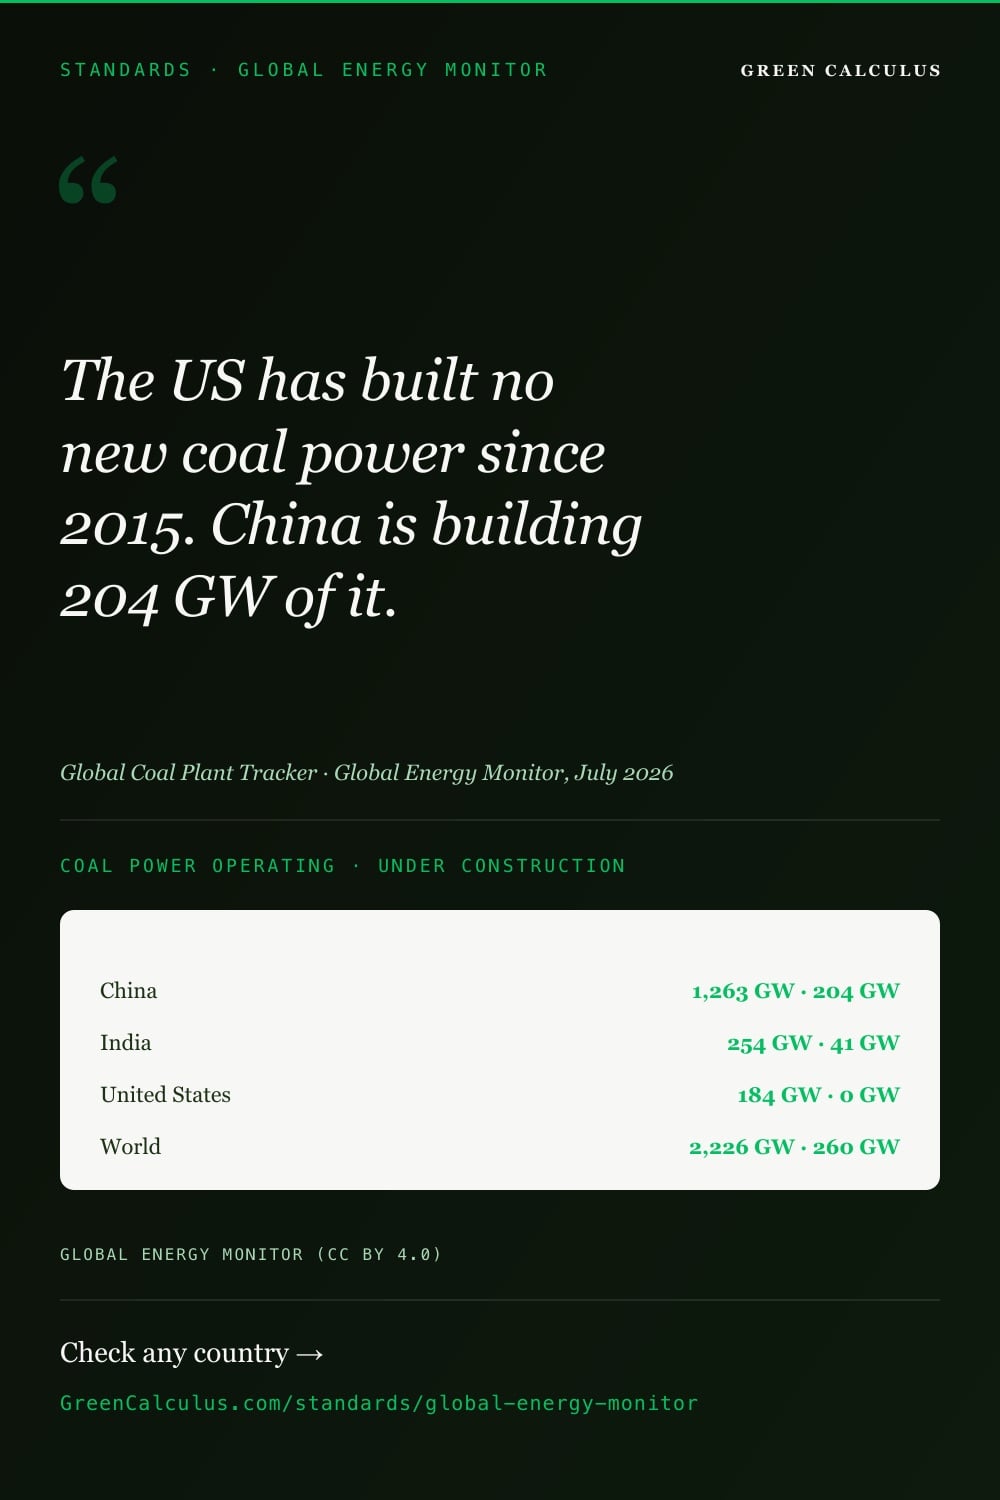
In the July 2026 release, 2,226 GW of coal power is operating in 74 countries, across 6,591 units. GEM estimates those units emit about 10.5 billion tonnes of CO₂ a year. Another 763 GW is in development: 260 GW under construction and 503 GW announced, seeking permits or permitted. China has 78% of the capacity under construction.
Most proposals never get built. Since 2010, 1,817 GW of proposed coal power has been cancelled, more than twice the capacity in development today, and 106 GW is shelved. 537 GW has retired since 2000. The chart shows how the yearly additions compare with retirements.
The 20 countries with the most coal power are below; open the box under the table for the rest.
| Country | Operating | Units | In development | Under construction | Retired since 2000 |
|---|---|---|---|---|---|
| China | 1,263 GW | 3,335 | 535 GW | 204 GW | 138 GW |
| India | 254 GW | 862 | 138 GW | 40.5 GW | 17.2 GW |
| United States | 184 GW | 375 | 4.3 GW | 0 MW | 173 GW |
| Indonesia | 60.6 GW | 292 | 18.4 GW | 5.3 GW | 55 MW |
| Japan | 52.9 GW | 143 | 500 MW | 0 MW | 4.1 GW |
| South Africa | 45.0 GW | 91 | 1.5 GW | 0 MW | 1.2 GW |
| South Korea | 41.7 GW | 81 | 0 MW | 0 MW | 4.0 GW |
| Russia | 37.3 GW | 278 | 7.3 GW | 2.0 GW | 10.8 GW |
| Vietnam | 28.4 GW | 75 | 8.5 GW | 2.7 GW | 105 MW |
| Germany | 28.2 GW | 58 | 0 MW | 0 MW | 33.7 GW |
| Poland | 27.3 GW | 129 | 100 MW | 100 MW | 9.1 GW |
| Australia | 22.6 GW | 52 | 945 MW | 0 MW | 8.9 GW |
| Türkiye | 20.5 GW | 79 | 1.7 GW | 0 MW | 0 MW |
| Taiwan | 16.2 GW | 50 | 0 MW | 0 MW | 3.6 GW |
| Kazakhstan | 13.3 GW | 97 | 7.1 GW | 140 MW | 640 MW |
| Malaysia | 13.3 GW | 25 | 0 MW | 0 MW | 0 MW |
| Philippines | 12.6 GW | 65 | 3.4 GW | 970 MW | 197 MW |
| Pakistan | 8.3 GW | 22 | 2.0 GW | 32 MW | 0 MW |
| Bangladesh | 7.2 GW | 13 | 5.2 GW | 0 MW | 0 MW |
| Czech Republic | 6.9 GW | 66 | 0 MW | 0 MW | 3.5 GW |
The other 60 countries with coal power operating or planned
| Country | Operating | Units | In development | Under construction | Retired since 2000 |
|---|---|---|---|---|---|
| Thailand | 5.8 GW | 19 | 0 MW | 0 MW | 975 MW |
| Mexico | 5.4 GW | 15 | 0 MW | 0 MW | 0 MW |
| Serbia | 4.8 GW | 18 | 0 MW | 0 MW | 0 MW |
| Hong Kong | 4.1 GW | 8 | 0 MW | 0 MW | 2.5 GW |
| Morocco | 4.1 GW | 11 | 0 MW | 0 MW | 165 MW |
| Netherlands | 3.5 GW | 4 | 0 MW | 0 MW | 4.3 GW |
| Ukraine | 3.5 GW | 17 | 0 MW | 0 MW | 4.5 GW |
| Bulgaria | 3.4 GW | 24 | 0 MW | 0 MW | 1.8 GW |
| North Korea | 3.3 GW | 45 | 0 MW | 0 MW | 0 MW |
| Canada | 3.2 GW | 15 | 0 MW | 0 MW | 16.3 GW |
| Chile | 3.1 GW | 14 | 0 MW | 0 MW | 2.4 GW |
| Brazil | 3.0 GW | 13 | 0 MW | 0 MW | 698 MW |
| Israel | 2.7 GW | 6 | 0 MW | 0 MW | 2.3 GW |
| Uzbekistan | 2.4 GW | 10 | 1.6 GW | 0 MW | 348 MW |
| Romania | 2.2 GW | 10 | 0 MW | 0 MW | 5.2 GW |
| Bosnia and Herzegovina | 2.0 GW | 9 | 1.1 GW | 0 MW | 0 MW |
| France | 1.9 GW | 3 | 0 MW | 0 MW | 6.6 GW |
| Laos | 1.9 GW | 3 | 3.4 GW | 300 MW | 0 MW |
| Zimbabwe | 1.8 GW | 11 | 5.6 GW | 715 MW | 0 MW |
| Colombia | 1.6 GW | 14 | 0 MW | 0 MW | 0 MW |
| Cambodia | 1.5 GW | 10 | 265 MW | 265 MW | 0 MW |
| Mongolia | 1.3 GW | 14 | 4.5 GW | 400 MW | 0 MW |
| Kosovo | 1.3 GW | 5 | 0 MW | 0 MW | 190 MW |
| Italy | 1.2 GW | 4 | 0 MW | 0 MW | 5.8 GW |
| Dominican Republic | 1.1 GW | 5 | 0 MW | 0 MW | 0 MW |
| Sri Lanka | 900 MW | 3 | 0 MW | 0 MW | 0 MW |
| Hungary | 884 MW | 5 | 0 MW | 0 MW | 695 MW |
| North Macedonia | 824 MW | 4 | 0 MW | 0 MW | 0 MW |
| Kyrgyzstan | 813 MW | 9 | 2.3 GW | 0 MW | 150 MW |
| New Zealand | 750 MW | 3 | 0 MW | 0 MW | 250 MW |
| Botswana | 732 MW | 8 | 1.3 GW | 700 MW | 0 MW |
| Slovenia | 724 MW | 4 | 0 MW | 0 MW | 535 MW |
| Greece | 660 MW | 1 | 0 MW | 0 MW | 5.3 GW |
| Finland | 653 MW | 2 | 0 MW | 0 MW | 2.9 GW |
| Argentina | 525 MW | 3 | 0 MW | 0 MW | 0 MW |
| Puerto Rico | 510 MW | 2 | 0 MW | 0 MW | 0 MW |
| Denmark | 411 MW | 1 | 0 MW | 0 MW | 4.6 GW |
| Tajikistan | 400 MW | 4 | 0 MW | 0 MW | 0 MW |
| New Caledonia | 370 MW | 4 | 0 MW | 0 MW | 0 MW |
| Nigeria | 345 MW | 9 | 1.6 GW | 0 MW | 0 MW |
| Zambia | 330 MW | 3 | 3.5 GW | 1.4 GW | 0 MW |
| Panama | 306 MW | 2 | 0 MW | 0 MW | 120 MW |
| Spain | 260 MW | 2 | 0 MW | 0 MW | 13.2 GW |
| Montenegro | 225 MW | 1 | 0 MW | 0 MW | 0 MW |
| Brunei | 220 MW | 4 | 0 MW | 0 MW | 0 MW |
| Croatia | 217 MW | 1 | 0 MW | 0 MW | 0 MW |
| Slovakia | 208 MW | 1 | 0 MW | 0 MW | 1.3 GW |
| Mauritius | 195 MW | 5 | 0 MW | 0 MW | 0 MW |
| Myanmar | 180 MW | 4 | 0 MW | 0 MW | 0 MW |
| Senegal | 155 MW | 2 | 0 MW | 0 MW | 0 MW |
| Guatemala | 139 MW | 1 | 0 MW | 0 MW | 83 MW |
| Madagascar | 120 MW | 3 | 0 MW | 0 MW | 0 MW |
| Namibia | 120 MW | 4 | 0 MW | 0 MW | 0 MW |
| Niger | 30 MW | 1 | 600 MW | 0 MW | 0 MW |
| Afghanistan | 0 MW | 0 | 515 MW | 0 MW | 0 MW |
| Eswatini | 0 MW | 0 | 300 MW | 0 MW | 0 MW |
| Iran | 0 MW | 0 | 650 MW | 650 MW | 0 MW |
| Malawi | 0 MW | 0 | 550 MW | 0 MW | 0 MW |
| Mozambique | 0 MW | 0 | 300 MW | 0 MW | 0 MW |
| Tanzania | 0 MW | 0 | 1.2 GW | 0 MW | 0 MW |
“In development” adds up announced, pre-permit, permitted and under-construction capacity. Source: Global Coal Plant Tracker, Global Energy Monitor, July 2026 release (CC BY 4.0).
5. What GEM’s statuses mean
Every unit in the Coal Plant Tracker has one status. The definitions, from GEM’s tracker page, decide what counts as “planned” or “in development” in news stories, so they are worth knowing before you quote a figure.
| Status | What it means |
|---|---|
| Announced | In a company or government plan, but no concrete steps taken yet |
| Pre-permit | Steps under way towards approvals, land or water rights or finance (in India, a Terms of Reference letter; in China, a feasibility study) |
| Permitted | All environmental approvals in hand, construction not started |
| Construction | Concrete pouring or foundation work has started. A foundation-stone ceremony or site clearing does not count |
| Shelved | No sign of progress for at least two years |
| Cancelled | Cancellation announced, or no progress for four years |
| Operating | Commissioned or in commercial operation |
| Mothballed | Not running, but not retired |
| Retired | Decommissioned or converted to another fuel |
“In development” on this page, as in GEM’s own summaries, adds up the first four: announced, pre-permit, permitted and under construction.
6. How GEM builds its data
- Unit by unit, from documents. Researchers record each unit from company filings, government permits, news and earlier databases. The Coal Plant Tracker lists sources including the Global Energy Observatory, CARMA, BankTrack, a 2012 World Resources Institute survey and S&P Global’s World Electric Power Plants database.
- A wiki page for every plant. Each plant has a page on GEM.wiki with footnotes to the documents behind its status, so you can check a single entry yourself.
- A size floor. The coal tracker only includes units of 30 MW or more, so small industrial boilers and some captive plants are not in it.
- CO₂ is estimated, not measured. GEM works out each unit’s annual CO₂ from its capacity, the emission factor of its coal type, its heat rate and a capacity factor. Treat the CO₂ figures as estimates for comparison, not as a plant’s reported emissions.
- Twice-yearly releases. The Coal Plant Tracker is updated in January and July. Statuses can change between releases, so cite the release you used.
7. GEM vs the US government’s count
For the United States we can test GEM against an official count. The US Energy Information Administration (EIA) counts utility-scale power plants, those of 1 MW or more. The two agree closely on capacity and differ on the number of plants, for reasons that show up in the definitions.
| Global Energy Monitor | EIA | |
|---|---|---|
| As of | July 2026 release | March 2026 (EIA FAQ, from monthly generator data) |
| Plants | 188 power stations | 219 power plants |
| Units | 375 units of 30 MW or more | 462 generators |
| Operating capacity | 184 GW | About 189 GW |
Three things explain the gap in plant and unit counts: GEM leaves out units under 30 MW, which EIA counts; the two counts date from different months, so a unit retired in between appears in one and not the other; and the two group generators into plants in their own ways. GEM shows no new US coal capacity since 2015, and 98 GW of today’s US fleet has an announced retirement date by 2040.
8. Who owns the most coal power
GEM records the owners of each unit and traces them up to the parent company. These two tables use GEM’s ownership summary: the parents with the most operating coal power, and those with the most in development. Chinese power groups lead both lists; India’s Adani Power and NTPC are second and third for capacity in development.
| # | Parent company | Headquarters | Operating | In development |
|---|---|---|---|---|
| 1 | Huaneng Power International Inc | China | 75.8 GW | 35.1 GW |
| 2 | NTPC Ltd | India | 62.9 GW | 23.3 GW |
| 3 | China Energy Investment Corp | China | 61.3 GW | 17.5 GW |
| 4 | China Shenhua Energy Co Ltd | China | 56.5 GW | 11.8 GW |
| 5 | Eskom Holdings SOC Ltd | South Africa | 44.5 GW | 0 MW |
| 6 | China Resources Power Holdings Co Ltd | Hong Kong | 42.9 GW | 8.4 GW |
| 7 | GD POWER Development Co Ltd | China | 41.7 GW | 9.9 GW |
| 8 | China Huadian Corp Ltd | China | 40.1 GW | 10.7 GW |
| 9 | Datang International Power Generation Co Ltd | China | 39.4 GW | 16.6 GW |
| 10 | Owner not identified by GEM | – | 39.3 GW | 9.2 GW |
| 11 | China Datang Corp Ltd | China | 39.0 GW | 10.6 GW |
| 12 | Huadian Power International Co Ltd | China | 38.0 GW | 18.9 GW |
| 13 | Korea Electric Power Corp | South Korea | 35.7 GW | 17 MW |
| 14 | State Power Investment Corp Ltd | China | 35.5 GW | 12.3 GW |
| 15 | Zhejiang Zheneng Electric Power Co Ltd | China | 33.4 GW | 6.9 GW |
| # | Parent company | Headquarters | In development | Operating |
|---|---|---|---|---|
| 1 | Huaneng Power International Inc | China | 35.1 GW | 75.8 GW |
| 2 | Adani Power Ltd | India | 25.8 GW | 17.9 GW |
| 3 | NTPC Ltd | India | 23.3 GW | 62.9 GW |
| 4 | Huadian Power International Co Ltd | China | 18.9 GW | 38.0 GW |
| 5 | China Energy Investment Corp | China | 17.5 GW | 61.3 GW |
| 6 | Datang International Power Generation Co Ltd | China | 16.6 GW | 39.4 GW |
| 7 | China National Coal Group | China | 14.6 GW | 10.8 GW |
| 8 | State Power Investment Corp Ltd | China | 12.3 GW | 35.5 GW |
| 9 | China Shenhua Energy Co Ltd | China | 11.8 GW | 56.5 GW |
| 10 | China Huadian Corp Ltd | China | 10.7 GW | 40.1 GW |
| 11 | China Datang Corp Ltd | China | 10.6 GW | 39.0 GW |
| 12 | GD POWER Development Co Ltd | China | 9.9 GW | 41.7 GW |
| 13 | SDIC Power Holdings Co Ltd | China | 9.6 GW | 10.4 GW |
| 14 | Owner not identified by GEM | – | 9.2 GW | 39.3 GW |
| 15 | China Huaneng Group Co Ltd | China | 9.1 GW | 26.0 GW |
GEM assigns each unit’s capacity to its owners by their share, and names the parent company at the top of each chain. Source: Global Coal Plant Tracker ownership summary, Global Energy Monitor, July 2026 release (CC BY 4.0).
9. Using GEM data: licence, citation, downloads
GEM’s tracker download pages say: “All Global Energy Monitor tracker data are freely available under a Creative Commons Attribution 4.0 International Public License unless otherwise noted.” CC BY 4.0 lets you share and adapt the data, for any purpose, if you credit GEM, link the licence and say what you changed. Two cautions:
- “Unless otherwise noted” is real. Some data GEM shows comes from partners under other terms; methane plume data from Carbon Mapper, for example, is CC BY-NC-SA, which rules out commercial use. GEM’s download pages also offer a form to request a commercial exemption. Read the licence note in the file you download, and ask GEM if your use is commercial and you are unsure.
- Attribution comes with the file. GEM says “necessary attribution elements are included in our data download files”. Use them, and name the release.
We checked our own use with GEM. On 1 November 2026 we asked whether showing the coal tracker’s summary figures, and a CSV of them, on this site, which carries advertising, needed the commercial exemption or was covered by CC BY 4.0. GEM replied the same day that it was no problem. That answer is about our use only; if yours is commercial, ask GEM about it.
GEM’s suggested citation for the coal tracker is:
- Full unit-level files: fill in the short request form on each tracker’s download page.
- Summary tables: linked from each tracker page, no form needed. Our CSVs below are built from them.
- One plant: search GEM.wiki for the plant’s page and its sources. Note the wiki’s own licence differs: its pages are CC BY-NC-SA (no commercial use) unless noted.
Typical uses: building or checking a coal exclusion list, screening the companies in a loan or bond portfolio before working out financed emissions under PCAF (see the PCAF project finance calculator), and country context in climate risk work. GEM’s CO₂ estimates are not a substitute for a company’s own reported emissions.
10. GEM vs Climate TRACE
The two are often confused, and they work together. GEM records what exists and what is planned: each plant’s capacity, status and owners, from documents. Climate TRACE estimates what each site emits, month by month, using satellite data and models. Climate TRACE uses GEM’s company identifiers in its ownership data (India’s NTPC is E100000001926 in both), so the two can be joined.
| Global Energy Monitor | Climate TRACE | |
|---|---|---|
| Main question | What is built, being built or planned, and who owns it? | How much does each site and country emit? |
| Covers plans | Yes: proposals from announcement to cancellation | No: operating sources only |
| Emissions | Estimated per unit from capacity and typical running | Estimated per site and month from activity data and models |
| Updated | Per tracker; coal twice a year | Monthly |
| Licence | CC BY 4.0 unless noted | CC BY 4.0 |
For electricity generation and power-sector emissions by country and fuel, see Ember’s yearly electricity data.
11. How we built this page
- Coal figures come from the public summary tables of the Global Coal Plant Tracker, July 2026 release, linked from GEM’s tracker page: capacity, units and power stations by status and country, annual CO₂, capacity newly operating and retired by year, announced retirements by year, and the ownership summary. When GEM publishes a new release, the data on this page is rebuilt.
- Checks: the country rows add up to GEM’s world totals for every status; parent companies’ operating capacity adds up to the world total, so no capacity is counted twice.
- “In development” is announced + pre-permit + permitted + under construction. “Built” in the chart is capacity GEM records as newly operating in that year; the last bar is the first half of 2026.
- Trackers table: each tracker’s own page, read 1 November 2026. US cross-check: EIA’s FAQ “How many power plants are in the United States?”.
- What we did not do: we did not change any GEM figure or check single plants against company reports.
Frequently asked questions
A US non-profit that builds open databases of energy infrastructure worldwide, plant by plant: coal, oil and gas, renewables, nuclear, steel, cement and more, with their owners. It began in 2007 documenting US coal plant proposals and has 25 trackers today.
Yes. GEM tracker data is licensed CC BY 4.0 unless otherwise noted, so you can reuse and adapt it with credit to GEM. Some partner data, such as methane plume data, carries other terms, and GEM offers a commercial exemption form, so check the licence note in your download.
GEM’s Global Coal Plant Tracker counts 6,591 operating coal power units of 30 MW or more, with 2,226 GW of capacity in 74 countries (July 2026 release). A plant often has several units.
GEM counts 188 US coal power stations with 375 units of 30 MW or more (184 GW). The EIA, which includes smaller generators, counted 219 coal plants with 462 generators and about 189 GW in March 2026.
GEM counts 3,335 operating coal units of 30 MW or more in China, 1,263 GW, with another 204 GW under construction (July 2026 release).
Twice a year, in January and July. Other GEM trackers have their own schedules, mostly once a year.
GEM’s online encyclopedia of energy projects. Each plant in the trackers has a page there with footnotes to the documents behind its status and ownership.
GEM records which plants exist or are planned, their capacity, status and owners, from documents. Climate TRACE estimates how much each site emits each month from satellite data and models. Climate TRACE uses GEM’s company identifiers, so the two can be joined.
Sources and downloads
- Global Energy Monitor, About and Global Coal Plant Tracker (methodology, statuses and summary tables, July 2026 release), read 1 November 2026; the other 24 tracker pages linked in section 2.
- Global Energy Monitor, Global Integrated Power Tracker download page (licence wording and commercial exemption form), Global Methane Emitters Tracker download page (Carbon Mapper plume data, CC BY-NC-SA) and Global Solar Power Tracker (attribution wording).
- GEM.wiki (content licence CC BY-NC-SA unless noted).
- US Energy Information Administration, How many power plants are in the United States? (data as of March 2026).
- Wikipedia, Global Energy Monitor (founder, data users).
Download the coal figures on this page as CSV, free to reuse under CC BY 4.0 with credit to Global Energy Monitor (cite: Global Coal Plant Tracker, Global Energy Monitor, July 2026 release). For unit-level data, use GEM’s download form.
- gem-coal-countries.csv: coal capacity by status, operating units and power stations, and annual CO₂, by country (Global Coal Plant Tracker, Global Energy Monitor, July 2026 release)
- gem-coal-new-retired-by-year.csv: capacity newly operating and retired each year since 2000, by country
- gem-coal-planned-retirements.csv: announced retirement capacity by year, by country
What changed in this revision
Version 1.0 (1 November 2026): First publication.