
Product Carbon Footprint Allocation

The complete reference for allocating emissions across co-products, shared processes, and recycling loops in a product carbon footprint (PCF). Covers the ISO 14044 allocation hierarchy, physical and economic allocation, system expansion and substitution, the recycling allocation fork, biogenic carbon treatment, and the audit trail a verifier expects. Aligned to ISO 14067:2018, the GHG Protocol Product Standard, the WBCSD Pathfinder Framework, EU PEF v3.1, and the ecoinvent system models.
Allocation is the single most consequential — and most contested — decision in a product carbon footprint. Two analysts modelling the same factory, with identical activity data, can publish PCFs that differ by a factor of two or more solely because they split shared emissions differently. This page sets out the decision rule every framework inherits, the methods it permits, and the documentation that makes an allocation defensible at verification.
ISO 14044 mandates a strict order: first avoid allocation by subdividing the process or expanding the system; then allocate on a physical relationship such as mass or energy; and only where no physical basis holds, fall back to economic value.
Why Allocation Exists: The Multi-Output Problem
A life-cycle inventory measures the emissions of a process. A product carbon footprint needs the emissions of a product. When a single process produces more than one valuable output, those two things stop being the same, and the analyst has to decide how much of the shared emissions each output carries. That decision is allocation.
The problem appears in three recurring shapes across nearly every supply chain:
Co-production
One process yields several saleable products at once. A crude-oil refinery emits a single stream of CO₂e while producing petrol, diesel, jet fuel, and bitumen. A dairy produces milk, cream, and whey from one herd. A sawmill yields planks, chips, and sawdust. The emissions are joint; the products are separate.
Shared infrastructure
A facility makes multiple distinct products on shared utilities — one boiler, one grid connection, one wastewater plant serving several lines. The site-level energy and process emissions must be split across products that may have nothing physically in common.
Recycling and reuse
A material crosses system boundaries. Steel scrap from an end-of-life car becomes feedstock for new steel. Who carries the emissions of the original production — the first product life, the second, or a split? This is allocation across time and ownership, and it is the hardest case of all.
In each case the total inventory is known and fixed. Allocation does not change the planet’s emissions; it changes how those emissions are attributed to the functional units that competitors, regulators, and customers compare. Because the same total can be split many defensible ways, allocation is where two honest analysts most often diverge — and where greenwashing most often hides. The discipline that governs it is the ISO 14040/14044 life-cycle assessment standards, inherited in turn by every product-level carbon framework.
Provider directory
Now it has to hold up all year.
See who does this work. Every listing names the standards it works to, and paid placements are labelled. Including KERAMIDA and Pangolin Associates.
Browse 6 carbon accounting & inventory providers →Do this work? A listing is US$390 a year. Get listed →
The ISO 14044 Allocation Hierarchy
ISO 14044 §4.3.4 does not present allocation methods as a menu. It presents them as a strict preference order. Each tier must be shown impossible before the next is permitted. This sequencing is the rule that every downstream framework — ISO 14067, the GHG Protocol Product Standard, PEF, and Pathfinder — adopts wholesale.
Subdivide the process
Break the multi-output process into sub-processes, each producing a single output, and collect data at that finer resolution. If the boiler steam feeding product A can be metered separately from the steam feeding product B, no allocation is needed — you simply measure each. Always the preferred route, and the one most often skipped because it costs measurement effort.
Expand the system boundary
Where subdivision is impossible, enlarge the system to include the additional functions of the co-products, then subtract the emissions that the co-product displaces elsewhere (system expansion / substitution). Equal first-rank with subdivision under ISO 14044 — but only valid in specific modelling contexts (see § system expansion).
Allocate on an underlying physical relationship
If allocation cannot be avoided, partition the shared emissions in proportion to a physical property that reflects how the outputs drive the burden — most commonly mass, but also energy content, volume, carbon content, or molar quantity. The chosen property must have a defensible causal link to the emissions.
Allocate on economic value
Where no physical relationship is defensible — typically when co-products are physically incommensurable (a tonne of leather hide vs a tonne of beef) — partition emissions by each output’s share of total revenue. The explicit fallback of last resort, because it imports market volatility into a physical accounting result.
The most common verification finding on a PCF is not a wrong number — it is an undocumented jump down the hierarchy. An analyst who allocates by revenue must demonstrate, in writing, that subdivision was infeasible and system expansion was inapplicable and no physical relationship held. Skipping that demonstration is treated as a methodological defect even if the resulting figure is plausible. Document the rejection of each higher tier explicitly — the rejection log is as important as the chosen method.
Framework Crosswalk: How Each Standard Treats Allocation
Every product-carbon framework inherits the ISO 14044 hierarchy, but they differ in emphasis, in the recycling formula they prescribe, and in whether they permit consequential modelling. The matrix below is the practical reference for which rule applies when your PCF must satisfy more than one standard at once — common for a European manufacturer reporting under Scope 3 Category 1 while also producing a PEF-compliant declaration.
| Framework | Allocation basis | Recycling rule | System expansion allowed? | Primary use |
|---|---|---|---|---|
| ISO 14040/14044 | The source hierarchy: avoid → physical → economic | Defines the problem; leaves the closed/open-loop choice to the practitioner and PCR | Yes — co-equal first rank with subdivision | The governing LCA standard all others inherit |
| ISO 14067 | Inherits ISO 14044 hierarchy verbatim; adds carbon-specific rules for biogenic and land-use change | Follows ISO 14044; biogenic carbon tracked through recycling | Yes, where consistent with the goal & scope | The dedicated product carbon footprint standard |
| GHG Protocol Product | Avoid first; prefers process subdivision; physical before economic | Recommends documenting both recycled-content and end-of-life methods where material | Permitted but flagged as introducing uncertainty | Corporate value-chain product reporting |
| EU PEF v3.1 | Prescriptive: a fixed decision hierarchy plus mandatory category rules (PEFCRs) | Mandatory Circular Footprint Formula (CFF) — a single fixed equation | Constrained — CFF embeds a regulated substitution term | EU single-market environmental claims |
| WBCSD Pathfinder | ISO-aligned; emphasises primary supplier data and exchange of allocated cradle-to-gate PCFs | Cut-off (recycled content) as the default for inter-company PCF exchange | Discouraged for exchanged PCFs — attributional consistency prioritised | Supplier-to-customer PCF data exchange (PACT) |
| ecoinvent | Offers parallel system models: cut-off, allocation at point of substitution (APOS), and consequential | Cut-off model assigns recycling burden to the user of recycled material | Yes — the consequential system model is built on substitution | Background LCI database underpinning most PCFs |
When a PCF must satisfy two frameworks with different recycling rules, run the inventory once and apply each recycling formula as a separate, clearly-labelled result rather than seeking a single number that “passes” both. The Pathfinder cut-off result and the PEF Circular Footprint Formula result are different quantities by construction — presenting them side by side is correct; blending them is not.
Physical Allocation in Depth
Physical allocation partitions shared emissions in proportion to a measurable physical property of the outputs. It sits at rank 2 of the hierarchy and is the workhorse method for genuinely joint production where subdivision is impossible. The general form is a simple ratio.
Mass allocation
The most widely used physical basis: each co-product carries emissions in proportion to its mass share. Mass allocation is defensible when the outputs are broadly similar materials and mass tracks the resource draw on the process — for example, splitting a meat-processing line’s energy across cuts of similar composition. It becomes indefensible when a high-mass, low-value output (whey, bran, slag) would absorb the majority of the footprint despite being a near-waste stream. That mismatch is precisely what pushes analysts toward economic allocation.
Energy-content allocation
For fuels and energy carriers, mass is a poor proxy because a kilogram of one fuel carries very different usable energy from a kilogram of another. Energy-content allocation (by lower heating value) is the standard physical basis for refinery co-products and for combined heat-and-power outputs, where the shared burden is split between heat and electricity by their delivered energy. Energy-content allocation underpins much of the embodied-energy data in resources such as the ICE embodied-carbon database.
Other physical relationships
Where neither mass nor energy reflects causation, ISO 14044 permits any physical relationship with a defensible causal link: carbon content (for petrochemical fractions), molar quantity (for chemical reactions), reactive surface area, or stoichiometric demand. The test is always the same — does this property actually drive the emissions, or is it merely convenient to measure?
When physical allocation fails
Physical allocation breaks down when co-products share no meaningful physical commensurability. The textbook case is cattle: a single animal yields beef, hide, tallow, and offal. There is no physical property — not mass, not energy, not carbon — whose ratio across those outputs reflects how each “caused” the herd’s methane and feed emissions. When no physical basis survives scrutiny, the hierarchy permits the descent to economic allocation, but only with that failure documented.
Economic Allocation in Depth
Economic allocation partitions shared emissions by each co-product’s share of total revenue at the point of separation (the “split-off point”). It is the explicit last resort of the hierarchy — reached only when physical allocation has been shown to fail — because it makes a physical accounting result depend on market prices that the analyst does not control.
The price-volatility problem
Because the allocation factor depends on price, a co-product’s footprint can move without any change in the physical system. A surge in hide prices shifts emissions from beef onto leather even though the herd, the feed, and the methane are identical. This is the central audit weakness of economic allocation: the PCF becomes a function of the commodity market on the day prices were sampled. The mitigations are procedural — use a multi-year average price rather than a spot price, document the price source and reference period, and run a sensitivity analysis showing how the result moves across a defensible price range (see § governance).
Co-product versus waste — the threshold that changes everything
Economic allocation only applies to outputs that are co-products. An output with zero or negative economic value is a waste, and waste carries no allocated upstream burden — it inherits only its own treatment emissions. The classification therefore has enormous leverage: reclassifying a low-value stream from “co-product” to “waste” removes it from the denominator and concentrates the entire footprint on the remaining products. ISO 14044 treats the determination as a factual question about whether the output has economic value and a market, not a discretionary lever. Mislabelling a saleable by-product as waste to lighten the main product’s footprint is a recognised greenwashing pattern and a verification red flag.
Economic allocation is widespread in practice — not because it is preferred, but because it is easy and always computable. A PCF that opens with revenue-share allocation and no record of testing subdivision, system expansion, or a physical basis has inverted the hierarchy. Verifiers read that pattern as a methodology shortcut. If economic allocation is genuinely the right answer, the defensibility comes entirely from the documented rejection of the three higher tiers.
System Expansion and Substitution
System expansion sits at the top of the hierarchy alongside subdivision, yet it is the most misunderstood method because it can produce results that look impossible — including negative footprints. Rather than splitting shared emissions, system expansion enlarges the boundary to capture every function the joint process delivers, then subtracts the emissions that a co-product avoids by displacing conventional production elsewhere.
The substitution credit, illustrated
An anaerobic digester treating food waste produces biogas (the main function) and digestate that displaces synthetic fertiliser. Under system expansion, the digestate earns a credit equal to the emissions of the synthetic fertiliser it replaces — that credit is subtracted from the biogas footprint. Where the credit is large relative to the process emissions, the main product’s footprint can fall below zero. That is mathematically correct within the method and genuinely misleading outside it, which is why the result must always be labelled as substitution-based.
Why substitution is contentious
The substitution credit depends on a counterfactual — what the co-product displaces and how much of it. Both are assumptions, not measurements. If the digestate displaces a low-carbon fertiliser rather than a high-carbon one, the credit shrinks dramatically. The credit’s size is therefore an analyst choice dressed as a physical fact, and small changes in the assumed displaced product swing the headline number. This sensitivity is why Pathfinder discourages system expansion for exchanged supplier PCFs: a credit one company books as its own becomes uncontrollable noise in a customer’s aggregated value-chain total.
Attributional versus consequential — the boundary that decides whether substitution is even allowed
The deepest distinction in allocation is not a method but a modelling mode:
- Attributional LCA asks “what share of existing, observed emissions belongs to this product?” It partitions a fixed pie. Subdivision and physical/economic allocation are its native tools; substitution sits uneasily within it.
- Consequential LCA asks “what emissions change in the world if one more unit of this product is made?” It models marginal effects and displaced production. System expansion and substitution are its native tools.
Most corporate PCF reporting — Scope 3 Category 1, Pathfinder exchange, EPD declarations — is attributional, which is why those frameworks lean on partitioning rather than substitution. A negative PCF arriving inside an attributional reporting boundary is almost always a sign that a consequential method (substitution) has leaked into an attributional report. Keeping the two modes from contaminating each other is one of the highest-value disciplines in PCF work. The dedicated treatment lives on the material substitution methodology page.
The Recycling Allocation Problem
Recycling is allocation across product lifecycles, and it has no single “correct” answer — only a set of named conventions, each internally consistent and each producing a different number. The question is: when material flows from a first product life into a second, who carries the emissions of the original virgin production, and who carries the credit for avoiding new virgin production at end of life? Three conventions dominate.
Cut-off (recycled content)
Pathfinder & ecoinvent default
The simplest convention. A product is charged only for the material it actually contains: recycled input enters burden-free (its production was charged to the first life), and material the product sends to recycling earns no end-of-life credit. Each life “owns” only what it consumes.
Clean, non-double-counting, and the basis for inter-company PCF exchange — but it offers no incentive to design for recyclability, since downstream recycling is invisible to the producer.
End-of-life / avoided burden
Common in EPDs & building LCA
The mirror image. A product is charged the full virgin burden of its input, but earns a credit for the recyclable material it sends downstream, equal to the virgin production it avoids. Rewards designing for end-of-life recovery.
Risks double-counting if the next life also claims recycled-content benefit — two products both booking the same loop. Requires market-wide coordination to stay coherent.
Circular Footprint Formula
Mandatory under EU PEF
A single fixed equation that splits the burden and credit of each recycling loop between the two lives using an allocation factor A (a regulated 0–1 sharing parameter) plus quality-ratio and market terms. Designed to end the cut-off-vs-EoL dispute by legislating one split.
Reproducible and dispute-proof within PEF, but parameter-heavy and EU-specific. A CFF result is not comparable to a cut-off result.
In the Master Brain, the cut-off recycled-content convention occupies a fixed position in the allocation-hierarchy ranking — 7 in the special-case allocation ordering — which is why it serves as the default for Pathfinder-style exchanged PCFs where reproducibility outranks recyclability incentives.
The single most damaging recycling error is silence — publishing a PCF that uses cut-off without saying so, then comparing it against a competitor’s end-of-life-credited figure. The numbers are incommensurable, but they look like the same metric. Always declare the recycling convention explicitly, alongside the framework that mandates it, in the methodology statement. For a material with high recycled content and high recyclability — steel, aluminium, glass — the convention choice can move the cradle-to-gate footprint by 30–60%.
Biogenic Carbon and Allocation
Biogenic carbon — carbon that a plant absorbed from the atmosphere and that is later released — interacts with allocation in ways that fossil carbon does not, because the uptake and release happen in different parts of the lifecycle and may be allocated to different co-products. ISO 14067 adds carbon-specific rules on top of the ISO 14044 hierarchy precisely to keep this coherent.
The −1 / +1 convention
The default treatment records biogenic CO₂ uptake as a negative flow (−1) when biomass grows and the release as a positive flow (+1) when it combusts or decomposes — netting to zero over the full lifecycle, with a default biogenic-CO₂ GWP of 0. The uptake itself follows the stoichiometric ratio of 3.667 kg CO₂ per kg of biogenic carbon. Allocation enters when only part of the biomass becomes the product: if a sawmill allocates logs across planks and chips, the sequestered biogenic carbon must be split on the same basis as the process emissions, or the carbon balance breaks. A frequent error is allocating emissions economically while allocating the biogenic uptake by mass — the two must use one consistent factor.
Biogenic methane is not neutral
The −1/+1 neutrality applies only to biogenic CO₂. When biogenic carbon is released as methane — landfill, enteric fermentation, anaerobic decay — it carries the full warming weight of methane, currently 27 on the AR6 GWP-100 basis, not zero. Any allocation that touches a biomethane or organic-decay co-product must keep the biogenic-CO₂ and biogenic-CH₄ streams separate, because they carry opposite climate signs. The same care applies to nitrous-oxide co-streams at 273.
Land-use change and carbon storage
Where a biogenic product is linked to land conversion, the associated carbon-stock loss is amortised over a fixed window — 5% per annum, i.e. a 20-year straight-line release — and that amortised LUC burden is itself subject to the same allocation split as the rest of the inventory. To claim a removal (a stored-carbon credit) rather than mere neutrality, the carbon must be demonstrably stored for at least 100 years; storage below that permanence threshold is reported as a delayed emission, not a removal. For the full land-sector treatment, see the GHG Protocol Land Sector and Removals Standard.
Worked Example: Allocating a Dairy Process
A complete worked example showing how method choice alone changes the published footprint. All arithmetic is hardcoded — this is an audit record at the snapshot date of this methodology revision, not a live calculation.
A dairy process emits 1,000 kg CO₂e of shared cradle-to-gate emissions while producing two co-products in one inseparable operation: 900 kg of skimmed milk (revenue £540, i.e. £0.60/kg) and 100 kg of cream (revenue £360, i.e. £3.60/kg). Subdivision is impossible (one separator, one heat source) and no system-expansion counterfactual applies, so the analyst must choose between mass and economic allocation — and the choice moves the result by more than 3×.
| Step | Skimmed milk | Cream |
|---|---|---|
| Mass (kg) | 900 | 100 |
| Revenue (£) | 540 | 360 |
| Mass allocation factor | 900 ÷ 1,000 = 0.90 | 100 ÷ 1,000 = 0.10 |
| Emissions by mass (kg CO₂e) | 0.90 × 1,000 = 900 | 0.10 × 1,000 = 100 |
| Economic allocation factor | 540 ÷ 900 = 0.60 | 360 ÷ 900 = 0.40 |
| Emissions by revenue (kg CO₂e) | 0.60 × 1,000 = 600 | 0.40 × 1,000 = 400 |
| Per-kg footprint, mass basis | 900 ÷ 900 = 1.00 kg CO₂e/kg | 100 ÷ 100 = 1.00 kg CO₂e/kg |
| Per-kg footprint, economic basis | 600 ÷ 900 = 0.67 kg CO₂e/kg | 400 ÷ 100 = 4.00 kg CO₂e/kg |
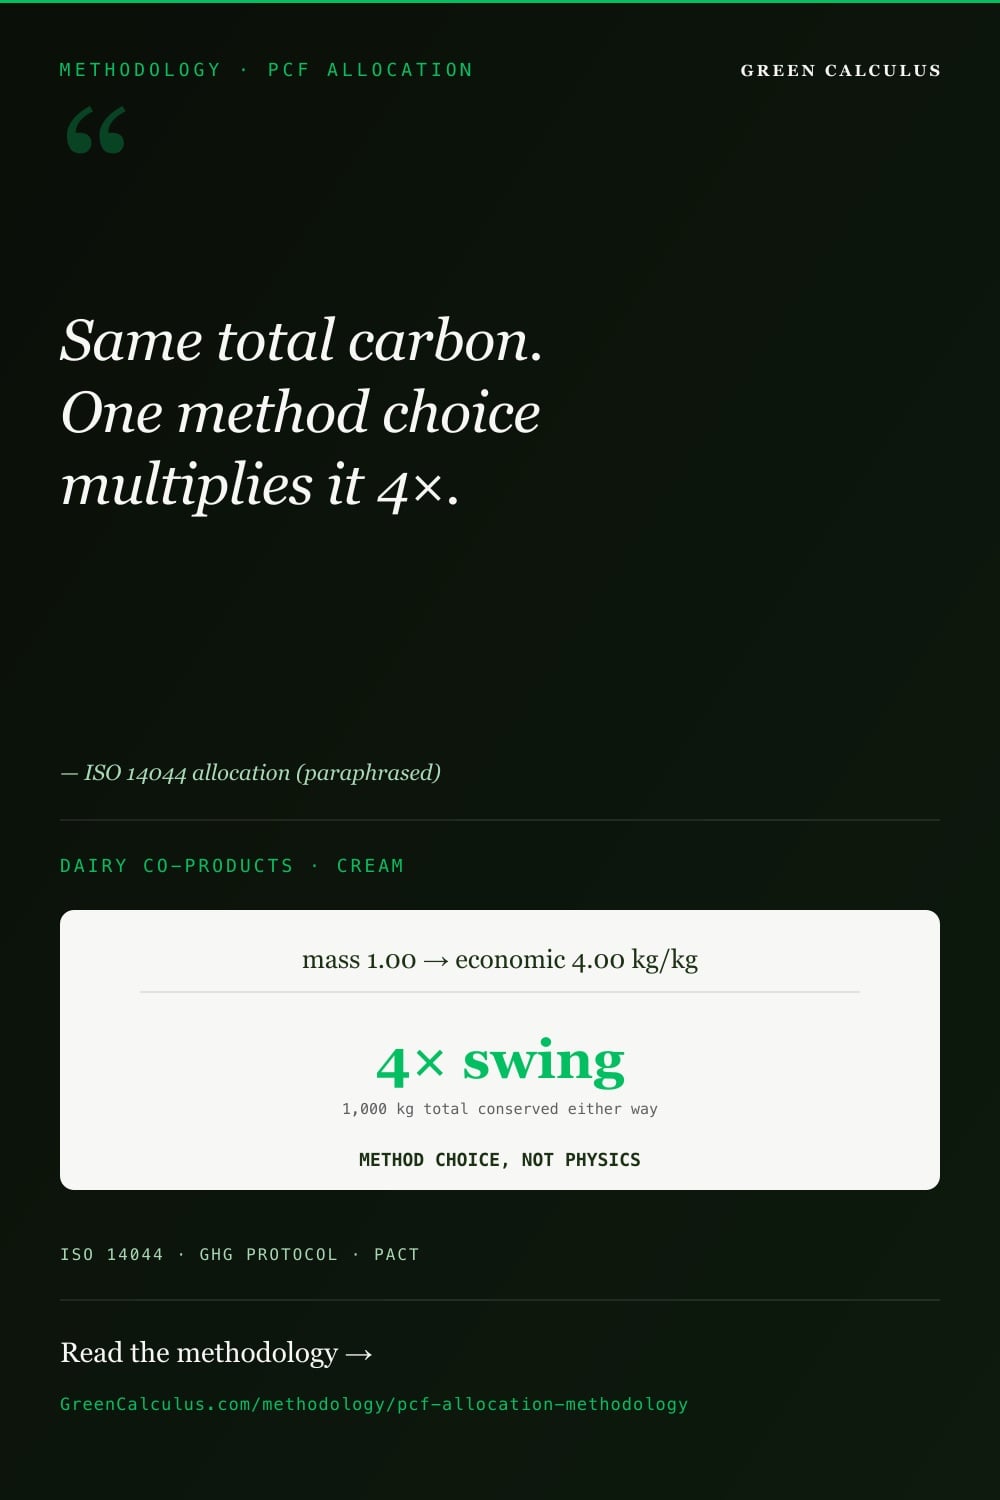
The two methods agree on the total (1,000 kg CO₂e is conserved) but disagree completely on the per-kilogram footprint of cream: 1.00 kg CO₂e/kg under mass allocation versus 4.00 kg CO₂e/kg under economic allocation — a 4× difference from method choice alone. The divergence is visualised below.
Neither answer is “wrong” — but they answer to different rules of the hierarchy. Mass allocation is defensible here because milk and cream are physically commensurable dairy fractions and mass plausibly tracks the separator’s energy draw. Economic allocation would require first documenting why that physical basis fails. The example shows why the methodology statement, not the number, is what a verifier actually audits: the same inventory yields a publishable cream footprint anywhere from 1.00 to 4.00 kg CO₂e/kg depending on a single justified choice.
Allocation Governance and Audit Trail
Because allocation is where defensible judgement and indefensible manipulation look alike on the page, the governance around the decision matters as much as the decision itself. A PCF that survives third-party verification carries an allocation audit trail with the following elements.
- Hierarchy rejection log. For every allocation applied, a written record of why each higher tier (subdivision, system expansion, physical allocation) was infeasible. This is the single most-scrutinised artefact.
- Stated method and basis. The chosen method (mass / energy / economic / substitution) and the exact physical property or price reference used, with units.
- Co-product / waste determinations. Evidence that each output classified as “waste” genuinely has no economic value or market — not an assertion.
- Price source and period (economic allocation). The price dataset, its reference window (multi-year average preferred over spot), and the date sampled.
- Recycling convention declared. Cut-off, end-of-life, or Circular Footprint Formula, named alongside the framework that mandates it.
- Consistency check. Confirmation that emissions and biogenic carbon were allocated on the same basis, and that attributional and consequential methods were not mixed in one boundary.
- Sensitivity analysis. A demonstration of how the headline result moves under alternative defensible allocation choices — an ISO 14044 requirement for any study with significant allocation, not an optional appendix.
The sensitivity analysis deserves emphasis because it is the most-skipped requirement. ISO 14044 requires that where allocation materially affects the result, the study test the effect of alternative procedures. In the dairy example above, that means publishing both the mass and economic cream footprints and explaining the chosen basis — not quietly selecting the lower number. A sensitivity analysis converts allocation from a hidden assumption into a disclosed, bounded uncertainty, which is exactly what a reasonable-assurance verifier and a Scope 3 Category 1 data recipient need.
Common Allocation Errors
Each error below produces a specific, recognisable distortion and is among the findings that most frequently appear in PCF verification reports.
| Error | What happens | How to avoid |
|---|---|---|
| Inverting the hierarchy | Jumping straight to economic allocation without testing subdivision, system expansion, or a physical basis. The most common verification finding. | Keep a written hierarchy rejection log for every allocation applied (governance checklist item 1). |
| Mixed-basis carbon split | Allocating process emissions economically but biogenic carbon by mass (or vice versa), breaking the carbon balance. | Allocate emissions and biogenic carbon on one consistent basis within a process. |
| Waste-labelling a co-product | Reclassifying a saleable by-product as “waste” to remove it from the denominator and lighten the main product. | Document market evidence (price, buyer) for every output excluded as waste. |
| Spot-price economic allocation | Using a single day’s commodity price, making the footprint swing with the market. | Use a multi-year average price; record the source and window; run a price sensitivity. |
| Consequential leak into attributional | A substitution credit produces a negative PCF inside an attributional report (Scope 3, EPD, Pathfinder exchange). | Keep substitution out of attributional boundaries; label any substitution result explicitly. |
| Silent recycling convention | Publishing a cut-off PCF without saying so, then comparing it to an end-of-life-credited competitor figure. | State the recycling convention and mandating framework in the methodology statement. |
| Recycling double-count | Both the end-of-life product and the next recycled-content product claim credit for the same loop. | Pick one convention market-wide for the loop; cut-off avoids the issue structurally. |
| Skipping the sensitivity analysis | Presenting a single allocated number as if no alternative existed, hiding a material uncertainty. | Publish the result under at least one alternative defensible allocation (ISO 14044 requirement). |
How the Allocation Choice Flows into the PCF Calculator
A PCF calculator can automate the arithmetic of allocation once the upstream judgement is made — but it cannot make the judgement for you. The split below is the same division between mechanical computation and analyst decision that governs every methodology on this platform.
What a calculator handles
Applying the mass, energy, or economic allocation factor once the basis is chosen; conserving the total across co-products; reapplying the chosen factor consistently to biogenic carbon; computing per-functional-unit footprints; and generating the side-by-side sensitivity comparison across alternative bases.
What you must decide first
Whether subdivision or system expansion can avoid allocation entirely; whether a physical relationship is defensible; which outputs are co-products versus waste; the price source and period for economic allocation; the recycling convention; and whether the study is attributional or consequential. None of these are computable — they are documented judgements.
The boundary and cradle-stage rules that frame these decisions are set out on the ISO 14067 cradle-to-gate methodology and cradle-to-grave methodology pages; for whole-building products, the allocation rules interact with the BS EN 15978 module structure. In every case the footprint a calculator returns is only as defensible as the allocation decisions documented before the inputs were entered, expressed in CO₂e against a clearly stated functional unit.
Allocation is one decision inside the full product carbon footprint workflow. The cradle-to-gate and cradle-to-grave methodology pages set the boundary rules these allocation choices sit within.
PCF methodology series. Core methods: cradle-to-gate, cradle-to-grave, allocation, frameworks comparison, sensitivity & hotspots. Sector methods: food, apparel & textile, electronics, packaging, beverages.
Frequently Asked Questions
Not by rule of method, but by rule of hierarchy. ISO 14044 places any physical relationship — including mass — above economic allocation, so where mass has a defensible causal link to the shared emissions, it is preferred. But mass is not automatically valid: if a high-mass, near-worthless output would absorb most of the footprint despite barely driving the process, mass fails the causal test and the hierarchy permits the descent to economic allocation. The preference is for the highest tier that genuinely fits, not for mass specifically.
Almost always because they used system expansion with a substitution credit larger than the process emissions — common for digestate, biochar, or recovered-energy co-products. The number is mathematically valid within consequential modelling but does not belong inside an attributional value-chain total such as Scope 3 Category 1. Ask the supplier for the attributional, allocation-based figure instead. A negative PCF arriving in an attributional reporting boundary is a signal that consequential and attributional methods have been mixed.
It depends on the framework you report under. For supplier-to-customer PCF exchange under the WBCSD Pathfinder Framework, cut-off (recycled content) is the default because it is reproducible and never double-counts. For EU environmental claims, the Circular Footprint Formula is mandatory. For many EPDs and building LCAs, an end-of-life avoided-burden approach is conventional. The convention is not a free choice you optimise — it is set by the standard your declaration must satisfy. What is never acceptable is leaving it unstated, because cut-off and end-of-life results are not comparable even though they look like the same metric.
The test is factual, not discretionary: does the output have a positive economic value and a market that buys it? If yes, it is a co-product and must take a share of the upstream burden via allocation. If it has zero or negative value and no market, it is a waste and carries only its own treatment emissions, not any allocated upstream burden. The classification has large leverage — moving an output to “waste” concentrates the whole footprint on the remaining products — so verifiers require documented market evidence (a price, a buyer, a sales record) for any output excluded as waste. Reclassifying a saleable by-product as waste to lighten the main product is a recognised greenwashing pattern.
No — and this is the key to understanding why the choice is still so consequential. Allocation conserves the total: every method splits the same fixed pool of shared emissions, so the sum across all co-products is identical regardless of method. What changes is the per-product footprint, which is what gets compared, marketed, and regulated. In the dairy example on this page, the 1,000 kg CO₂e total is unchanged whether you allocate by mass or by revenue, but the cream footprint moves from 1.00 to 4.00 kg CO₂e per kg. Allocation redistributes; it does not create or destroy emissions.
It is a requirement of ISO 14044 wherever allocation materially affects the result, not an optional extra. The standard requires that the study test the influence of alternative allocation procedures on the outcome. In practice this means publishing the result under at least one credible alternative basis and explaining the chosen one. It is also the most frequently skipped requirement, which is why a missing or token sensitivity analysis is a common verification finding. Treat it as part of the deliverable, not an appendix you add if there is time.
On the same basis as the process emissions — that consistency is the rule that keeps the carbon balance intact. If you allocate a sawmill’s energy emissions by mass across planks and chips, you must allocate the sequestered biogenic carbon by mass too; mixing an economic split for emissions with a mass split for biogenic carbon produces a physically impossible result. Remember also that the biogenic-CO₂ neutrality convention (uptake −1, release +1) applies only to CO₂. Biogenic methane carries the full AR6 methane GWP, so any co-product whose biogenic carbon is released as methane must be tracked separately from the neutral biogenic-CO₂ stream.