
Sector PCF — Packaging Calculator (PET / Aluminium / Glass / Corrugated)
Compute a cradle-to-gate product carbon footprint for a pack built from PET, aluminium, glass, and corrugated board, blending virgin and recycled material factors under ISO 14067, normalised to your chosen functional unit.
What this calculator computes. A cradle-to-gate ISO 14067 product carbon footprint (PCF) for a packaging unit, built bottom-up from its component materials. Each component contributes its mass multiplied by a material A1–A3 emission factor (optionally plus end-of-life C3), and the pack total is normalised to a user-selected functional unit. The result is the embodied carbon of the empty pack at the material gate — not the filled product, and not the full life cycle.
Where the factors come from. Plastics (PET, HDPE, LDPE/LLDPE, PP and others) and paper or board are DEFRA / DESNZ 2025 Material-use factors, carried per tonne and converted to per-kilogram by the engine, on an AR5 GWP-100 basis. Aluminium is sourced from the European Aluminium Environmental Profile Report 2024, per kilogram. Every named plastic grade and every paper grade carries a two-key virgin and recycled pair; recycled content is applied as a linear cut-off blend across the two, by percentage, per component.
Forming is excluded — read this before trusting a number. The material factors are the material story only. Bottle-blowing, can-making (draw-and-iron), and corrugating are not in them; aluminium is explicitly ingot-only. If your declared boundary needs the conversion stage, add it as a Custom-EPD component — the calculator never silently assumes it in.
Glass is a partial boundary. Container glass has no cradle-to-gate factor in MasterBrain. The engine uses the IPCC 2006 melt-process CO2 factor adjusted for cullet, and flags every glass result as melt-process CO2 only — a process-emission floor, not a like-for-like A1–A3 value. For an audit-grade glass figure, supply a Custom-EPD component. This is explained in full in the glass section below.
Boundary and basis. Cradle-to-gate A1–A3 by default, AR5 GWP-100, product-level under ISO 14067 and the GHG Protocol Product Standard. An optional +C3 toggle adds end-of-life incineration where the material declares it. Transport of the empty pack, filling, the use stage, C4 landfill, and Module D recovery credit are excluded. For corporate accounting this maps to the buyer’s Scope 3 Category 1 (purchased goods).
Add the bottle, closure and label components above to calculate
Results appear instantly. A contribution-by-material bar, component hotspots (Pareto), a data-quality / confidence meter, the recycled-content lever, a material comparison and the full audit trail appear after calculation.
Results are indicative cradle-to-gate Product Carbon Footprints for packaging, aligned with the GHG Protocol Product Life Cycle Standard and ISO 14067:2018, reported per the functional unit you choose. There is no published per-pack packaging PCF in MasterBrain — the figure is built up from verified embodied-material factors: DEFRA/DESNZ 2025 Material-use A1–A3 for plastics, paper and container glass (virgin and recycled, blended by recycled content) and European Aluminium EPR 2024 ingot for aluminium. Glass uses the DEFRA cradle-to-gate container-glass factor (a like-for-like A1–A3 figure); glass has no module C3 because it is an inert mineral that releases no combustion CO₂ at end-of-life. Aluminium is on an ingot basis — can/sheet forming is excluded. Container forming/converting energy, distribution of the filled pack, end-of-life module C4 (landfill) and module D (recycling credit) are outside this boundary unless explicitly added. Generic material factors suit early-stage estimating only — replace the most material components with supplier EPDs, confirm masses and recycled content, and complete a critical review under ISO 14067 / ISO 14071 before publishing a PCF, issuing an EPD, or exchanging product footprints.
Packaging carbon is where good intentions most often meet bad arithmetic. A switch from plastic to glass “because glass is recyclable” can quietly triple a pack’s footprint; a claim of “100% recycled board” can be worth far less than it sounds once you check what the recycled factor actually saves. The material choice, the recycled fraction, and the boundary you draw each move the number by more than most teams expect.
A defensible packaging PCF is built component by component, blends virgin and recycled factors honestly, and is explicit about what the material factor does and does not include — above all, that it stops at the material gate and leaves forming, filling, and disposal outside.
A packaging product carbon footprint is the cradle-to-gate CO2e embodied in a pack’s materials — PET, aluminium, glass, or corrugated board — blended by recycled content and normalised per pack or per litre contained. It excludes forming, filling, and disposal unless added.

What Is a Packaging Product Carbon Footprint?
A packaging product carbon footprint quantifies the greenhouse-gas emissions embodied in producing a packaging unit, expressed in carbon dioxide equivalent (CO2e). The figure this calculator returns is cradle-to-gate: everything embodied in the materials up to the point they leave the material producer’s gate, summed across each component of the pack. It is the number a buyer reports under Scope 3 Category 1 for purchased packaging, and the number an auditor reconciles against the A1–A3 stage of a supplier’s Environmental Product Declaration.
Material Gate, Not Product Gate
The boundary stops at the material, not the finished container. A PET factor describes the polymer resin; it does not include blowing that resin into a bottle. An aluminium factor describes the ingot; it does not include rolling and drawing it into a can. This matters because forming can add a substantial, sometimes dominant, share of a finished pack’s footprint — and because a PCF that silently includes forming in some materials but not others is not comparable across materials. The calculator keeps the material factor clean and asks you to add forming explicitly where your boundary needs it.
Cradle-to-gate covers raw-material extraction and material production (life-cycle modules A1–A3). It stops before the empty pack is shipped, filled, used, or disposed of. If you need the filled-product or full-life-cycle figure, that is a cradle-to-grave question handled by a different tool — this calculator is deliberately scoped to the material embodied carbon you can change through material and recycled-content choices.
How the Pack Total Is Built — Components, Mass, and the Functional Unit
There is no single “packaging emission factor.” A pack is assembled component by component — a bottle plus a closure plus a label plus a secondary carton — because each component can be a different material with a different recycled fraction. The engine computes each component’s contribution, sums them into a pack total, and then divides by the functional unit.
The Calculation Chain
For each component, the engine multiplies its mass in kilograms by a blended material factor (and, if the end-of-life toggle is on, adds the material’s C3 factor). It sums those component contributions into the pack total, then normalises: pack total divided by the functional unit, divided by any reuse cycles. Component masses are entered in grams, so a 9 g closure and an 18 g label are accounted distinctly from the 22 g bottle body.
The Functional Unit Is Yours to Choose
The functional unit is user-selectable, not fixed, because the right basis depends on the question. Per pack answers “what does one container cost in carbon”; per 1,000 packs suits production-run reporting; per litre of product contained or per kilogram contained normalises across pack sizes and lets you compare a 330 ml can against a 1.5 litre bottle on equal terms. Choosing the wrong functional unit is one of the easiest ways to make two packs look comparable when they are not — always state the unit alongside the number.
A large pack almost always has a lower footprint per litre contained than a small one, because the material mass does not scale linearly with volume — a 1.5 litre bottle does not use five times the PET of a 330 ml bottle. Comparing two formats per pack flatters the small one; comparing per litre contained reflects what the consumer actually buys. The calculator exposes both so you can see the gap.
Recycled Content — The Linear Cut-Off Blend
Recycled content is the single most-claimed lever in packaging, and the one most often misquoted. The calculator handles it precisely: every named plastic grade and every paper grade carries two factors — a virgin value and a recycled value — and recycled content is applied as a linear cut-off blend between them, per component.
The blend is straightforward: the effective factor equals the virgin factor times the virgin fraction, plus the recycled factor times the recycled fraction. A component declared at 50% recycled content sits exactly halfway between its virgin and recycled factors. This is cut-off allocation — the recycled input enters the system burden-free of its first life, and no avoided-burden or Module D recovery credit is applied. It is a deliberately conservative, widely-accepted convention that does not let a recycled claim manufacture a credit.
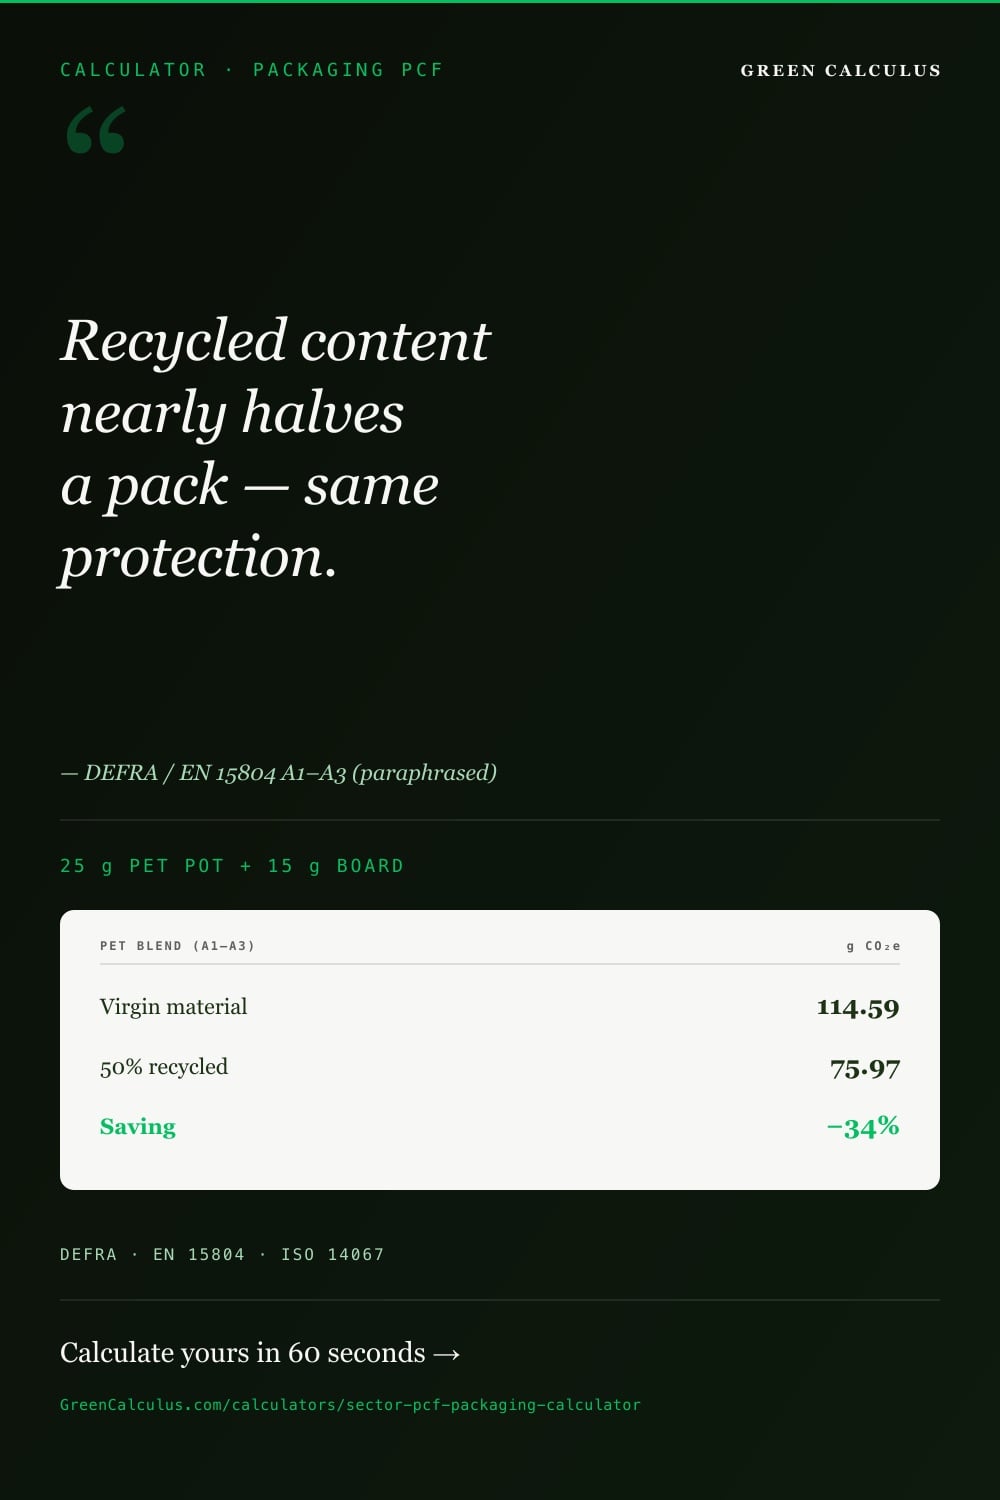
The saving depends entirely on the gap between the two factors, and that gap varies by material. For PET the recycled factor is roughly 57% of virgin; for HDPE and PP it is a little over half; for corrugated board it is only a few percent below virgin, because recovered fibre is already the dominant feedstock. A “100% recycled board” claim is real but modest in carbon terms; a “100% rPET” claim saves far more. Do not assume recycled content saves the same proportion across materials — read the two factors.
Two material types behave differently. Aluminium uses the same two-key blend, but its virgin-to-recycled gap is enormous. Glass has no recycled factor at all in this calculator; its secondary-content lever is the cullet ratio inside the melt-process model, not a recycled-material factor — covered in the glass section below.
The Four Headline Materials — PET, Aluminium, Glass, Corrugated
The table below shows the cradle-to-gate A1–A3 material factors for the four headline materials, virgin and recycled, as read by the engine at MasterBrain v2026.203. Plastics and paper are DEFRA / DESNZ 2025 Material-use factors carried per tonne and shown here per kilogram; aluminium is European Aluminium EPR 2024, per kilogram.
| Material | Virgin A1–A3 | Recycled A1–A3 | Recycled vs virgin | Source |
|---|---|---|---|---|
| PET | 3.86 kg CO2e/kg | 2.21 kg CO2e/kg | ~57% of virgin | DEFRA / DESNZ 2025 |
| HDPE | 3.10 kg CO2e/kg | 1.77 kg CO2e/kg | ~57% of virgin | DEFRA / DESNZ 2025 |
| LDPE / LLDPE (film) | 2.97 kg CO2e/kg | 1.10 kg CO2e/kg | ~37% of virgin | DEFRA / DESNZ 2025 |
| PP | 2.58 kg CO2e/kg | 1.31 kg CO2e/kg | ~51% of virgin | DEFRA / DESNZ 2025 |
| Corrugated board | 1.20 kg CO2e/kg | 1.10 kg CO2e/kg | ~92% of virgin | DEFRA / DESNZ 2025 |
| Aluminium (ingot) | 10.1 kg CO2e/kg | 0.26 kg CO2e/kg | ~3% of virgin (~39×) | European Aluminium EPR 2024 |
| Container glass | Partial boundary — melt-process CO2 only (see below) | IPCC 2006 | ||
Plastics and paper values are DEFRA / DESNZ 2025 Material-use factors, AR5 GWP-100, carried per tonne in MasterBrain and shown here per kilogram. Aluminium is European Aluminium EPR 2024, AR5 GWP-100. All four read live at MasterBrain v2026.203 and can shift on a data-layer version bump. Container glass is not a cradle-to-gate figure — see the glass section.
PET — Bottle vs Tray Is Not in the Factor
PET is carried as a single polymer-grade factor. There is no separate bottle and tray figure, because the difference between a bottle and a tray is a forming distinction, and forming is outside the material factor. Recycled PET (rPET) is the recycled key, blended by percentage — a pack declared at 50% rPET sits halfway between the virgin and recycled PET factors, not at a distinct “rPET material” value.
Aluminium — The Largest Lever in Packaging
Aluminium carries the widest virgin-to-recycled gap of any packaging material: primary ingot at 10.1 kg CO2e/kg against recycled secondary at 0.26 kg CO2e/kg — roughly a 39-fold difference, because remelting scrap avoids the enormous electricity demand of primary smelting. For an aluminium can, recycled content is the dominant determinant of the footprint. Note the factor is ingot-only: can-making is a forming step and must be added separately. Note too a tagging subtlety — in MasterBrain the aluminium ingot row is tagged for a building-materials (Scope 3 Category 2) context; for packaging it is a purchased good and belongs in Scope 3 Category 1.
Corrugated — Already Mostly Recycled
Corrugated board is the DEFRA “board” category — there is no separate corrugated key. Its virgin and recycled factors are close together (1.20 versus 1.10 kg CO2e/kg) because recovered fibre already dominates the board supply chain, so the marginal carbon saving from a higher recycled fraction is small. Corrugated’s advantage is its low absolute factor and low mass per pack, not a large recycled-content lever.
Why Glass Is a Partial Boundary in This Calculator
This is the most important caveat on the page. Container glass does not have a cradle-to-gate emission factor in MasterBrain. The only container-glass factors available are the IPCC 2006 melt-process figures — 0.21 tonne CO2 per tonne of glass melted for both flint (clear) and amber/green — and that figure is a Scope 1 process-emission factor, not an A1–A3 embodied-carbon value.
What the Melt Factor Does and Does Not Cover
The 0.21 figure captures only the CO2 released when carbonate raw materials decompose in the furnace. It excludes the furnace combustion fuel that supplies the melt energy, the upstream emissions of the batch materials, and the forming and annealing of the container. Those stages typically dominate a real container-glass footprint, so the melt factor alone is a fraction of the true cradle-to-gate number — a floor, not an estimate.
How the Engine Handles It Honestly
The calculator does not pretend otherwise. It reads the melt factor, applies it to the non-cullet fraction of the charge — melt CO2 times one minus the cullet ratio, with a default cullet ratio of 0.50 per the IPCC default — and then flags every glass result as melt-process CO2 only, a partial boundary. Cullet (recycled glass) is glass’s secondary-content lever here, standing in for the recycled-material factor the other materials have. For an audit-grade glass figure, the escape hatch is a Custom-EPD component: enter a supplier’s published cradle-to-gate glass EPD value directly, and the calculator uses that instead of the partial melt model.
If a glass result appears far lower than you expect, that is the partial-boundary flag doing its job — not a sign that glass is low-carbon. Container glass is in reality one of the heavier packaging materials per litre delivered, driven by furnace fuel and pack mass, neither of which the melt factor includes. Never compare a flagged glass melt result against a full cradle-to-gate PET or aluminium figure; they are different boundaries. Supply a glass EPD before making any cross-material claim that involves glass.
What’s Excluded — Forming, Filling, Transport, and End-of-Life
The default boundary is cradle-to-gate A1–A3, and several stages a finished-pack analysis might expect are deliberately outside it. Knowing what is excluded is as important as knowing what is included, because silently assuming any of these stages in is a common source of non-comparable footprints.
Forming Is the Big One
Bottle-blowing for PET, draw-and-iron can-making for aluminium, and corrugating for board are all forming steps applied to the material after the material gate. None of them is in the material factor. Aluminium is explicitly ingot-only. Where your declared boundary needs the conversion stage, add it as a Custom-EPD component with the converter’s own data — the calculator flags in the result that forming is excluded so it is never assumed in by accident.
End-of-Life Is Off by Default
The default result is A1–A3 only. An optional toggle adds end-of-life C3 (incineration) for materials that declare it — every plastic grade and every paper grade carries a C3 factor, with glass the one exception, having no end-of-life factor at all. C4 landfill, Module D recovery credit, transport of the empty pack, filling, and the use stage are all excluded. End-of-life is excluded by default for the same reason as in the electronics PCF calculator: it belongs to a downstream boundary and a different reporting category.
Worked Example — A 500 ml Bottle, PET vs Glass vs Aluminium
This example compares three formats for the same 500 ml single-serve beverage, all on the same per-pack functional unit, all virgin material, cradle-to-gate A1–A3. The point is not the absolute numbers but the relationship between them — and the asterisk on glass.
Three formats compared on identical assumptions. PET and aluminium are full cradle-to-gate; the glass line is melt-process CO2 only and is therefore not comparable to the other two without a glass EPD. Values are as computed in the calculator at engine v1.0.0 / MasterBrain v2026.203; the live calculator is the source of truth.
| Format | Body mass | Virgin factor | Body A1–A3 | Boundary note |
|---|---|---|---|---|
| PET bottle | 22 g | 3.86 kg CO2e/kg | ≈ 0.085 kg CO2e | Full cradle-to-gate (forming excluded) |
| Aluminium can | 14 g | 10.1 kg CO2e/kg | ≈ 0.141 kg CO2e | Ingot only (can-making excluded) |
| Glass bottle | 300 g | Melt-process CO2 only — partial boundary* | Not comparable without a glass EPD | |
*The glass line deliberately carries no comparable A1–A3 total. Its melt-process figure excludes furnace fuel, batch upstream, and forming, so it understates the true container-glass footprint — which, at roughly 300 g of glass against 22 g of PET, is in reality the heaviest of the three. Supply a cradle-to-gate glass EPD as a Custom-EPD component to compare like with like. Body masses are illustrative single-serve figures; closures, labels, and secondary packaging are additional components in a full pack build.
Two lessons sit in this table. First, the PET-versus-aluminium comparison flips entirely on recycled content: at high recycled fractions the aluminium can — recycled secondary at 0.26 kg CO2e/kg — drops well below the PET bottle, while at all-virgin it sits above. Second, the glass line shows exactly why the partial-boundary flag exists: a naive reading of the melt factor would make 300 g of glass look competitive with 22 g of PET, which is the opposite of reality.
Material Switching — Reading the Footprint Honestly
The most common reason teams reach for a packaging PCF is to evaluate a material switch — plastic to glass, virgin to recycled, single-use to reusable. The calculator is built to support that, but only if the comparison is set up honestly.
Plastic to glass
Almost always increases the footprint per litre delivered, because glass is far heavier per unit volume and its real cradle-to-gate carbon is dominated by furnace fuel. The calculator’s partial glass boundary means you must supply a glass EPD before this comparison is valid — without one, the melt-only figure will mislead in glass’s favour.
Virgin to recycled
The clearest win, but the size of the win is material-specific. Aluminium saves the most in absolute terms (a ~39× factor gap), rPET a substantial proportion, recycled board only a few percent. Model the actual recycled percentage you can source, not an aspirational 100%.
Single-use to reusable
Reuse divides the embodied footprint across cycles — the calculator’s reuse-cycles input does exactly this. A heavier reusable pack can beat a lighter single-use one, but only above a break-even number of cycles that depends on the mass penalty. Reuse also brings wash and return-transport burdens that sit outside this cradle-to-gate boundary and must be assessed separately.
In every case the discipline is the same: same functional unit, same boundary, same recycled-content assumptions on both sides of the comparison, and a real EPD wherever glass is involved.
Standards and Frameworks Governing Packaging PCFs
A packaging PCF is governed by the same product-level accounting standards as any manufactured good. Four frameworks matter most and are broadly compatible.
| Framework | What it governs | Relevance to packaging |
|---|---|---|
| ISO 14067 | Product carbon footprint quantification and reporting, on ISO 14040/14044 LCA principles | The primary standard this calculator follows; defines the cradle-to-gate boundary and functional-unit discipline |
| GHG Protocol Product Standard | Product life-cycle GHG accounting and reporting | Co-governing framework; aligns the pack PCF with the buyer’s Scope 3 Category 1 purchased-goods accounting |
| EU Product Environmental Footprint | Multi-criteria LCA method with prescriptive category rules | Relevant for EU-market packaging declarations; carbon is one of several PEF impact categories |
| DEFRA / DESNZ 2026 | UK national conversion factors, including Material-use factors | The factor source for the plastics and paper material lines in this calculator |
For the buyer of packaging, the resulting figure feeds Scope 3 Category 1. The plastics and paper rows are tagged as purchased goods; the aluminium ingot row carries a building-materials tag in MasterBrain that should be read as Category 1 in a packaging context, not Category 2.
Common Packaging PCF Reporting Errors
Most defensibility problems in packaging PCFs come from a small set of recurring mistakes. The list below is the set most likely to draw a reviewer’s challenge.
- Quoting the glass melt figure as a cradle-to-gate footprint. The IPCC melt factor is process CO2 only; it excludes furnace fuel, batch upstream, and forming. Supply a glass EPD before any claim involving glass, and never compare a flagged glass result against full A1–A3 figures.
- Assuming forming is included. Bottle-blowing, can-making, and corrugating are outside the material factor. Aluminium is ingot-only. Add forming as a Custom-EPD component where the boundary requires it, or state explicitly that it is excluded.
- Treating recycled content as the same proportional saving across materials. Recycled PET saves a large share, recycled board only a few percent. Read both factors; do not generalise one material’s recycled benefit to another.
- Comparing formats per pack instead of per functional unit. A small pack flatters itself per pack. Normalise per litre or per kilogram contained when comparing across sizes or formats.
- Mixing GWP bases or factor sources. The plastics, paper, and aluminium factors here are AR5 GWP-100 cradle-to-gate. Do not blend in AR6 CBAM regulatory defaults or the Scope 1 glass melt factor — they are different quantities on different bases.
- Putting the aluminium line in the wrong Scope 3 category. The ingot row is MasterBrain-tagged for capital goods (Category 2) in its building context; for purchased packaging it is Category 1. Re-categorise it.
- Claiming a recovery credit. The calculator uses cut-off allocation and excludes Module D. A recycled-content pack does not also earn an avoided-burden credit in this boundary; claiming both double-counts the recycling benefit.
- Omitting the functional unit and recycled fractions from the declaration. A packaging PCF without its functional unit, boundary, and per-component recycled percentages cannot be reconciled or reproduced by a third party.
Data Sources, Factor Provenance, and Data-Quality Tiering
Provenance
The plastics and paper material factors are DEFRA / DESNZ 2025 Material-use factors, carried per tonne in MasterBrain and converted to per-kilogram by the engine, on an AR5 GWP-100 basis, current at MasterBrain v2026.203. Each named grade carries a virgin and a recycled key, and several also carry an end-of-life C3 factor read dynamically when the toggle is on. Aluminium is from the European Aluminium Environmental Profile Report 2024, per kilogram, with the same virgin-and-recycled pair. Container glass draws on the IPCC 2006 melt-process factor only, adjusted for cullet — explicitly a partial boundary.
How Uncertainty Is Expressed
Rather than a single ± figure, the calculator expresses confidence structurally. Material factors are national-average Material-use values — appropriate for screening and procurement comparison, less so for a specific supplier’s verified footprint. The partial-boundary flag on glass is itself an uncertainty signal: a flagged glass result is known to be incomplete. The Custom-EPD component is the route to higher data quality — replacing an average factor with a supplier’s verified EPD lifts that component from secondary to primary data. The honest reading of any result is the share of pack mass still resting on average factors versus supplier EPDs.
Version and Update Behaviour
The material factors are live MasterBrain values; a data-layer version bump that revises a DEFRA Material-use factor or the aluminium EPR figure changes the rendered result without any edit to this page. Always read the live result from the calculator and stamp any quoted figure with the engine and MasterBrain version.
Frequently Asked Questions
No. The material factors cover the material only — PET resin, aluminium ingot, board, glass melt — not the forming step that turns material into a finished container. Bottle-blowing, can-making, and corrugating are excluded and must be added as a Custom-EPD component if your boundary needs them. The calculator flags in the result that forming is excluded so it is never assumed in by accident.
Because glass uses a partial boundary. There is no cradle-to-gate container-glass factor available, so the calculator uses the IPCC melt-process CO2 figure adjusted for cullet, and flags it as melt-process only. That figure excludes furnace fuel, batch materials, and forming, which dominate a real glass footprint — so it understates glass substantially. Container glass is in reality one of the heavier packaging materials per litre. Supply a glass EPD as a Custom-EPD component for a comparable figure.
Each material has a virgin factor and a recycled factor, and recycled content blends linearly between them — 50% recycled sits halfway. The saving depends on the gap between the two factors, which varies by material: recycled PET saves a large share, recycled HDPE and PP a little over half, recycled corrugated board only a few percent because recovered fibre already dominates. Aluminium saves the most, with recycled secondary roughly 39 times lower than primary ingot.
Yes. Corrugated board uses the DEFRA “board” Material-use factor — there is no separate corrugated key. The board category covers corrugated, kraft, and paperboard. It carries both a virgin and a recycled value, though the two are close together because recovered fibre is already the dominant feedstock for board.
It depends on the question. Per pack answers “what does one container cost in carbon.” Per litre or per kilogram of product contained normalises across pack sizes and is the fairer basis when comparing formats, because material mass does not scale linearly with volume — a large pack usually has a lower footprint per litre than a small one. Always state the functional unit alongside the result; comparing two packs on different units is a common error.
Usually the opposite, once measured on a full boundary. Glass is far heavier per unit volume and its real cradle-to-gate carbon is dominated by furnace fuel, which the calculator’s melt-only glass figure does not include. To evaluate this switch validly you must supply a cradle-to-gate glass EPD; the partial melt figure will otherwise understate glass and mislead the comparison in its favour.
Cradle-to-gate A1–A3 by default, AR5 GWP-100, product-level under ISO 14067 and the GHG Protocol Product Standard. An optional toggle adds end-of-life C3 incineration where the material declares it. For corporate accounting the pack footprint maps to the buyer’s Scope 3 Category 1 (purchased goods). Transport of the empty pack, filling, the use stage, C4 landfill, and Module D recovery credit are excluded.
Because remelting recovered aluminium avoids the very large electricity demand of primary smelting from bauxite. Primary ingot sits near 10.1 kg CO2e/kg against roughly 0.26 for recycled secondary — about a 39-fold difference, the widest virgin-to-recycled gap of any packaging material. For an aluminium can, recycled content is the single biggest determinant of the footprint. The factor is ingot-only; can-making is added separately.
Methodology Notes and Limitations
Cradle-to-gate material boundary. The default headline is A1–A3 material embodied carbon to the material gate. Forming, filling, transport of the empty pack, the use stage, C4 landfill, and Module D recovery credit are out of scope. An optional +C3 toggle adds end-of-life incineration where the material declares it.
Forming is not included. Bottle-blowing, can-making, and corrugating are outside the material factor, and aluminium is ingot-only. Add forming as a Custom-EPD component where the boundary requires it. The result flags that forming is excluded.
Glass is a partial boundary. Container glass has no cradle-to-gate factor in MasterBrain; the calculator uses the IPCC 2006 melt-process CO2 figure times one minus the cullet ratio (default 0.50) and flags it as melt-process only. This excludes furnace fuel, batch upstream, and forming, and substantially understates a real glass footprint. Use a Custom-EPD component for an audit-grade glass figure. A cradle-to-gate glass row is a known MasterBrain backlog item.
Recycled content is cut-off allocation. Recycled content blends linearly between a virgin and a recycled factor per component; no avoided-burden or Module D credit is applied. Glass has no recycled factor — its secondary-content lever is the cullet ratio inside the melt model.
Factor basis and category. Plastics and paper are DEFRA / DESNZ 2025 Material-use factors carried per tonne (engine-converted to per kg), AR5 GWP-100; aluminium is European Aluminium EPR 2024 per kg, AR5 GWP-100. All map to the buyer’s Scope 3 Category 1. Do not blend in AR6 CBAM regulatory defaults or the Scope 1 glass melt factor as if they were cradle-to-gate A1–A3 values.
National-average data quality. Material-use factors are screening-grade national averages. For a specific supplier footprint or an external claim, replace material lines with supplier EPDs via the Custom-EPD component and have the inventory reviewed by a qualified LCA practitioner before use.
Once you have the pack’s embodied carbon, the next questions are how it rolls up into your purchased-goods total and how the boundary extends.