
SBTi Absolute Contraction Approach

Step-by-step method for calculating the emission reduction trajectory required under the SBTi Absolute Contraction Approach (ACA). Covers the near-term 4.2%/2.5% annual rate variants, long-term net-zero endpoint targets, Scope boundary requirements including the Scope 3 40% threshold, base year selection and restatement rules, and worked examples for manufacturing and retail company profiles. Aligned to SBTi Corporate Net-Zero Standard v2.0 and GHG Protocol Corporate Standard.
A methodology page is the execution layer — it takes the concept from the glossary, the rules from the standard, and the reduction rates from the data page, and tells you exactly how to translate base-year emissions into a verified annual reduction ceiling. If you know your base year and boundary, jump to the formula or the worked examples.
Pre-check — is ACA the right method for your sector?
SBTi maintains five distinct target-setting methods. ACA is the universal fallback, but if your sector has a mandated alternative, you must use it. Check your routing before proceeding.
Two valid ACA target types — both required, not either/or
The SBTi Corporate Net-Zero Standard requires companies to set two aligned targets: a near-term target (5–10 years out, minimum 4.2% p.a. for 1.5°C) and a long-term/net-zero target (90–95% absolute reduction by 2050 from base year). Both use the ACA formula, but the reduction rate and endpoint logic differ. Disclose both in your GHG inventory methodology statement.
Annual rate target (4.2% / 2.5% p.a.)
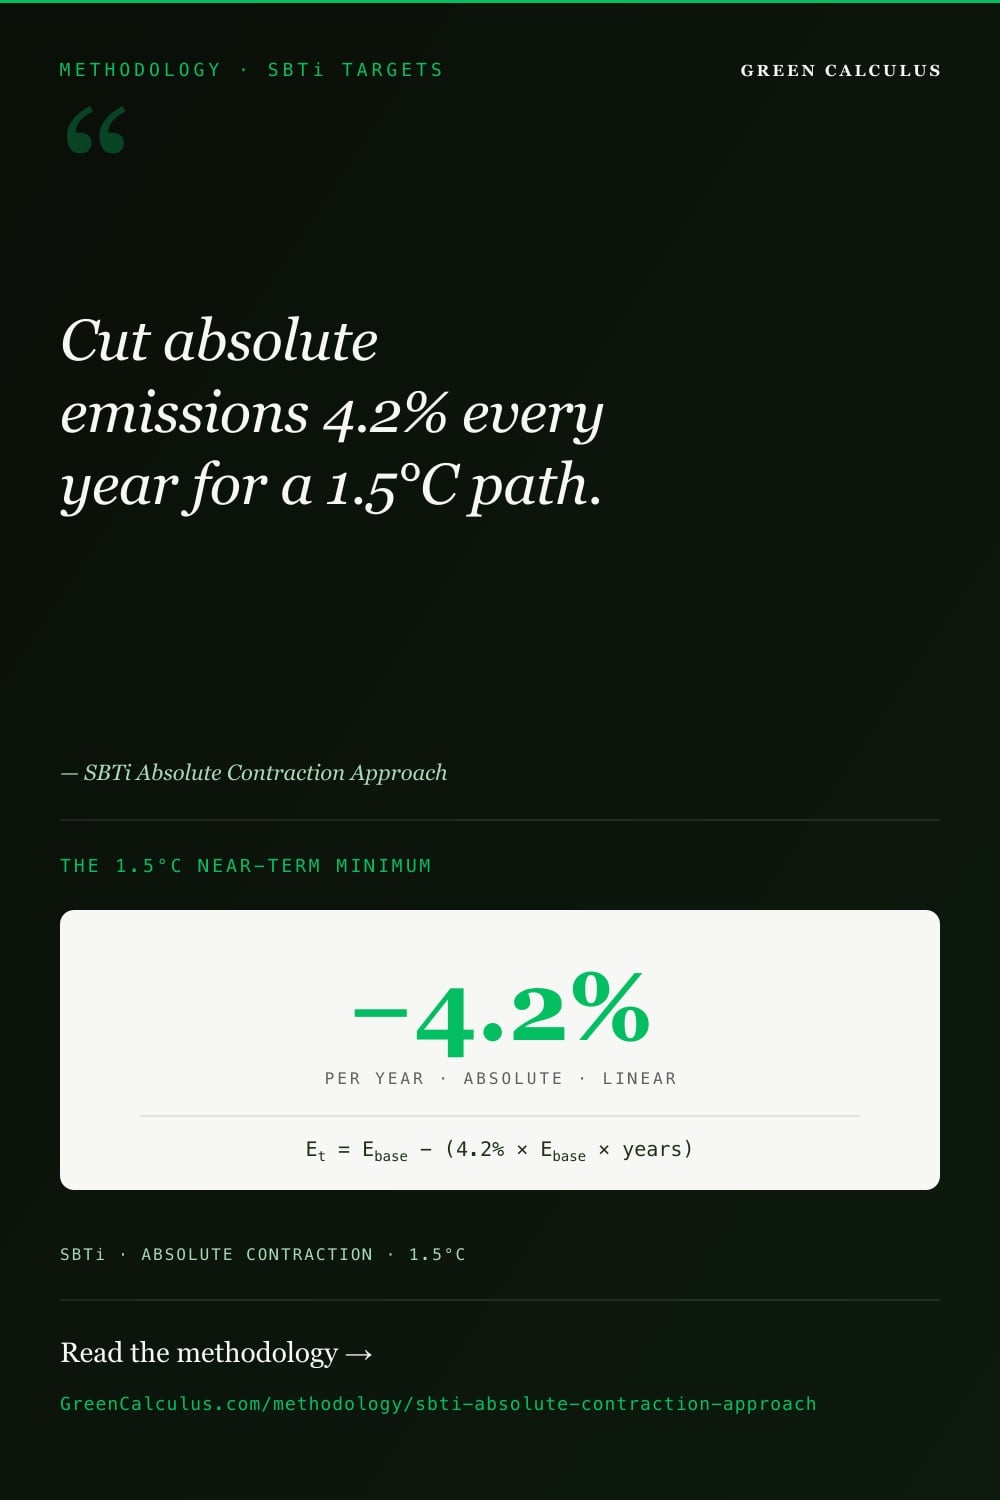
Apply the compound annual reduction rate to a 5–10 year target window. Minimum 4.2% p.a. for 1.5°C alignment; 2.5% p.a. for well-below-2°C. Covers Scopes 1+2 at minimum; Scope 3 required if above 40% materiality threshold. Used for: CDP A-list disclosure, SECR target statements, CSRD ESRS E1 climate target line items.
Absolute endpoint target (90–95% by 2050)
Achieve 90–95% absolute reduction in Scope 1+2+3 versus base year by no later than 2050. Residual emissions (5–10%) must be neutralised with permanent carbon dioxide removal (CDR), not avoidance offsets. Used for: SBTi Corporate Net-Zero Standard validation, long-term strategic planning, investor net-zero alignment claims.
When to Use This Methodology
- Calculating the minimum annual emissions ceiling for a near-term SBTi target
- Verifying whether an existing target qualifies as 1.5°C-aligned under ACA rules
- Building an internal carbon budget aligned to your SBTi trajectory
- Preparing CDP or CSRD ESRS E1 disclosures that require quantified target trajectories
- The ACA is applicable to all sectors as a universal fallback method when no SDA pathway is mandated
- Your sector has a mandatory SDA pathway — electricity generation, steel, cement, buildings, aviation, shipping, or passenger transport. Use SDA instead.
- Calculating FLAG (Forests, Land, Agriculture) targets — separate science basis. Note: FLAG targets are set alongside ACA, not as substitutes.
- Your company uses the Economic Intensity Contraction approach (intensity rather than absolute reduction; different formula and conditional SBTi approval).
- You are a financial institution calculating financed emissions targets — use the FFIS methodology with PCAF measurement standards.
Provider directory
Now you have to defend it.
See who does this work. Every listing names the standards it works to, and paid placements are labelled. Including First Environment and LRQA.
Browse 4 assurance & verification providers →Do this work? A listing is US$390 a year. Get listed →
Step 1 — The ACA Formula
The Absolute Contraction Approach applies a fixed annual percentage reduction to base-year emissions, compounded over the target window. It is a gross-reduction methodology — no offsets, credits, or avoided emissions are admissible toward meeting the target.
| Target type | Rate | Ambition level | Scope boundary | Applies to |
|---|---|---|---|---|
| Near-term | 4.2% p.a. | 1.5°C-aligned | Scope 1 Scope 2 | All sectors (ACA default minimum) |
| Near-term | 2.5% p.a. | Well-below-2°C | Scope 1 Scope 2 | Minimum acceptable floor; upgradeable to 1.5°C |
| Near-term (with S3) | 4.2% p.a. | 1.5°C-aligned | S1 S2 S3 | When Scope 3 ≥ 40% of total Scope 1+2+3 |
| Net-zero long-term | 90% reduction | Net-zero endpoint | S1+2+3 | All sectors; by 2050 at the latest |
| Net-zero long-term | 95% reduction | Net-zero endpoint | S1+2+3 | Where technically feasible (most manufacturing, services) |
Source: SBTi Corporate Net-Zero Standard v2.0 (October 2024) · SBTi Criteria and Recommendations v5.2.
(1 − 0.042)11 ≠ 0.042 × 11. A 4.2% annual reduction compounded over 11 years (2019→2030) produces a 37.62% total reduction, not 46.20%. This is the single most common numerical error in ACA target calculations submitted for SBTi validation. The maths: (1 − 0.042)11 = 0.6238, so the 2030 ceiling is 62.38% of base year emissions.
Need to apply this formula across your full inventory with audit trail? Open the SBTi Near-Term Target Calculator →
Step 2 — Base Year: The Decision That Controls Everything
Base year selection has more leverage on your eventual target than the rate choice itself. The ACA rate operates on whatever base figure you select, so a 10% misstatement in the base year produces a 10% misstatement in every annual ceiling for the entire trajectory — out to 2050. Treat this step with the same rigour you would apply to a financial restatement.
Four rules govern base year selection under SBTi v2.0 and the GHG Protocol Corporate Standard:
- The 7-year lookback window. The base year must fall within seven years of your target submission date. For 2026 submissions, the earliest valid base year is 2019.
- The restatement obligation. If your boundary changes significantly — M&A, divestiture, outsourcing of more than 5% of emissions, or methodology change — the base year must be restated to reflect the current boundary. The ACA rate then applies to the restated figure, not the original.
- The COVID-19 trap. Companies using 2020 (or 2021 in many cases) as base year start from an artificially suppressed activity level. SBTi requires explicit disclosure of base year selection rationale; for validations post-2022, justification is increasingly scrutinised.
- The cherry-picking test. Auditors examine whether the chosen base year is the highest emissions year in a recent trend. This is a yellow flag in ISO 14064-3 reasonable assurance audits and a common source of qualified opinions.
Step 3 — Scope Boundary and the 40% Rule
SBTi target boundary is not a free choice. The minimum boundary is set by SBTi rules; the maximum is set by your GHG Protocol organisational and operational boundaries. Get the boundary wrong at submission and you will either fail validation (boundary too narrow) or commit to a more demanding trajectory than required (boundary too broad, with no equivalent ambition credit).
| Boundary element | Requirement | Basis | Notes |
|---|---|---|---|
| Scope 1 | Required in all near-term ACA targets | GHG Protocol operational control boundary | All direct combustion, process, fugitive emissions within the boundary |
| Scope 2 | Required in all near-term ACA targets | GHG Protocol — market-based or location-based (must disclose which) | If market-based, PPAs and unbundled RECs count toward target progress |
| Scope 3 | Required if Scope 3 ≥ 40% of total Scope 1+2+3 | GHG Protocol Scope 3 Standard | Target must cover at least 67% of Scope 3 emissions by category |
| Scope 3 | Voluntary if Scope 3 < 40% | — | Encouraged but not mandated for near-term ACA |
| Scope 1+2+3 | Required for long-term/net-zero target | GHG Protocol full value chain | No materiality exception at net-zero level — all categories in scope |
You must calculate Scope 3 as a percentage of total Scope 1+2+3 using your actual base year inventory. Saying “we’re not a high-Scope-3 industry” is not sufficient for SBTi validation. If the calculation puts Scope 3 at 41%, the full-value-chain target requirement is triggered. Show the worked test in your submission: (Scope 3 base year) ÷ (Scope 1 + Scope 2 + Scope 3 base year) × 100. If the result exceeds 40%, Scope 3 must be included in the near-term target. See worked Example 2 for the test in action →
Scope 2 method consistency — the second-most-common validation rejection
SBTi requires you to apply the same Scope 2 accounting method (market-based or location-based) consistently from base year through target year. Switching mid-trajectory makes progress reporting meaningless and is a frequent ground for SBTi to reject re-validations. Choose deliberately at base year:
Not sure if your inventory meets SBTi submission readiness? Run the SBTi Readiness Checklist → before locking your boundary.
Step 4 — Worked Examples (Dual Mode: 1.5°C vs WB2°C)
Four complete calculations, each starting from a real-world data scenario. The first three show the 1.5°C pathway (4.2% p.a.) on the left and the well-below-2°C pathway (2.5% p.a.) on the right. The fourth shows the near-term 4.2% pathway on the left and the long-term net-zero endpoint on the right.
Scope 1: 38,000 tCO₂e | Scope 2 (market-based): 12,000 tCO₂e
Total S1+2 base: 50,000 tCO₂e | Target year: 2030 Verified inventory; no boundary changes since 2019; no Scope 3 included (assumed below 40% threshold for this example)
Scope 1: 2,000 tCO₂e | Scope 2 (market-based): 3,500 tCO₂e
Scope 3 (screened): 72,000 tCO₂e | Total S1+2+3: 77,500 tCO₂e Target year: 2030. Scope 3 covers 13 of 15 categories per Scope 3 Standard screening.
72,000 ÷ 77,500 = 92.90%. Scope 3 share exceeds 40%, therefore the near-term target must include Scope 3. Apply ACA to the full S1+2+3 base of 77,500 tCO₂e. Target must cover at least 67% of Scope 3 by category (≥ 9 of the 13 screened categories).
Original 2019 base (S1+2): 50,000 tCO₂e
Acquired subsidiary’s 2019 emissions (retroactively calculated): 8,500 tCO₂e
Restated 2019 base: 58,500 tCO₂e Acquisition exceeds 5% of original base; GHG Protocol recalculation policy triggered.
Scope 1+2 (restated, from Example 3): 58,500 tCO₂e
Scope 3 (newly screened, full value chain): 23,500 tCO₂e
Full S1+2+3 base: 82,000 tCO₂e | Net-zero target year: 2050 Net-zero target requires full S1+2+3 boundary regardless of the 40% rule.
Multi-year trajectory table — MFG Ltd from base year to net-zero
SBTi validates the endpoints (2030 near-term and 2050 net-zero) but companies must disclose annual progress against a defined trajectory. The standard approach is compound 4.2% p.a. through the near-term endpoint (2030), then linear interpolation to the 90% reduction endpoint at 2050. This is one valid path; a steeper near-term reduction or earlier net-zero would also satisfy SBTi.
| Year | Phase | Required ceiling (tCO₂e) | Reduction from base | Cumulative % |
|---|---|---|---|---|
| 2019 | Base year | 58,500 | 0 | 0.0% |
| 2025 | Near-term | 45,222 | 13,278 | 22.7% |
| 2030 | Near-term endpoint | 36,490 | 22,010 | 37.6% |
| 2035 | Long-term | 28,830 | 29,670 | 50.7% |
| 2040 | Long-term | 21,170 | 37,330 | 63.8% |
| 2045 | Long-term | 13,510 | 44,990 | 76.9% |
| 2050 | Net-zero endpoint | 5,850 | 52,650 | 90.0% |
Trajectory construction: 2019–2030 follows compound 4.2% p.a. on the restated S1+2 base of 58,500 tCO₂e. 2030–2050 follows linear interpolation from the 2030 ceiling (36,490) to the 2050 net-zero endpoint (5,850 = 10% of base). The linear long-term phase is a planning convention — SBTi does not mandate a specific long-term annual rate, only the endpoint. Companies may front-load reductions, structure non-linear pathways, or commit to an earlier net-zero year.
Step 5 — Progress Tracking and the Re-Validation Ratchet
Progress is measured against the trajectory you committed to, not against the endpoint alone. Two distinct calculations matter:
SBTi validates the endpoint, but CDP scoring methodology and CSRD ESRS E1 require annual trajectory disclosure against the committed path. A company that sets a 4.2% target but reduces by only 2% in year 1 is not formally “behind” in SBTi’s validation sense — but will disclose as trailing in CDP and will need to explain the gap in CSRD reporting. Persistent under-performance over multiple years is a flag that may trigger SBTi voluntary re-examination.
Under SBTi v2.0, all validated targets are subject to a mandatory 5-year review cycle. Companies must reassess and, if necessary, raise ambition every five years to remain aligned with the latest SBTi criteria. Outside the cycle, re-validation is required when: (1) company boundary changes significantly (M&A, divestiture, methodology change >5% of inventory); (2) base year is restated; (3) you voluntarily increase ambition (e.g. WB2°C → 1.5°C, or 90% → 95% net-zero). Annual progress disclosure is a separate obligation under CDP and CSRD — not part of SBTi validation.
ACA vs Other SBTi Methods
SBTi maintains five target-setting methodologies. The choice between them is constrained by sector and inventory data availability — not a free preference. Where multiple methods apply, the more stringent trajectory wins.
| Method | Formula type | When mandated/preferred | Key constraint vs ACA |
|---|---|---|---|
| ACA (this page) | Absolute rate × base year | Universal fallback; any sector without SDA | No sector benchmarks needed; most companies qualify |
| SDA (Sectoral Decarbonization) | Physical intensity benchmark | Power, steel, cement, buildings, aviation, shipping, transport | Requires sector-specific activity data (MWh generated, tonnes steel, etc.) |
| FLAG (Forests, Land, Agriculture) | Land-based science | Agriculture, forestry, land use companies | Set alongside ACA, not as a substitute. See FLAG calculator. |
| EIC (Economic Intensity Contraction) | Emissions per unit revenue | High-growth companies in emerging markets (conditional approval) | Less stringent; harder to defend externally; rarely preferred |
| FFIS (Financial Sector) | Portfolio financed emissions | Banks, asset managers, insurers | Different unit (financed tCO₂e per $M invested); uses PCAF measurement |
Yes, within a mixed-method target: you may apply SDA to the electricity-generation or industrial-process portion of your Scope 1, and ACA to the remainder. SBTi guidance permits method mixing at the boundary level. What you cannot do is apply SDA to your whole Scope 1 if you do not have the physical intensity data (production volume in tonnes, generated MWh, etc.) that SDA requires. If both ACA and SDA produce a valid target for the same boundary segment, you must adopt the more stringent of the two.
What the Calculator Handles vs What You Decide
The SBTi Near-Term Target Calculator automates the mechanical steps. This methodology page covers the upstream decisions that the calculator cannot make for you.
- ACA formula computation: (1 − r)n × base year emissions
- Both rate variants (4.2% and 2.5%) calculated simultaneously for comparison
- 40% Scope 3 materiality test from your entered inventory
- Multi-year trajectory table generation (annual ceilings 2026 through 2050)
- Progress ratio calculation against committed trajectory
- Net-zero endpoint scenarios (90% and 95% variants with CDR cost estimate)
- Methodology citation block with SBTi version, GWP basis, calculation date
- Base year selection: which year, and is it the cleanest available?
- Restatement: does your current boundary match your base year boundary? Has any acquisition/divestiture >5% been retroactively reflected?
- Scope boundary: have you run the 40% Scope 3 materiality test on actual base year data?
- Rate selection: 4.2% (1.5°C) or 2.5% (WB2°C)? Match to your public commitment.
- Scope 2 method: market-based or location-based? Must remain consistent base year through target year.
- COVID-19 disclosure: if base year is 2020–2021, have you documented the suppression effect?
- FLAG applicability: if you have material land-sector emissions, you need a parallel FLAG target.
Run the SBTi Readiness Checklist to confirm all six decisions are settled before opening the calculator.
Error Traps — With Calculable Magnitudes
Each error below produces a specific, quantifiable distortion. Magnitudes shown for a 100,000 tCO₂e base year company on an 11-year (2019→2030) trajectory — large enough to assess validation and disclosure risk.
| Error | What happens | Magnitude (100,000 tCO₂e base) | How to avoid |
|---|---|---|---|
| Apply linear reduction instead of compound | Subtract 4.2% × years from base, not (1 − 0.042)n. Common error in spreadsheet models. | Overstates required reduction by 8,576 tCO₂e Linear gives 53,800 ceiling vs compound 62,376. Reports −46.20% instead of −37.62%. |
Always use (1 − r)n. Validate spreadsheet against the calculator before submission. |
| Omit Scope 3 when above the 40% threshold | Near-term target covers only Scopes 1+2 despite Scope 3 being >40% of total. | Target covers only 40% of footprint For a company where S3 = 60%, target is invalid for SBTi validation. |
Run the 40% test on base year data before setting the boundary. Re-run if inventory is restated. |
| Use offsets to meet ACA reduction | Carbon credits counted as equivalent to absolute operational reduction. | Fails SBTi validation outright If 30k of 37.62k required reduction is offsets, real operational reduction is only 7.62k (−7.62%, not −37.62%). |
ACA is a gross-reduction methodology. Offsets do not count toward the target. Permanent CDR is permitted only for residual neutralisation at net-zero level. |
| Use 2020 COVID base year without disclosure | 2020 activity suppression sets an artificially low base; trajectory becomes easier to meet. | Trajectory ~20% lower than true alignment A 20% suppressed base sets the 2030 ceiling 20% lower; SBTi may demand 2019 comparator. |
Use 2019 if available. If 2020/2021 must be used, document the suppression effect and provide a 2019 sense-check in your methodology. |
| Switch Scope 2 method mid-trajectory | Used location-based in base year; switched to market-based to track progress (or vice versa). | Progress reports become non-comparable Method switch can shift apparent Scope 2 by 30–60% for companies with active green procurement. |
Choose one Scope 2 method at base year; apply consistently base year → target year. Document the choice in the methodology statement. |
| Forget to restate base year after M&A | Boundary expands but base year stays at pre-acquisition scope. | Apparent target miss even when meeting trajectory For an acquisition adding 10k tCO₂e, the un-restated 2030 ceiling is 6,238 tCO₂e too low. |
Apply GHG Protocol recalculation policy; restate base year and notify SBTi within 24 months if a validated target is affected. |
| Claim 1.5°C alignment on a WB2°C rate | Methodology statement says “1.5°C-aligned” but 2.5% rate is applied. | Disclosure error, not numerical Greenwashing risk under EU CSRD; potential CDP scoring deduction; SBTi mismatch finding. |
Disclose 4.2% → 1.5°C-aligned; 2.5% → well-below-2°C. Never interchange the labels. |
| Apply ACA to revenue-normalised emissions | The r rate is applied to emissions/revenue intensity instead of absolute emissions. | Zero absolute progress can appear as +9% intensity gain 10% revenue growth + 0% absolute reduction ≈ 9% intensity reduction — invalid as ACA progress. |
ACA works only on absolute tCO₂e. Use EIC if intensity is required, but EIC is conditional on SBTi approval and rarely the better defensible choice. |
Methodology Metadata — For GHG Inventory Documentation
Copy verbatim into your GHG inventory methodology statement for ISO 14064-1 transparency compliance. Adjust the rate selection line based on whether you committed to 1.5°C or WB2°C.
Frequently Asked Questions
The 4.2% annual rate is derived from SBTi’s modelled 1.5°C-aligned global carbon budgets (consistent with IPCC SR1.5 and AR6 mitigation pathways). It represents the minimum compound annual reduction required across Scope 1+2 emissions for a company’s near-term target to be considered 1.5°C-aligned under the SBTi Corporate Net-Zero Standard v2.0. The rate is compound, not linear — over 11 years (2019→2030) it produces a 37.62% total reduction, not 46.20%. Companies in mandated-SDA sectors (power, steel, cement, buildings, aviation, shipping, transport) use sector-specific physical-intensity benchmarks instead; ACA’s 4.2% remains the universal fallback for all other sectors.
For near-term targets: Scope 3 is required if it represents 40% or more of your total Scope 1+2+3 emissions in the base year. Run the test as a calculation, not a judgement: (Scope 3 base year) ÷ (Scope 1 + 2 + 3 base year) × 100. If the result is 40% or above, the near-term target must include Scope 3 and must cover at least 67% of Scope 3 emissions by category. For long-term/net-zero targets: Scope 3 is always required, regardless of share. Net-zero is a full-value-chain commitment with no materiality exception. The 40% rule exists to prevent boundary arbitrage in retail, consumer goods, finance, and other Scope-3-heavy sectors where excluding the value chain renders a target near-meaningless.
No. The Absolute Contraction Approach is a gross absolute emissions reduction methodology. Offsets, avoidance credits, and renewable energy certificates that do not represent actual operational reduction are not permitted toward the ACA reduction requirement. At the net-zero endpoint (2050), the residual 5–10% of base-year emissions must be neutralised — but only with permanent carbon dioxide removal (CDR) such as mineralisation, biochar, or geologic storage with ≥1,000-year permanence. Avoidance offsets (forest protection, REDD+, methane destruction) do not qualify for net-zero neutralisation under SBTi v2.0. RECs and PPAs may count toward Scope 2 if you have committed to market-based accounting at base year and apply it consistently.
SBTi formally validates the target endpoint (e.g. 2030 near-term ceiling), not interim annual milestones. Missing a single year’s trajectory is not a formal SBTi non-compliance finding in isolation. However, two consequences follow: first, CDP scoring methodology and CSRD ESRS E1 require annual progress disclosure against the committed trajectory — trailing the path produces a public disclosure mark, even without an SBTi finding. Second, persistent multi-year under-performance can trigger SBTi voluntary re-examination, particularly during the mandatory 5-year re-validation cycle introduced under SBTi v2.0. Document the gap, explain operational drivers, and disclose a credible recovery plan in your CDP and CSRD filings.
Apply the GHG Protocol recalculation policy: retroactively calculate the acquired entity’s emissions in the base year using the same boundary, methods, and emission factors you applied to your original entity, then add to the original base figure. Re-derive every trajectory ceiling from the restated base. The ACA rate (4.2% or 2.5%) is unchanged — only the absolute base figure moves. If you have a validated SBTi target affected by the restatement, notify SBTi within 24 months. Worked example 3 on this page demonstrates the full restatement: original base 50,000 tCO₂e + 8,500 tCO₂e subsidiary = restated 58,500; new 2030 ceiling 36,490 tCO₂e (was 31,188). The ceiling rose because the boundary grew, not because ambition changed.
Near-term targets use the ACA annual rate (minimum 4.2% p.a. for 1.5°C, or 2.5% p.a. for WB2°C) over a 5–10 year window, covering Scopes 1+2 at minimum (Scope 3 if >40% of total). Net-zero targets are absolute endpoint commitments: 90–95% reduction in Scope 1+2+3 by no later than 2050, with the 5–10% residual neutralised by permanent CDR. The SBTi Corporate Net-Zero Standard requires both, set in alignment with each other — you cannot validate one without the other, and the near-term target must be on a credible trajectory toward the net-zero endpoint. The two targets share a base year and an inventory boundary (when the near-term target includes Scope 3).
ACA is the universal fallback — available to any company in any sector. SDA (Sectoral Decarbonization Approach) is mandated for power generation, steel, cement, buildings, aviation, shipping, and transport sectors, and may be preferred for those companies because it uses sector-specific physical intensity benchmarks. FLAG targets are required alongside ACA (not as substitutes) for companies with material agriculture, forestry, or land use emissions. EIC (Economic Intensity Contraction) is conditionally available for high-growth companies in emerging markets but is rarely the better defensible choice. The constraint: where multiple methods apply, you must adopt whichever produces the more stringent trajectory. You cannot choose a method specifically because it is less demanding.