
Cement & Lime Calcination Emissions

About 60% of a cement plant’s carbon footprint never touches a flame. It is released the moment limestone is heated past 900 °C and its carbonate chemistry breaks apart — CaCO₃ becomes lime and CO₂, an emission fixed by stoichiometry rather than fuel. The remaining 40%, from burning fuel to reach that temperature, lives in an entirely separate ledger.
The chemistry decides the calcination emission before a single kilogram of coal is burned.
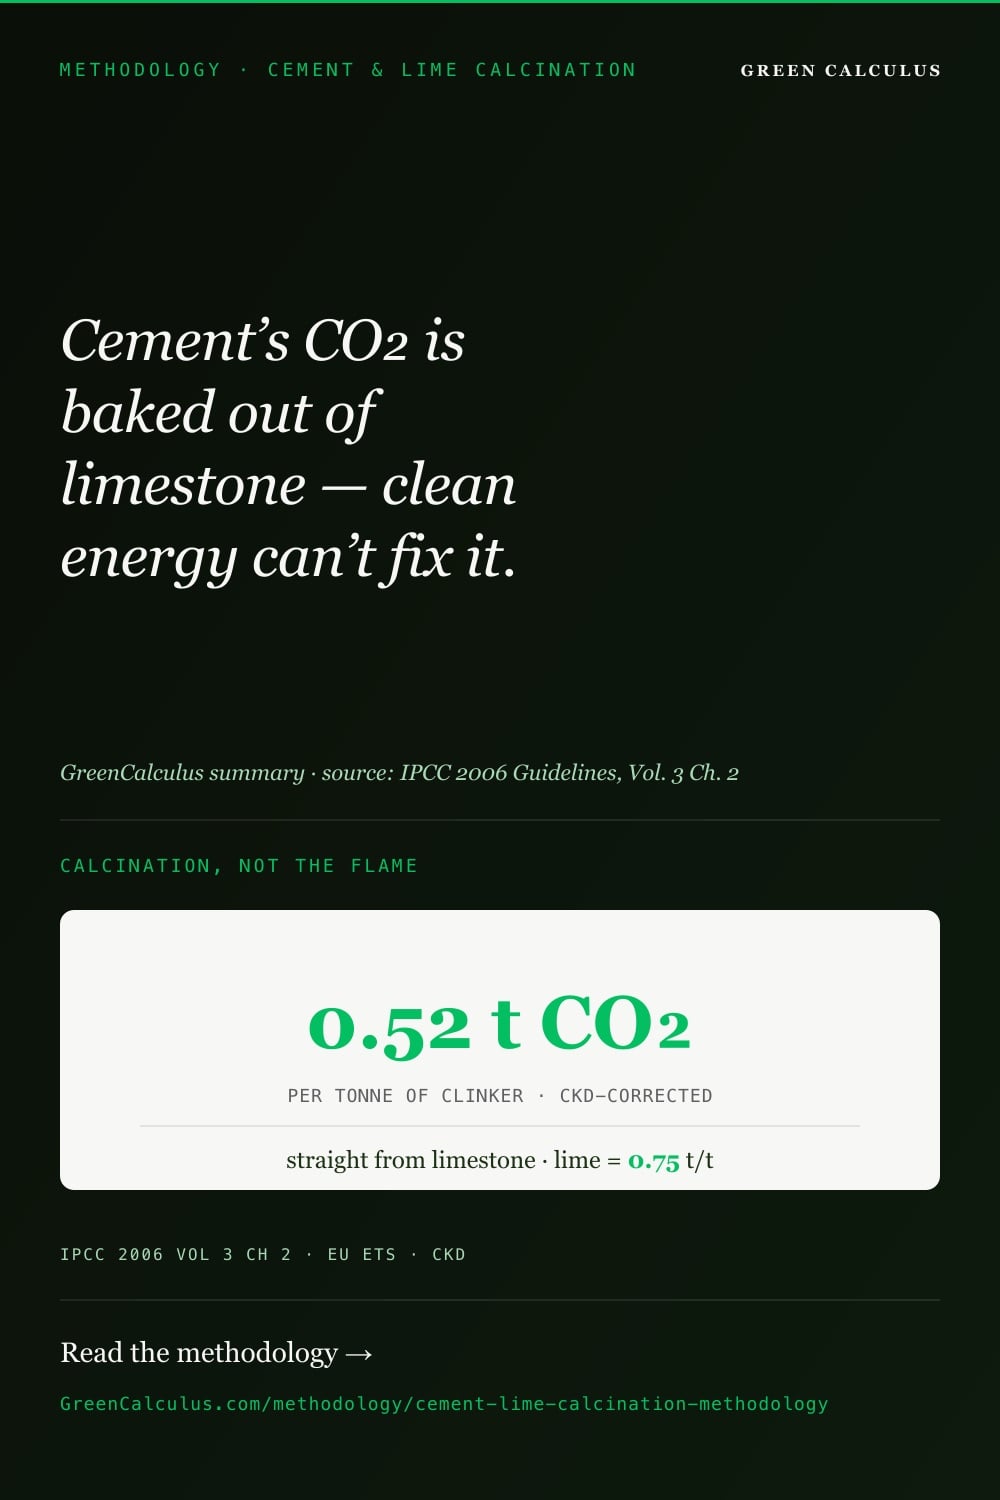
Cement and lime calcination emissions are the CO₂ chemically released when carbonate minerals decompose in the kiln, calculated per IPCC 2006 Vol 3 Ch 2. The Tier 1 clinker factor is 0.52 t CO₂ per tonne of clinker (CKD-corrected); high-calcium quicklime is 0.75 t CO₂ per tonne of lime.
What Counts as a Calcination Process Emission
Cement and lime production both rest on the same chemical reaction: calcination, the thermal decomposition of carbonate minerals. When limestone (calcium carbonate, CaCO₃) is heated in a kiln, it splits into calcium oxide (CaO — the reactive ingredient in both clinker and lime) and carbon dioxide. The CO₂ is locked in the mineral; heating simply releases it.
This is fundamentally different from fuel combustion. A cement kiln also burns large quantities of coal, petroleum coke, or alternative fuels to reach calcination temperature, and that combustion produces its own CO₂ — but it is accounted under the fuel combustion methodology, not here. Calcination CO₂ comes from the raw material chemistry; combustion CO₂ comes from the fuel. Both are Scope 1, but they use different emission factors, different activity data, and different audit evidence — and they must not be double-counted.
This emission is CO₂ only, with a global warming potential of 1 by definition. There are no high-GWP gases here as there are in aluminium smelting, and no methane as there is in steelmaking. The whole methodology is an exercise in getting one well-defined CO₂ stream right: identifying how much carbonate decomposed, and not confusing it with the fuel that supplied the heat.
Calcination CO₂ and kiln-fuel CO₂ are both Scope 1, but they are separate emissions with separate factors. Roughly 60% of clinker’s CO₂ is calcination (process); the remaining ~40% is fuel combustion (energy). Reporting one combined “cement CO₂” number from a single factor obscures the split that every kiln-level audit and every decarbonisation plan depends on.
Provider directory
Now it has to hold up all year.
See who does this work. Every listing names the standards it works to, and paid placements are labelled. Including Attain Zero and Small World Consulting.
Browse 6 carbon accounting & inventory providers →Do this work? A listing is US$390 a year. Get listed →
Cement, Clinker, and Lime — the Products
Two product families come out of calcination, and the methodology treats them separately because their chemistry and their reporting denominators differ.
The clinker-to-cement chain
Cement is not made directly from limestone. Limestone is calcined into clinker (the CaO-rich nodules that carry essentially all the calcination CO₂), and clinker is then ground together with gypsum and, increasingly, with supplementary cementitious materials (SCMs) to make finished cement. This two-step chain is the single most important structural fact in cement accounting, because the calcination emission attaches to the clinker, while the product sold and the headline intensity are usually quoted per tonne of cement.
Ordinary Portland cement has a high clinker fraction — the IPCC default is 0.95 tonnes of clinker per tonne of cement. Masonry cement is far more diluted, with a default clinker fraction of 0.64. Lowering that fraction by substituting SCMs is the dominant lever in cement decarbonisation, covered in §9.
Lime
Lime is calcined limestone in its own right — quicklime (CaO) for steelmaking, water treatment, and construction, with dolomitic and hydraulic variants. Unlike cement there is no clinker intermediate; the calcination factor applies directly per tonne of lime produced, and it differs by lime type because the carbonate chemistry differs (calcitic vs dolomitic). Lime is covered in §10.
The Two Calculation Bases
IPCC offers two ways to quantify calcination CO₂, working from opposite ends of the reaction. They must never be combined in one calculation — they are alternatives, not components.
| Dimension | Clinker-output method | Carbonate-input method |
|---|---|---|
| Works from | The product — clinker produced and its CaO content | The raw material — carbonate minerals consumed |
| Denominator | t CO₂ per t clinker | t CO₂ per t carbonate |
| Factor source | minerals.cement.clinker_* (output EFs) | carbonate.* (stoichiometric ratios) |
| IPCC tier fit | Tier 1 / Tier 2 — the standard company-reporting path | Tier 3 — requires raw-meal carbonate analysis |
| Best when | Clinker tonnage is known and metered (almost all plants) | Detailed raw-material carbonate assays exist |
The clinker-output factors are per tonne of clinker; the carbonate ratios are per tonne of carbonate mineral. They are two routes to the same number, not two factors to chain. The methodology’s internal bridge — stoichiometric CaO ratio × clinker CaO fraction × CKD correction — reconciles them exactly (§7), which is precisely why you pick one basis and stay on it rather than mixing rows from both.
Governing Standards and Scope Mapping
method
Defines the clinker-output method (Eq 2.4), the carbonate-input method (stoichiometric ratios, Table 2.1), the lime factors (Table 2.4, Eq 2.8), the CKD correction, and the clinker CaO fraction. Source of every minerals.cement.*, minerals.lime.*, and carbonate.* row.
boundary
Tier Selection
E = clinker × 0.52. The CKD correction is already embedded in the default factor.
Cement kiln dust (CKD) leaves the kiln partially calcined and is not always fully returned to the process. The CO₂ released from that lost, calcined dust is real and must be counted. IPCC handles it with a correction factor — the default is 1.02, with an observed range up to about 1.20 for kilns that discard heavily calcined dust. At Tier 1 it is already baked into the 0.52 default factor; at Tier 2 you apply it to the pre-CKD base of 0.51. Omitting it understates emissions by roughly 2% at the default and more where dust loss is high — small per tonne, material across a multi-megatonne plant.
Emission Factors
Every factor below renders live from the MasterBrain. The cement and lime rows are IPCC 2006 Vol 3 Ch 2 defaults; the carbonate rows are exact stoichiometric CO₂ ratios. All are tagged scope1, source IPCC_2006_VOL3.
Cement — clinker-output method
| Parameter | MasterBrain key | Value | Unit | IPCC ref |
|---|---|---|---|---|
| Clinker EF — default (CKD-corrected) | minerals.cement.clinker_default | 0.52 | t CO₂ / t clinker | Eq 2.4, Tier 1 |
| Clinker EF — base (pre-CKD) | minerals.cement.clinker_pre_ckd | 0.51 | t CO₂ / t clinker | Eq 2.4, Tier 2 base |
| CKD correction factor | minerals.cement.ckd_correction_default | 1.02 | dimensionless | §2.2.1.2 |
| Clinker CaO fraction (default) | minerals.cement.cao_default_fraction | 0.65 | t CaO / t clinker | §2.2.1.2 (range 0.60–0.67) |
| Clinker fraction — Portland (default) | minerals.cement.clinker_fraction_portland_default | 0.95 | t clinker / t cement | Table 2.2 |
| Clinker fraction — masonry | minerals.cement.clinker_fraction_masonry | 0.64 | t clinker / t cement | Table 2.2 |
| MgO correction (Tier 2 only) | minerals.cement.mgo_per_pct_correction | 0.011 | t CO₂/t clinker per 1% MgO | §2.2.1.2 |
Lime — direct per-tonne factors
| Lime type | MasterBrain key | Value | Unit | IPCC ref |
|---|---|---|---|---|
| Composite default (85/15 blend) | minerals.lime.composite_default | 0.75 | t CO₂ / t lime | Eq 2.8, Tier 1 |
| High-calcium quicklime | minerals.lime.high_calcium | 0.75 | t CO₂ / t lime | Table 2.4 |
| Dolomitic — developed-tech (0.95 content) | minerals.lime.dolomitic_developed | 0.86 | t CO₂ / t lime | Table 2.4 |
| Dolomitic — developing-tech (0.85 content) | minerals.lime.dolomitic_developing | 0.77 | t CO₂ / t lime | Table 2.4 |
| Hydraulic lime | minerals.lime.hydraulic | 0.59 | t CO₂ / t lime | Table 2.4 — apply only if production confirmed |
| Hydrated-lime correction | minerals.lime.hydrated_correction_default | 0.97 | dimensionless | §2.3.1.3 — apply only if production confirmed |
The composite default uses the dolomitic developing-technology value (0.77). The developed-technology dolomitic row (0.86) is the deliberate alternative for higher-conversion kilns — pick by technology. Hydraulic and hydrated-lime factors default to zero applied unless production of those specific products is positively confirmed (§2.3.1.3).
Carbonate stoichiometric ratios — carbonate-input method
| Carbonate mineral | MasterBrain key | Stoichiometric ratio | Unit |
|---|---|---|---|
| Calcite (CaCO₃) | carbonate.calcite | 0.43971 | t CO₂ / t carbonate |
| Dolomite (CaMg(CO₃)₂) | carbonate.dolomite | 0.47732 | t CO₂ / t carbonate |
| Magnesite (MgCO₃) | carbonate.magnesite | 0.52197 | t CO₂ / t carbonate |
| Rhodochrosite (MnCO₃) | carbonate.rhodochrosite | 0.38286 | t CO₂ / t carbonate |
| Siderite (FeCO₃) | carbonate.siderite | 0.37987 | t CO₂ / t carbonate |
| Sodium carbonate / soda ash (Na₂CO₃) | carbonate.sodium_carbonate | 0.41492 | t CO₂ / t carbonate |
All ratios are stoichiometric, assuming 100% calcination (Table 2.1). Soda ash counts only where mined as a natural carbonate mineral — the hydroxide-carbonation (Solvay) production route is not a net carbonate-decomposition CO₂ source (§2.4 / §2.5.1).
Glass and ceramics are also Vol 3 Ch 2 mineral-industry processes but sit outside this page’s cement-and-lime scope. Glass carries its own Tier 1 default and Table 2.6 composition factors; ceramics has no dedicated emission factor in Ch 2 at all — it routes through the carbonate ratios above applied to the clay’s carbonate content with a method-specific loss factor. Do not infer a missing “ceramics EF”; there isn’t one, by design.
Clinker-Output Method and the CKD Correction
The clinker-output method is the standard company-reporting path. At Tier 1 it is a single multiplication; the CKD correction is already embedded in the default factor.
At Tier 2 the EF is built up from measured clinker chemistry, then the CKD correction is applied separately:
The Tier 1 default is not an independent number — it is the Tier 2 build-up evaluated at the defaults, and the rows prove it. The stoichiometric CaO ratio 0.785 times the default CaO fraction 0.65 gives 0.51 — exactly the pre-CKD base 0.51. Apply the CKD correction 1.02 and you reach 0.52, the published default 0.52. That internal consistency is why you anchor on one basis and trust the chain, rather than mixing rows.
Carbonate-Input Method
The carbonate-input method (Tier 3) works from the raw material. Each carbonate mineral in the kiln feed is multiplied by its stoichiometric CO₂ ratio and a calcination fraction (the proportion actually decomposed, usually near 1.0).
The carbonate-input method reconciles to the clinker-output method to within rounding: a plant whose clinker carries the default 0.65 CaO fraction consumes calcite at the stoichiometric proportion that, run through the calcite ratio, returns the same pre-CKD CO₂ as the output method. The two are checks on each other, which is the practical value of carrying both in the inventory.
Clinker-to-Cement Ratio and SCM Substitution
The calcination emission attaches to clinker. The product sold is cement. The link between them — the clinker-to-cement ratio — is the most powerful and most misunderstood quantity in cement carbon accounting, because lowering it reduces the emission per tonne of cement without changing the emission per tonne of clinker at all.
Substituting clinker with supplementary cementitious materials — ground granulated blast-furnace slag (GGBS), fly ash, calcined clay (as in LC3), or limestone filler — dilutes the clinker fraction and pulls the cement intensity down in direct proportion. The bar chart below shows the effect for three illustrative cement types at the fixed 0.52 clinker factor.
A plant that substitutes its way from CEM I to CEM III halves its cement process intensity — yet its clinker process factor is unchanged at 0.52, because the chemistry of calcination does not move. This is the routine source of confusion in cement targets: a producer can report falling cement-CO₂ intensity through substitution while its clinker emissions per tonne are flat. Always state which denominator a cement intensity figure uses, and never apply a clinker factor (0.52) to a cement tonnage — that overstates the emission by the inverse of the clinker fraction.
Lime Calcination
Lime calcination uses the same chemistry but applies the factor directly per tonne of lime, with no clinker intermediate. The factor differs by lime type because the carbonate source differs.
The composite default of 0.75 tonnes of CO₂ per tonne of lime represents an 85/15 high-calcium/dolomitic blend and is the screening value where lime type is unknown. Where the production split is known, the type-specific factors give a more accurate inventory. Dolomitic lime carries a higher factor because it decomposes both calcium and magnesium carbonate; the developed-technology dolomitic value (0.86) reflects more complete conversion than the developing-technology value (0.77) the composite uses. Hydrated lime applies a correction of 0.97 only where hydrated-lime production is positively confirmed.
Worked Example — Integrated Cement Plant
A complete worked example computed end-to-end. All values hardcoded — this is an audit record at the snapshot date of this methodology revision, anchored on the clinker-output basis (the standard company-reporting path) so the chain is coherent on a single denominator.
Reporting year: 2026
Clinker produced: 2,000,000 t/yr
Product: ordinary Portland cement (CEM I), clinker fraction 0.95
Basis: clinker-output, Tier 1 (CKD-corrected default) Clinker EF 0.52 t CO₂/t clinker (minerals.cement.clinker_default, CKD-corrected). Portland clinker fraction 0.95 (minerals.cement.clinker_fraction_portland_default). Calcination CO₂ only — kiln-fuel combustion CO₂ is accounted separately under the fuel methodology and is NOT included here.
CBAM and the Clinker Boundary
Cement is a covered sector under the EU Carbon Border Adjustment Mechanism, and the MasterBrain holds CBAM default factors as a separate, outside-scopes keyspace keyed by country and Combined Nomenclature code. These are embedded-emissions declaration values, not Scope 1 process factors.
| Good (CN code) | Country | CBAM default | Scope tag |
|---|---|---|---|
| Grey cement clinker (2523 10 00) | India | 1.39 tCO₂e/t | Outside scopes |
| Grey cement clinker (2523 10 00) | Korea | 0.88 tCO₂e/t | Outside scopes |
| Aluminous cement (2523 30 00) | Türkiye | 1.82 tCO₂e/t | Outside scopes |
| Calcined clay (2507 00 80) | Catch-all (oth) | 0.21 tCO₂e/t | Outside scopes |
Source CBAM_DEFAULT_2025 (Commission Implementing Regulation (EU) 2025/2621). Importer uses the catch-all country (oth) where the production country is not separately listed.
The CBAM grey-clinker default embeds direct emissions (calcination + kiln fuel) of the imported good, and country values vary with the producing region’s fuel and process mix. They are not the same quantity as the IPCC Scope 1 calcination factor of 0.52, which is calcination only. Using a CBAM default as a Scope 1 process factor pulls fuel combustion into the process ledger; using the calcination-only factor as a CBAM declaration omits the fuel emissions the importer must account for. For the import-side workflow, see the EU CBAM methodology.
Double-Counting and Boundary Traps
- Calcination vs kiln-fuel combustion. A kiln’s CO₂ has two origins — the raw-material carbonate (calcination, this page) and the fuel burned to heat it (combustion, the fuel methodology). Both are Scope 1 but use different factors. Counting clinker tonnage against the calcination factor and the fuel against a combustion factor is correct; applying a single all-in factor to clinker and then also counting the fuel double-counts the fuel.
- Clinker vs cement denominator. The calcination factor is per tonne of clinker. Applying it to cement tonnage overstates emissions by the inverse of the clinker fraction (for Portland, by about 5%). Always confirm whether a tonnage is clinker or cement before applying a factor.
- Omitting the CKD correction. Cement kiln dust leaves the kiln calcined; if it is not returned, its CO₂ must still be counted. Omitting the correction understates emissions by ~2% at the default and more where dust loss is high.
- Counting non-carbonate CaO as calcination. Some CaO entering clinker comes from non-carbonate sources (e.g. certain slags or fly ash in the raw mix). That CaO carries no calcination CO₂; a Tier 2/3 inventory must subtract it, or it overstates emissions.
- Soda-ash production route. The sodium-carbonate stoichiometric ratio counts only where soda ash is mined as a natural carbonate. Soda ash made by the synthetic (Solvay) route is not a net carbonate-decomposition source and must not be counted here.
Report cement as two explicit Scope 1 lines — calcination process CO₂ and kiln-fuel combustion CO₂ — plus Scope 2 electricity. The split is exactly what a verifier checks and what a decarbonisation plan acts on (clinker substitution attacks the calcination line; alternative fuels attack the combustion line). The ISO 14064-1 inventory standard expects this structure for a facility with materially different emission types.
Data Quality, Uncertainty, and Verification
| Tier | Method | Typical uncertainty | When acceptable |
|---|---|---|---|
| Tier 1 | Default clinker / lime factor × production | ±2–5% (the chemistry is well-constrained) | Screening; first inventory; immaterial sources |
| Tier 2 | Measured clinker CaO + quantified CKD + MgO/non-carbonate adjustments | ±1–2% | Material producers; routine post-year-1 inventory |
| Tier 3 | Carbonate-input method with raw-meal mineral assays | ±1% | EU ETS verified reporting; reasonable-assurance audits |
Calcination is one of the most tightly-constrained process emissions in any inventory because it is governed by stoichiometry — the uncertainty is dominated by how well clinker CaO content, CKD loss, and non-carbonate CaO are characterised, not by the factor itself. Verification under ISO 14064-3 focuses on clinker production metering, the CaO and CKD data behind any Tier 2/3 figure, the clinker-vs-cement denominator, and the boundary that keeps kiln-fuel combustion in a separate ledger. The ISO 14064-1 inventory methodology sets the reporting structure these audits test against.
Unlike aluminium PFCs (where the factor itself is uncertain) or steel (where the carbon balance is complex), cement calcination has a near-exact factor — the uncertainty lives almost entirely in the activity data and the corrections. The highest-value data investments are accurate clinker production metering, a clinker CaO assay programme, and honest CKD accounting. A plant that meters clinker well and characterises its dust is most of the way to a Tier 2 inventory.
What the Calculator Handles vs What You Decide
Calculator handles
Clinker × default or CaO-derived EF; CKD correction (embedded at Tier 1, applied separately at Tier 2); carbonate-input summation across minerals; clinker-to-cement conversion via the clinker fraction; lime by type; the internal bridge check; and the calcination/cement-intensity outputs with audit trail.
You decide
Which basis (clinker-output vs carbonate-input); the clinker fraction (Portland 0.95, masonry 0.64, or a measured blended value); whether clinker CaO is default or measured; the CKD loss for your kiln; the dolomitic developed/developing axis for lime; the soda-ash production-route question; and that kiln-fuel combustion is booked to the separate fuel ledger, not here.
Error Traps with Calculable Magnitudes
Each error below produces a specific, quantifiable distortion. Magnitudes are shown against CemCo’s 2,000,000 t/yr clinker plant (§11), clinker-output basis.
| Error | What happens | Magnitude (CemCo, 2 Mt clinker/yr) | How to avoid |
|---|---|---|---|
| Apply clinker factor to cement tonnage | Multiply 0.52 by cement tonnage (2,105,263 t) instead of clinker tonnage. | Overstates by ~54,700 t CO₂ (clinker fraction inverse, ~5% for Portland). | Apply 0.52 to clinker; convert to cement via the clinker fraction only for intensity. |
| Omit the CKD correction | Use the pre-CKD base 0.51 instead of the CKD-corrected 0.52. | Understates by 20,000 t CO₂ (~1.92%); more where dust loss is high. | Use clinker_default (0.52) at Tier 1; apply the correction to the base at Tier 2. |
| Double-count kiln fuel | Use an all-in clinker factor that includes fuel, then also count the fuel under combustion. | Adds the ~40% fuel term twice — on the order of 0.4+ Mt CO₂. | Keep calcination (0.52) and fuel combustion in separate Scope 1 ledgers. |
| Multiply carbonate ratio by clinker EF | Chain a carbonate.* stoichiometric ratio with a minerals.cement clinker factor. | Unit-incoherent — different denominators (t carbonate vs t clinker). | Pick one basis. The two methods reconcile but are not factors to multiply together. |
| Confuse clinker and cement intensity in targets | Report falling cement-CO₂ intensity (from substitution) as if clinker emissions fell. | Cement intensity can halve (0.494→0.208) while clinker emissions are unchanged. | State the denominator explicitly; track clinker and cement intensity separately. |
| Count Solvay-route soda ash | Apply the sodium-carbonate ratio to synthetically-produced soda ash. | Counts CO₂ that is not a net carbonate-decomposition emission. | Apply carbonate.sodium_carbonate only to mined natural carbonate (§2.4/§2.5.1). |
Methodology Metadata — for GHG Inventory Documentation
Copy into your GHG inventory methodology statement for ISO 14064-1 transparency compliance.
Dataset — the full factor set referenced on this page, versioned with source provenance and downloadable as CSV with a citable Zenodo DOI, is published as the IPCC industrial-process (IPPU) emission factors dataset.
Frequently Asked Questions
Calcination is the thermal decomposition of carbonate minerals. When limestone (CaCO₃) is heated past about 900 °C in a kiln, it breaks into calcium oxide (CaO — the reactive ingredient in clinker and lime) and carbon dioxide. The CO₂ was chemically locked in the mineral; heating releases it. For every 100 kg of pure calcium carbonate, 44 kg of CO₂ is released and 56 kg of CaO remains. This is a process emission fixed by chemistry, entirely separate from the CO₂ produced by burning fuel to heat the kiln.
No. A cement kiln emits CO₂ from two distinct sources: calcination (the raw-material carbonate decomposing) and combustion (the coal, petroleum coke, or alternative fuel burned to reach temperature). Both are Scope 1, but they use different emission factors and are accounted under different methodologies — calcination here, fuel under the combustion methodology. Roughly 60% of clinker’s CO₂ is calcination and 40% is fuel. They must be reported separately and never double-counted.
Because the calcination emission attaches to the clinker, not the finished cement. Cement is clinker ground with gypsum and supplementary cementitious materials (GGBS, fly ash, calcined clay, limestone filler). Those SCMs carry little or no calcination CO₂, so adding them dilutes the clinker fraction and lowers the emission per tonne of cement. The emission per tonne of clinker is unchanged — the chemistry of calcination does not move. A plant can halve its cement-CO₂ intensity (from CEM I at 0.494 to CEM III at 0.208 t CO₂/t cement) through substitution alone while its clinker factor stays at 0.52. This is the dominant lever in near-term cement decarbonisation.
Use the clinker-output method (clinker tonnage × clinker factor) for most company reporting — almost every plant meters clinker production, and it is the Tier 1/Tier 2 path. Use the carbonate-input method (carbonate mineral consumed × stoichiometric ratio) only at Tier 3, where you have detailed raw-meal carbonate assays. The two reconcile to within rounding — they are alternative routes to the same number, not two factors to multiply together. Pick one basis and stay on it; never multiply a carbonate ratio by a clinker factor.
Cement kiln dust (CKD) is fine material that leaves the kiln partially calcined. Where it is not fully returned to the process, the CO₂ released from its calcined fraction is a real emission that must be counted. IPCC handles this with a correction factor — the default is 1.02, meaning a 2% uplift, rising toward 1.20 for kilns that discard heavily calcined dust. At Tier 1 the correction is already embedded in the default clinker factor of 0.52; at Tier 2 you apply it to the pre-CKD base of 0.51. Omitting it understates emissions, so yes — it is mandatory.
Lime uses the same calcination chemistry but has no clinker intermediate — the factor applies directly per tonne of lime produced. It varies by lime type: high-calcium quicklime is 0.75 t CO₂/t lime, dolomitic lime is higher (0.77–0.86, because it decomposes both calcium and magnesium carbonate), and hydraulic lime is lower at 0.59. A composite default of 0.75 (an 85/15 high-calcium/dolomitic blend) is used where the production split is unknown. Hydrated-lime and hydraulic-lime adjustments apply only where production of those specific products is positively confirmed.