
Personal Carbon Footprint Calculator | Household CO2e — Home, Travel & Diet
Estimate your annual household carbon footprint across home energy, travel, and diet using DEFRA 2026 emission factors, Ember grid data, and peer-reviewed dietary figures — then see how you compare to a Paris-aligned target.
What the calculator does. It converts everyday activity data — the kilowatt-hours on your energy bill, the kilometres you drive, the flights you take, and the kind of diet you eat — into carbon dioxide equivalent (CO2e), the common unit that lets you add methane, nitrous oxide, and CO2 together on one scale. Each activity is multiplied by a published emission factor, and the results are summed into an annual household total and a per-person total.
The core equation. Every line follows the same shape: activity data × emission factor = emissions. Drive 8,000 km in an average diesel car at 0.17265 kg CO2e per km and you have emitted about 1,381 kg CO2e. The calculator applies this to each input and keeps the categories separate so you can see where your footprint concentrates.
Where the factors come from. Home energy and travel factors are the UK Government’s DEFRA 2026 conversion factors (the DESNZ GHG Conversion Factors set, published June 2026). Grid electricity uses per-country location-based factors — for the UK, 0.131 kg CO2e per kWh. Diet figures are drawn from Scarborough et al. 2023 (Nature Food), a whole-diet lifecycle study of UK eating patterns. Home-energy typical-consumption defaults follow Ofgem’s TDCV benchmark. Every factor in the calculator carries a “Cite this factor” control that names its source and vintage.
GWP basis. All figures use IPCC AR5 global warming potentials over a 100-year horizon — the basis DEFRA uses for its conversion factors, and the same basis the Scarborough diet figures were compiled on. Because every input shares one GWP basis, the totals never mix accounting conventions.
What this is and isn’t. This is a screening estimate for individuals and households, not a corporate greenhouse-gas inventory. It is designed to show you the shape of your footprint and where reduction effort pays off — not to produce an audit-grade number. Consumption of goods and services beyond the modelled categories is discussed in the article below but is not summed into the headline total.
Fill in the categories that apply — home electricity and gas open by default. Enter metered kWh, or estimate from your home-use profile. Each source shows its own subtotal, and the result updates live.
Audit mode adds the full per-line calculation table — every factor key, source and figure.
Enter your home energy use and household size to calculate
Add travel, flights, diet and spending for a full per-person footprint. A category split, benchmark gauge, confidence rating, audit trail and export appear instantly.
This is a transparent GreenCalculus screening aid for estimating a household’s operational carbon footprint per person. Emission factors are resolved live from the GreenCalculus MasterBrain — grid electricity per country, and gas, heating fuels, water, cars, public transport and flights on DEFRA 2026 (UK) factors, with Ofgem typical-consumption values for home-energy estimates and an AR5 GWP-100 basis. Flight factors include an aviation radiative-forcing uplift when the toggle is on. Electric-car emissions are derived from your grid factor. Every activity line is source-stamped and citable. It is not a certification, not an offset, and not a substitute for a national inventory. Outside the UK, non-electricity factors apply as a UK proxy — substitute local factors for a country-specific figure.
Most personal carbon calculators hand you a single number and no way to check it. You answer a few questions, a needle swings, and you are told you emit “8 tonnes” — with no factor named, no source shown, and no sense of which of your habits actually drove the figure.
A footprint you can’t interrogate is a footprint you can’t act on.
Your personal carbon footprint is the annual CO2e from your home energy, travel, and diet, found by multiplying each activity by a published emission factor. A UK average is roughly 7 tonnes per person; a Paris-aligned target is about 2.5 tonnes by 2030.

What a personal carbon footprint actually measures
A personal carbon footprint is the total quantity of greenhouse gases your activities release into the atmosphere over a year, expressed as carbon dioxide equivalent. The “equivalent” part matters: methane and nitrous oxide are far more potent than CO2 per tonne, so they are converted onto a common CO2 scale using global warming potentials before anything is added up.
For an individual or household, that total is dominated by a small number of categories. This calculator models the three that carry the most weight for most people, and treats a fourth as context rather than a summed line.
The big buckets
Home energy
The gas, electricity, and other fuels you burn or buy to heat, light, and power your home. In a UK household, heating fuel is usually the single largest home-energy line — gas carries roughly forty per cent more emissions per unit of energy than today’s cleaner electricity grid.
Travel
Car kilometres, flights, and public transport. Flights are the category where a single decision — one long-haul return trip — can rival an entire year of another category, which is why they are modelled explicitly rather than folded into a vague “transport” slider.
Diet
The whole-diet footprint of what you eat and drink across a year, from a high-meat pattern down to a vegan one. Diet is modelled from a peer-reviewed lifecycle study rather than a food-by-food tally, so the figure reflects real dietary patterns rather than a shopping list.
Goods & services (context)
Everything else you buy — clothing, electronics, furniture, entertainment, financial services. This is real and often substantial, but it is the hardest category to estimate without detailed spending data, so the article treats it as context rather than a headline number.
What this calculator includes — and what it leaves out
The headline total sums home energy, travel, and diet. It deliberately does not attempt a spend-based estimate of consumed goods and services, because doing that credibly needs household expenditure data the tool does not ask for, and a rough guess there would add more noise than signal. The honest framing is that this is a screening estimate for the categories that dominate most footprints and are most within an individual’s control — not a complete consumption-based inventory.
A personal footprint and a national or corporate inventory are different instruments. A company inventory follows the GHG Protocol’s scope structure and aims for audit-grade completeness. A personal footprint is a decision tool — its job is to show you the shape of your emissions and where change pays off, not to survive third-party assurance. Judge it on whether it helps you act, not on whether it captures every gram.
Footprint and system change are not opposites
A fair objection to personal footprints is that individual choices are small against the structural drivers of emissions — the electricity grid, the built environment, aviation, industrial agriculture. That is true, and it is not a reason to dismiss the number. The two operate at different levels. Knowing your footprint tells you where your own leverage sits; it does not claim that individual action substitutes for policy and infrastructure. The most useful way to read your result is as a map of personal leverage inside a system that also has to change — the calculator informs your choices without pretending they carry the whole burden.
How the calculation works
Every line in the calculator reduces to one multiplication, repeated across your inputs and summed:
Emissions (kg CO2e) = Activity data × Emission factor
Activity data is the thing you did in its natural unit — kilowatt-hours of electricity, kilometres driven, passenger-kilometres flown, a year of a particular diet. The emission factor is the published figure for how much CO2e each unit of that activity releases. The calculator holds the factors so you only enter the activity.
Where each factor comes from
| Category | What you enter | Emission factor (AR5 GWP-100) | Source |
|---|---|---|---|
| Home electricity | kWh per year | 0.131 kg CO2e / kWh | DEFRA 2026 (UK grid, location-based) |
| Home gas | kWh per year | 0.18231 kg CO2e / kWh | DEFRA 2026 (natural gas) |
| Car | km per year | 0.17265 kg CO2e / km | DEFRA 2026 (average car, diesel) |
| Flights (long-haul economy) | passenger-km per year | 0.11704 kg CO2e / pax-km | DEFRA 2026 (with radiative-forcing uplift) |
| Diet (mixed / average) | diet type × people | 2,733.85 kg CO2e / person / yr | Scarborough et al. 2023 (Nature Food) |
The electricity figure deserves a note. The UK grid factor fell sharply in the 2026 DEFRA release — from 0.177 to 0.131 kg CO2e per kWh — reflecting a cleaner 2024 generation mix with more wind and less coal and gas. That single change means home electricity now carries noticeably less weight in a UK footprint than it did even a year ago, while gas heating, unchanged, has become relatively more dominant. If you want to understand this number in depth, see the electricity emission factor glossary entry and the underlying grid electricity factor data.
Why flights carry a radiative-forcing uplift
Aviation emissions do more warming than their CO2 alone would suggest, because contrails and high-altitude nitrogen-oxide effects add to the impact. DEFRA publishes flight factors both with and without this radiative-forcing uplift; this calculator applies the with-uplift figures by default, which is the more complete and more conservative choice for a personal footprint. That is why a passenger-kilometre of long-haul flying shows as 0.11704 kg CO2e rather than the lower CO2-only number.
One consistent GWP basis
Adding methane and nitrous oxide to CO2 requires a global warming potential for each gas — a multiplier that expresses its warming effect relative to CO2 over a chosen time horizon. This calculator uses IPCC AR5 values over 100 years throughout, because that is the basis DEFRA’s conversion factors are built on and the basis the diet study used. Mixing GWP bases inside one total is a common and subtle error; keeping to a single basis avoids it. The global warming potential glossary entry explains the concept, and the GWP value tables show how the numbers differ between assessment reports.
The average footprint, in context
A footprint number means little on its own. Six tonnes is only meaningful once you know what an average looks like and what a sustainable level would be. The calculator’s benchmark gauge places your result against three reference points, shown below.
| Reference point | tCO2e / person / year | Source |
|---|---|---|
| 1.5 °C-aligned personal budget (2030) | 2.5 | IGES / Aalto — 1.5-Degree Lifestyles (2019/2021), 2030 per-capita target |
| Global average | 4.7 | Global Carbon Project / Our World in Data — per-capita CO2 (2022) |
| UK average | 7.0 | DEFRA — UK consumption-based GHG per capita |
These three figures are published on slightly different accounting bases: the 2.5-tonne budget is an all-greenhouse-gas lifestyle footprint, the global average is CO2-focused, and the UK average is consumption-based greenhouse gas per capita. Treat the gauge as a directional comparison — roughly where you sit against a Paris-aligned target and typical national footprints — not a strict like-for-like ranking. The point is the order of magnitude of the gap, not the second decimal place.
The gap that matters
The distance between the UK average of 7 tonnes and the 2.5-tonne 2030 budget is the whole story of personal decarbonisation: a typical UK footprint is roughly three times a Paris-aligned level. That gap does not close through marginal tweaks. It closes through the small number of high-impact changes covered later in this article — how you heat your home, how much you fly, and what you eat — because those are the categories large enough to move a footprint by tonnes rather than kilograms.
Why “average” can mislead
An average hides an enormous spread. Personal footprints scale steeply with income and consumption: the highest-emitting tenth of the population can emit several times the national average, largely through flying, larger homes, and higher overall spending. So “below average” is not the same as “sustainable” — the average itself sits well above a Paris-aligned level. Your own result is more useful than any average, because it reflects your actual choices rather than a population midpoint that no real household matches.
Your footprint, category by category
Each category behaves differently — different factors, different units, different levers. Understanding what drives each one is what turns a number into a plan.
Home energy
Home energy splits into two very different lines. Heating fuel — usually gas in the UK — is combustion: burning it releases CO2 directly, at 0.18231 kg CO2e per kWh, and for most homes it is the largest single home-energy contributor because heating demand dwarfs electrical demand over a year. Electricity is now much cleaner per unit at 0.131 kg CO2e per kWh, so the same kilowatt-hour of electricity carries less than three-quarters the emissions of a kilowatt-hour of gas. The practical implication is that the biggest home-energy win is usually reducing heating demand or switching the heat source, not shaving electrical use. The heat pump vs gas boiler calculator models that switch directly.
Travel
Car travel scales linearly with distance and depends heavily on the vehicle: an average car sits near 0.173 kg CO2e per km, but an electric vehicle on the current UK grid is a fraction of that, and a large SUV considerably more. If you are weighing a vehicle change, the EV vs petrol lifecycle calculator compares them over the whole life of the car, not just the tailpipe. For journeys where you have a choice of mode, the train vs plane vs car calculator shows how large the differences are — often an order of magnitude between rail and air on the same route.
Diet
Diet is modelled from whole-diet lifecycle figures rather than a food-by-food tally. The Scarborough study measured the greenhouse-gas footprint of real UK dietary patterns, from high-meat through to vegan, capturing all food and drink across the full supply chain. The spread is large: a high-meat diet is roughly four times the footprint of a vegan one per person per year. That makes diet one of the few categories where a sustained change in pattern — not a single purchase — reliably moves a footprint by a tonne or more.
Goods, services, and everything else
Beyond the three modelled categories sits everything you buy and use: clothing, electronics, appliances, furniture, leisure, and services. For many households this is a meaningful share of the true total, but estimating it well requires spending data and spend-based factors that this tool does not collect. Rather than bury a weak guess inside the headline, the calculator leaves it out and names it here. If you want to make an abstract tonne feel concrete, the CO2 equivalencies calculator translates it into familiar terms, and the CO2-to-trees calculator expresses it as sequestration.
Worked example — a UK household of two
This example reproduces exactly in the calculator: enter the same inputs and you get the same result. It is a two-person UK household with a gas-heated home, one average car, one long-haul return flight between them, and a mixed (average) diet. All figures are annual.
| Category | Activity data | Emission factor | Emissions |
|---|---|---|---|
| Home electricity | 2,700 kWh | × 0.131 | 353.7 kg |
| Home gas | 11,500 kWh | × 0.18231 | 2,096.6 kg |
| Car (average diesel) | 8,000 km | × 0.17265 | 1,381.2 kg |
| Flights (long-haul economy, with RF) | 11,000 pax-km | × 0.11704 | 1,287.4 kg |
| Diet (mixed, 2 people) | 2,733.85 × 2 | per person/yr | 5,467.7 kg |
| Household total | 10,586.6 kg |
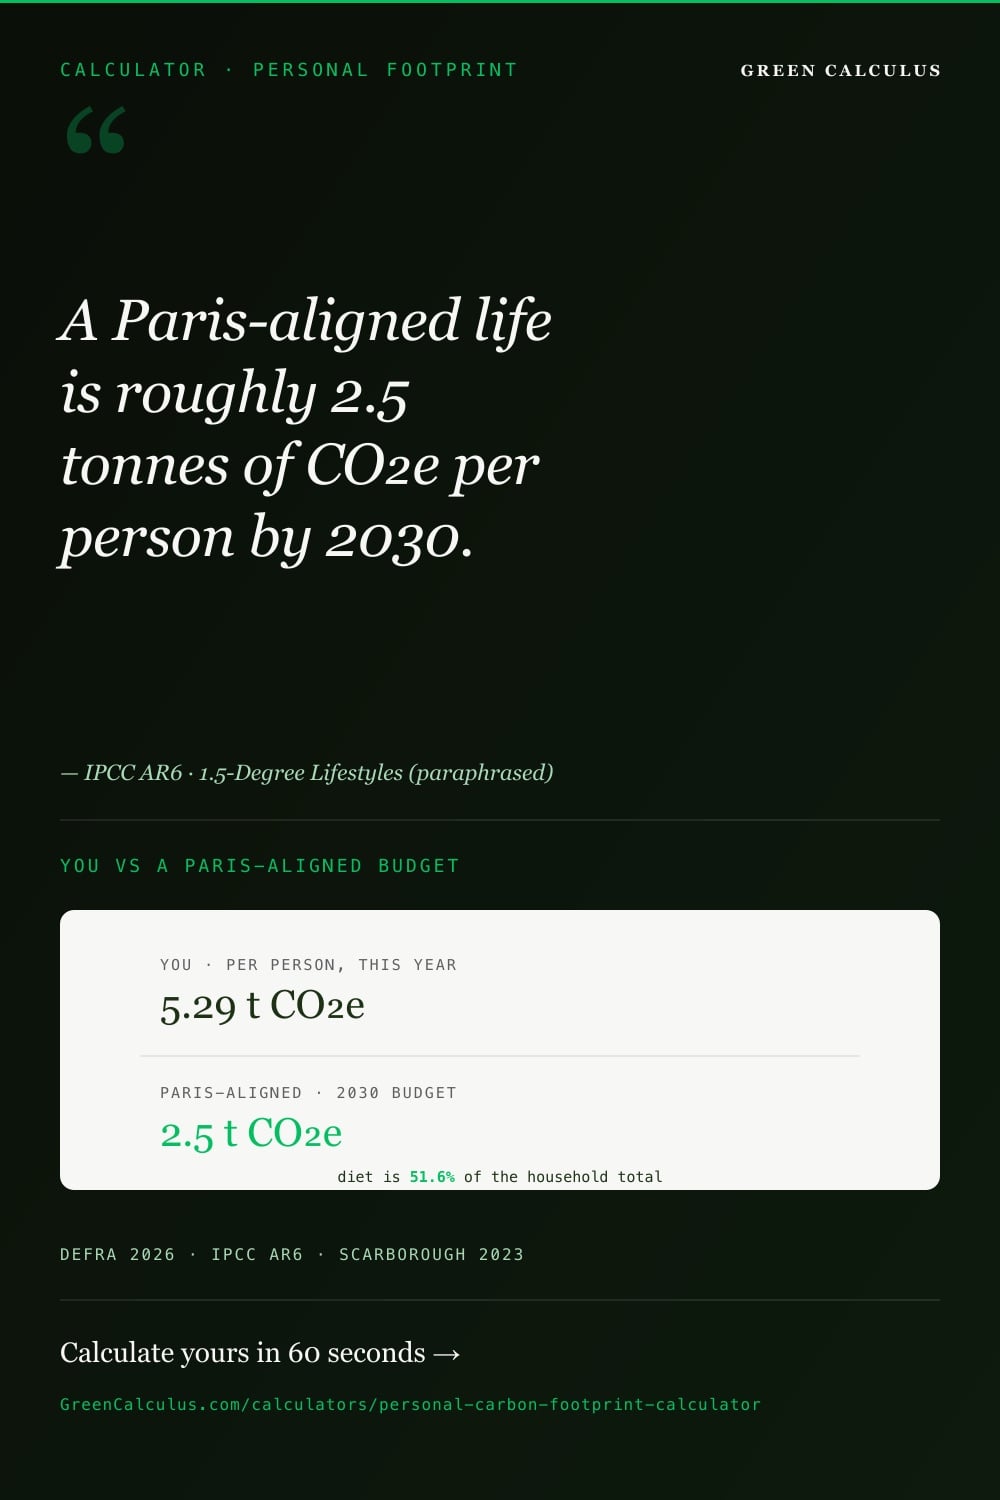
The household total is about 10.59 tonnes CO2e, or roughly 5.29 tonnes per person — below the UK average of 7 tonnes, but still more than double the 2.5-tonne Paris-aligned target.
Reading the breakdown
The striking feature of this household is where the emissions concentrate. Diet is the single largest category at 51.6 per cent of the total — a direct consequence of two people each carrying a full whole-diet footprint, and a reminder that food is not a rounding error. Gas heating is next at 19.8 per cent, then the car at 13.0 per cent and flights at 12.2 per cent. Home electricity, despite being the category people most often try to cut first, is just 3.3 per cent — the cleaner grid has made it a small line.
| Category | Emissions (kg) | Share of total |
|---|---|---|
| Diet (2 people) | 5,467.7 | 51.6% |
| Home gas | 2,096.6 | 19.8% |
| Car | 1,381.2 | 13.0% |
| Flights | 1,287.4 | 12.2% |
| Home electricity | 353.7 | 3.3% |
This distribution is the whole argument for the next section. If this household wanted to cut its footprint, switching off lights harder would touch three per cent of the total; shifting diet, heating, or flying would touch the other ninety-seven. The breakdown tells you where the leverage is before you spend a single hour of effort.
What actually moves the needle
Personal carbon advice is full of actions that feel meaningful but move almost nothing, and short on the few that move a lot. The difference is not effort or virtue — it is arithmetic. A change only matters if it acts on a category large enough to register in tonnes.
The high-impact changes
Fly less, especially long-haul
A single long-haul return flight can add one to two tonnes of CO2e per person — comparable to a whole year of another category. No other single decision an individual makes has this concentration. Cutting one long-haul trip a year is often the largest reduction available to a frequent flyer.
Change how you heat your home
Gas heating is typically the largest home-energy line. Switching to a heat pump on the current grid, or cutting heating demand through insulation, moves emissions by hundreds of kilograms to over a tonne per year — far more than any change to electrical use.
Shift your diet
Moving from a high-meat to a low-meat, pescatarian, or plant-based pattern cuts roughly one to nearly three tonnes per person per year, based on the Scarborough figures. Because it is a sustained pattern rather than a one-off, it compounds every year.
Drive less, or drive electric
Reducing car kilometres cuts emissions linearly, and switching from an average petrol or diesel car to an electric one on today’s UK grid cuts the per-kilometre factor to a fraction. For a high-mileage driver this is a multi-hundred-kilogram change.
The changes people overrate
Several widely-promoted actions are real but small against a tonnes-scale footprint. They are worth doing, but not worth mistaking for the main event:
- Unplugging chargers and standby devices. Standby loads are a few kilograms a year on a cleaner grid — genuine, but a rounding error against heating, flying, and diet.
- Switching off lights. Lighting is a small slice of an already-small electricity line. Do it, but do not count it as decarbonisation.
- Recycling and refusing plastic straws. Important for waste and marine pollution, largely irrelevant to a carbon footprint measured in tonnes.
- Obsessing over “food miles.” Transport is usually a small part of a food’s footprint; what you eat matters far more than how far it travelled.
The uncomfortable arithmetic of personal footprints is that a single long-haul return flight can undo a year of diligent effort in every other category. Someone who cycles, recycles, eats carefully, and keeps a cool home can erase most of that saving with one holiday flight. This is not an argument against the other actions — it is an argument for treating flying as the high-leverage decision it is, rather than the one category people are most reluctant to examine.
Reducing your footprint — a practical sequence
Once you can see where your footprint concentrates, the order of action is straightforward: start with the largest categories, and treat offsetting as a last step for what you cannot yet cut, not a first step that lets you skip the rest.
Home
Reduce heating demand first — insulation, draught-proofing, and a lower thermostat set-point all cut the largest home-energy line. Then address the heat source: a heat pump replaces gas combustion with grid electricity that is now much cleaner per unit. Electrical efficiency comes last, because it acts on the smallest line.
Transport
Question flights before anything else, since they carry the highest emissions per decision. For everyday travel, shift journeys to rail and active modes where practical, and if you are replacing a car, weigh an electric one over its full lifecycle. Distance reduction and mode shift usually beat marginal efficiency gains.
Diet
A durable shift in dietary pattern — less red meat, more plants — delivers a per-person reduction that repeats every year. It does not require perfection; moving one tier down the meat-intensity scale is already a measurable change in the Scarborough figures.
Offsetting has a role, but only after you have cut what you can — it cannot substitute for reduction, and offset quality varies enormously. Treat it as a way to address residual emissions you cannot yet eliminate, and scrutinise what you buy. If you want to understand what credible offsetting costs and how the archetypes differ, the carbon offset cost calculator is a neutral budgeting and due-diligence tool, not a marketplace.
Data sources, factors, and assumptions
The complete underlying reference — every factor in this section, versioned with full source provenance and downloadable as CSV with a citable Zenodo DOI — is published as the UK domestic energy benchmarks (NEED) dataset.
Every number in this calculator traces to a named, published source. The table below lists the factor families and their provenance; the calculator’s built-in “Cite this factor” control surfaces the same attribution for each individual input.
| Factor family | Source | Unit | GWP basis | Update cadence |
|---|---|---|---|---|
| Home fuels (gas, oil, LPG) | DEFRA 2026 (DESNZ GHG Conversion Factors) | kg CO2e / kWh | AR5 GWP-100 | Annual (each June) |
| Grid electricity | DEFRA 2026 (UK); Ember Yearly Electricity (other countries) | kg CO2e / kWh | AR5 GWP-100 | Annual |
| Cars and road travel | DEFRA 2026 (passenger vehicles) | kg CO2e / km | AR5 GWP-100 | Annual |
| Flights | DEFRA 2026 (air travel, with radiative forcing) | kg CO2e / passenger-km | AR5 GWP-100 | Annual |
| Diet | Scarborough et al. 2023, Nature Food 4:565–574 | kg CO2e / person / year | AR5 GWP-100 | On study revision |
| Home-energy typical consumption | Ofgem TDCV (typical domestic consumption values) | kWh / year (default seed) | n/a (activity data) | Periodic |
The diet tiers in full
The diet figures are per person per year, drawn from the Scarborough study’s whole-diet lifecycle measurement of UK eating patterns. The calculator multiplies the tier you select by the number of people in the household.
| Diet pattern | kg CO2e / person / year | tCO2e |
|---|---|---|
| High-meat (≥100 g/day) | 3,737.6 | 3.74 |
| Mixed / average | 2,733.85 | 2.73 |
| Low-meat (<50 g/day) | 1,960.05 | 1.96 |
| Pescatarian | 1,730.1 | 1.73 |
| Vegetarian | 1,518.4 | 1.52 |
| Vegan | 901.55 | 0.90 |
Factor versioning and update transparency
DEFRA refreshes its conversion factors every June; the 2026 release is the current set, and its most consequential change for personal footprints was the UK grid factor falling from 0.177 to 0.131 kg CO2e per kWh. Grid factors for other countries come from Ember’s yearly electricity data. Because factors update, a footprint computed this year and the same inputs computed next year may differ slightly even if nothing about your behaviour changed — the calculator stamps each result with the data version it used, so year-on-year comparisons remain honest.
Limitations — reading your number honestly
A screening tool earns trust by being clear about what it cannot do. These are the boundaries of this calculator’s number:
- Goods and services are not summed. The headline total covers home energy, travel, and diet. Consumed goods, services, and financial products are discussed but not added, so your true consumption-based footprint is somewhat higher than the number shown.
- UK-centred factors. The default factor set is UK (DEFRA), with per-country grid factors available via Ember. A household outside the UK should read the home-energy and travel figures as approximate unless local factors are selected.
- Diet is pattern-based, not itemised. The diet figure reflects a dietary pattern from a population study, not your specific shopping. Two people who both select “mixed” will show the same diet figure even if their actual diets differ.
- Benchmarks are directional. The 2.5 / 4.7 / 7.0 reference points are published on slightly different accounting bases and are best read as an order-of-magnitude comparison, not a precise ranking.
- Averages seed the defaults, not your reality. Typical-consumption values are a starting point. Your own metered figures — the kWh on your bills, your real mileage — always give a better result than the defaults.
None of this undermines the tool’s purpose. A footprint accurate to the nearest tonne, with every factor named and every assumption stated, is far more useful for deciding what to change than a precise-looking single number with no provenance. Read your result as a map, act on the largest categories first, and re-run it as your circumstances change.
Frequently asked questions
It is the total greenhouse gas released by your activities over a year, expressed as carbon dioxide equivalent (CO2e). “Equivalent” means potent gases like methane and nitrous oxide are converted onto a common CO2 scale using global warming potentials before being added up. For an individual, it is dominated by home energy, travel, and diet. This calculator estimates those three and treats consumed goods and services as context rather than a summed line.
Roughly 7 tonnes CO2e per person per year in the UK on a consumption basis, and about 4.7 tonnes as a global per-capita CO2 average. Both sit well above a Paris-aligned level of about 2.5 tonnes per person by 2030. These figures are published on slightly different accounting bases, so treat them as a directional comparison rather than a strict ranking. Your own result is more meaningful than any average because it reflects your actual choices.
Every line uses the same equation: activity data × emission factor = emissions. You enter the activity — kilowatt-hours, kilometres, passenger-kilometres, or a diet type — and the calculator multiplies it by a published emission factor, then sums the categories. Home energy and travel factors come from DEFRA 2026, grid electricity from DEFRA (UK) and Ember (other countries), and diet from the Scarborough 2023 study. All figures use IPCC AR5 global warming potentials over 100 years, so nothing mixes accounting bases.
UK home fuels, cars, and flights use the DEFRA 2026 conversion factors (the DESNZ GHG Conversion Factors set). Grid electricity uses 0.131 kg CO2e per kWh for the UK (DEFRA 2026) and Ember yearly electricity data for other countries. Diet uses Scarborough et al. 2023 (Nature Food), a whole-diet lifecycle study. Every input carries a “Cite this factor” control naming its exact source and vintage. All values are on the IPCC AR5 GWP-100 basis.
Because the UK grid has become much cleaner. The 2026 DEFRA factor for grid electricity fell to 0.131 kg CO2e per kWh, down from 0.177 the year before, reflecting more wind and less coal and gas in the 2024 generation mix. As a result, home electricity is now one of the smaller lines in a typical UK footprint, while gas heating — unchanged — has become relatively more dominant. Cutting heating demand usually beats cutting electrical use.
Two reasons. Flights cover long distances quickly, so passenger-kilometres accumulate fast, and aviation carries a radiative-forcing uplift — contrails and high-altitude effects add warming beyond the CO2 alone. This calculator applies DEFRA’s with-uplift factors by default, which is the more complete choice. The result is that a single long-haul return flight can add one to two tonnes per person, rivalling a whole year of another category. It is often the single largest reduction available to a frequent flyer.
A lot, and every year. Using the Scarborough figures, a high-meat diet is about 3.74 tonnes per person per year, a mixed diet about 2.73, and a vegan diet about 0.90 — so moving from high-meat to plant-based cuts nearly three tonnes per person annually. Even shifting one tier down the meat-intensity scale is a measurable change. Because diet is a sustained pattern rather than a one-off purchase, the saving compounds year after year.
A Paris-aligned personal target is about 2.5 tonnes CO2e per person by 2030, based on the IGES/Aalto 1.5-Degree Lifestyles work. That is roughly a third of the current UK average of 7 tonnes. Reaching it is not about marginal tweaks — it requires acting on the few large categories: how you heat your home, how much you fly, and what you eat. Getting “below average” is a start, but the average itself sits well above a sustainable level.
Both matter, at different levels. Structural drivers — the electricity grid, the built environment, aviation, agriculture — set the ceiling on how low an individual can go, and those need policy and infrastructure to change. Your footprint tells you where your own leverage sits inside that system. It does not claim individual action substitutes for structural change; it maps the choices you do control. The most honest reading is that personal and systemic action are complementary, not rivals.
Offset last, and cut first. Offsetting cannot substitute for reduction, and offset quality varies enormously, so treat it as a way to address residual emissions you cannot yet eliminate rather than a licence to skip the harder changes. If you do offset, scrutinise what you buy — permanence, additionality, and verification differ sharply across offset types. The carbon offset cost calculator is a neutral tool for understanding what credible offsetting costs and how the archetypes compare.
Because estimating consumed goods and services credibly needs household spending data and spend-based emission factors that this tool does not collect. A rough guess there would add more noise than signal to the headline number, so the calculator leaves it out and names it explicitly rather than burying an unreliable figure in the total. Your true consumption-based footprint is therefore somewhat higher than the number shown — the modelled categories are the ones that dominate most footprints and are most within your control.
Partly. The default factor set is UK (DEFRA), and grid electricity factors for other countries are available via Ember’s yearly electricity data, so the electricity line can be localised. Home-fuel, car, and flight factors are UK-based, so a household elsewhere should read those as approximate. The method — activity data × emission factor — is universal; the accuracy depends on how closely the UK factors match your local conditions.
Methodology notes and limitations
Scope. The calculator estimates an annual personal and household carbon footprint across home energy, travel, and diet. It is a screening tool for individuals, not a GHG Protocol corporate inventory, and does not produce an audit-grade or assurance-ready figure.
Factor sources. Home energy and travel factors are DEFRA 2026 (DESNZ GHG Conversion Factors). Grid electricity is DEFRA 2026 for the UK (0.131 kg CO2e/kWh, location-based) and Ember Yearly Electricity data for other countries. Diet figures are Scarborough et al. 2023 (Nature Food 4:565–574), whole-diet lifecycle values by dietary pattern. Home-energy default consumption follows Ofgem typical domestic consumption values.
GWP basis. All figures use IPCC AR5 global warming potentials over a 100-year horizon, consistent with DEFRA’s conversion-factor basis and the diet study. No total mixes GWP bases.
Flights. Air-travel factors include DEFRA’s radiative-forcing uplift by default (with-RF), the more complete choice for a personal footprint. The worked example uses long-haul economy at 0.11704 kg CO2e per passenger-kilometre.
Diet arithmetic. Diet figures are per person per year and are multiplied by household size. A two-person household on a mixed diet carries 2 × 2,733.85 = 5,467.7 kg CO2e for the diet line; the per-person total divides the household total by the number of people.
Benchmark gauge. The comparison reference points are 2.5 (1.5 °C-aligned personal budget, 2030 — IGES/Aalto), 4.7 (global average — Global Carbon Project / Our World in Data), and 7.0 (UK average — DEFRA consumption-based) tCO2e per person per year. These are published on slightly different accounting bases and are presented as a directional comparison, not a strict like-for-like ranking.
Exclusions. Consumed goods, services, and financial products are not summed into the headline total. Non-UK households should treat UK-based home-fuel, car, and flight factors as approximate unless localised inputs are used.
No assurance. Results are estimates for personal decision-making. They are not a verified inventory and should not be used for regulatory or corporate disclosure.