
Carbon Footprint by Country: CO₂ Emissions in 2024

The world released 38.6 billion tonnes of fossil CO2 in 2024. Three countries account for more than half of it, but the ranking changes completely when you divide by population, and changes again when you count the CO2 in the goods a country imports. This page gives all three views for 214 countries, from the Global Carbon Project’s 2025 data, with a table you can sort and filter.
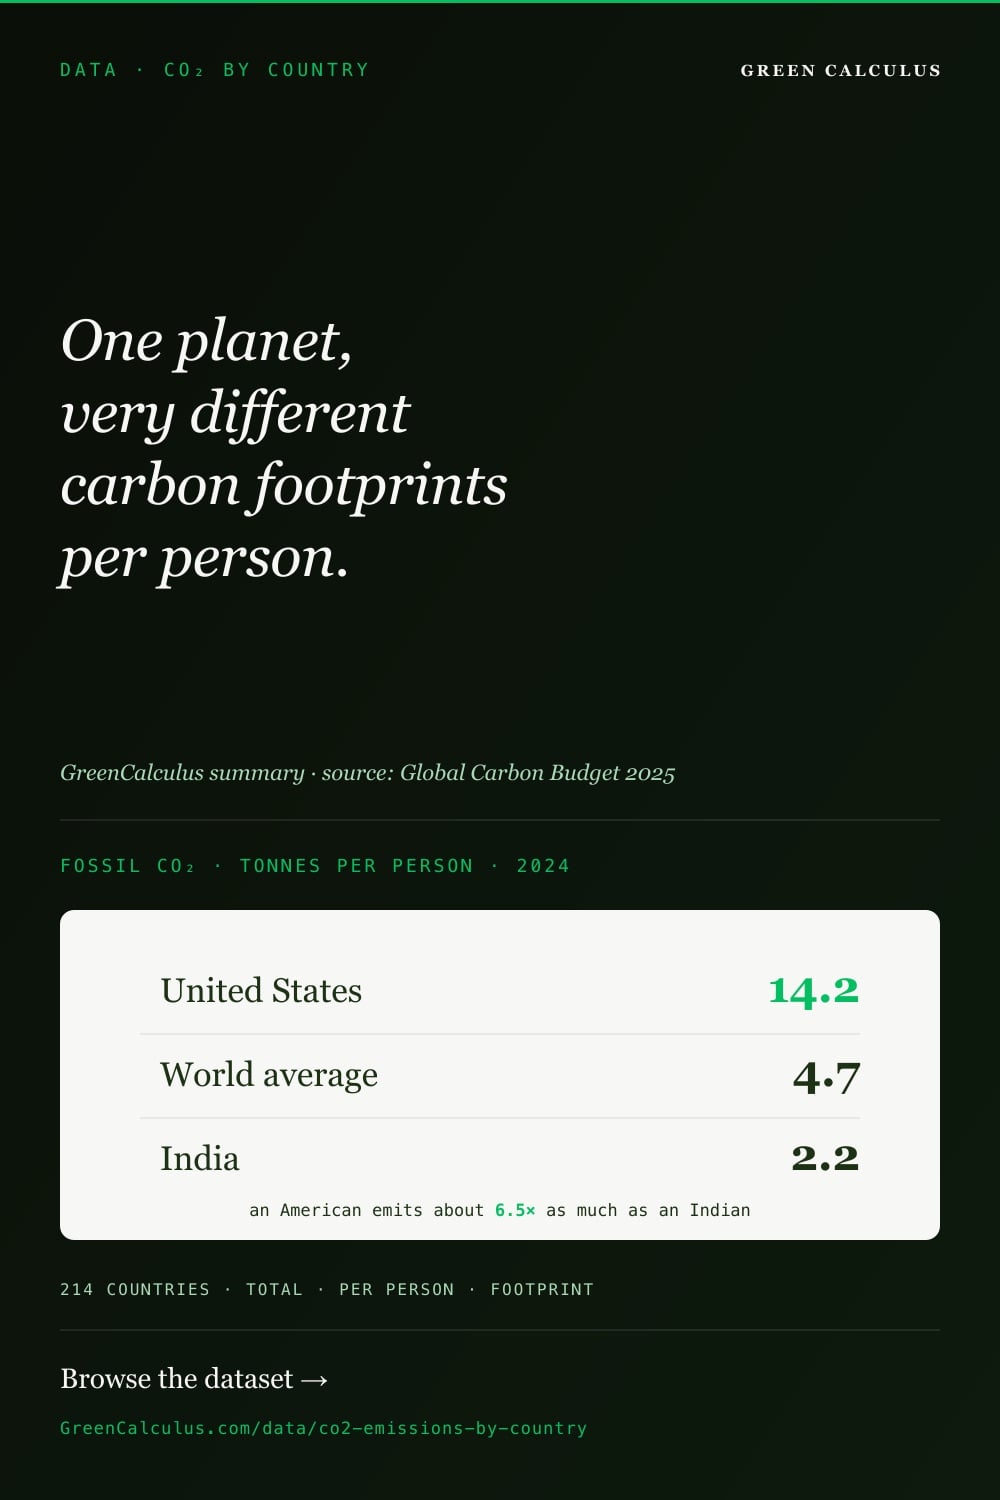
China has the largest carbon footprint: 12,289 million tonnes of fossil CO2 in 2024, 31.84% of the world total. The United States is second (4,904 Mt) and India third (3,193 Mt). Per person, the world average is 4.7 tonnes; an American emits 14.2 t, a Chinese resident 8.7 t and an Indian resident 2.2 t. The highest per-person figure is Qatar at 41.3 t.
The largest emitters
Ranked by the CO2 released inside each country’s borders in 2024 (the “territorial” total that national inventories report). The top ten countries emit 69% of the world total.
| Rank | Country | Mt CO₂ | Share of world | t per person | Change since 2015 |
|---|---|---|---|---|---|
| 1 | China | 12,289.0 | 31.84% | 8.66 | +24.7% |
| 2 | United States | 4,904.1 | 12.71% | 14.20 | −8.7% |
| 3 | India | 3,193.5 | 8.27% | 2.20 | +43.1% |
| 4 | Russia | 1,780.5 | 4.61% | 12.29 | +8.9% |
| 5 | Japan | 961.9 | 2.49% | 7.77 | −21.2% |
| 6 | Indonesia | 812.2 | 2.10% | 2.87 | +47.4% |
| 7 | Iran | 792.6 | 2.05% | 8.66 | +23.5% |
| 8 | Saudi Arabia | 692.1 | 1.79% | 20.38 | +10.8% |
| 9 | South Korea | 583.7 | 1.51% | 11.29 | −8.0% |
| 10 | Germany | 572.3 | 1.48% | 6.77 | −28.5% |
| 11 | Canada | 533.3 | 1.38% | 13.42 | −5.3% |
| 12 | Türkiye | 513.0 | 1.33% | 5.87 | +32.3% |
| 13 | Brazil | 483.0 | 1.25% | 2.28 | −8.6% |
| 14 | Mexico | 461.0 | 1.19% | 3.52 | −3.8% |
| 15 | South Africa | 439.8 | 1.14% | 6.87 | −3.9% |
| 16 | Australia | 386.7 | 1.00% | 14.48 | −3.5% |
| 17 | Viet Nam | 370.9 | 0.96% | 3.67 | +73.8% |
| 18 | United Kingdom | 312.9 | 0.81% | 4.53 | −25.9% |
| 19 | Italy | 301.9 | 0.78% | 5.09 | −16.4% |
| 20 | Malaysia | 290.2 | 0.75% | 8.16 | +23.0% |
Shares are of the world total of 38,599 Mt, which includes 1,192 Mt from international shipping (623 Mt) and aviation (569 Mt). Under UN reporting rules those fuels belong to no country, so they appear in the world total but in no national row. The European Union as a bloc emitted 2,426 Mt (6.29%), which would place it fourth if it were counted as one country.
Emissions per person
Dividing by population tells a different story. Among countries with at least 20 million people, the highest emitters per person in 2024 were:
The top of the per-person list is made up of small oil and gas producers: Qatar (41.3 t), Kuwait (26.2 t), Brunei Darussalam (26.0 t) and Bahrain (24.3 t). Their oil and gas production and energy-intensive industry are counted against small populations. At the other end, the average person in the Democratic Republic of the Congo emitted 0.05 t; an American emits about 260 times as much.
China’s total is 2.5 times America’s, but it is spread over 4.1 times as many people, so the average American still emits 1.6 times as much as the average Chinese resident and 6.5 times as much as the average Indian. For the full American breakdown, see the carbon footprint of the average American.
Footprint: counting what a country imports
Strictly, a country’s carbon footprint is its consumption-based emissions: the CO2 released anywhere in the world to make the goods and services its people use. It is the territorial total, minus the CO2 embodied in exports, plus the CO2 embodied in imports. The Global Carbon Project estimates this for 120 countries; the latest year is 2023.
Rich importers have a larger footprint than their territorial total. The difference in 2023:
| Country | Territorial | Consumption (footprint) | Difference | Footprint, t per person |
|---|---|---|---|---|
| United States | 4,918 | 5,432 | +10.4% | 15.8 |
| United Kingdom | 308 | 487 | +58.2% | 7.1 |
| Germany | 594 | 768 | +29.4% | 9.1 |
| Japan | 987 | 1,142 | +15.7% | 9.2 |
| France | 270 | 407 | +50.7% | 6.1 |
| Singapore | 51 | 187 | +266.0% | 32.3 |
| South Korea | 589 | 709 | +20.3% | 13.7 |
| Italy | 312 | 429 | +37.4% | 7.2 |
The United Kingdom’s footprint is 58% larger than the CO2 it emits at home; the EU’s is 33% larger (3,302 Mt against 2,485 Mt). The countries that make those goods show the opposite:
| Country | Territorial | Consumption (footprint) | Difference | Footprint, t per person |
|---|---|---|---|---|
| China | 12,172 | 10,857 | −10.8% | 7.6 |
| India | 3,063 | 2,543 | −17.0% | 1.8 |
| Russia | 1,733 | 1,406 | −18.9% | 9.7 |
| Iran | 790 | 669 | −15.3% | 7.4 |
| South Africa | 437 | 325 | −25.5% | 5.1 |
| Viet Nam | 347 | 248 | −28.7% | 2.5 |
China’s footprint is 11% below its territorial total: about 1,315 Mt of the CO2 it emitted in 2023 went into goods consumed elsewhere. The territorial column here is the 2023 figure (consumption plus the published transfer), so both columns cover the same year.
Consumption-based estimates trace trade through a multi-region input-output model. They depend on trade statistics and on assumptions about how goods are made abroad, so treat differences of a few percent as noise. Territorial totals come from energy statistics and are the more precise of the two.
Change since 2015
World fossil CO2 was +9.0% higher in 2024 than in 2015, the year of the Paris Agreement. Among the 20 largest emitters, the fastest growth and the steepest falls were:
| Rising | Change | Falling | Change |
|---|---|---|---|
| Viet Nam | +73.8% | Germany | −28.5% |
| Indonesia | +47.4% | United Kingdom | −25.9% |
| India | +43.1% | Japan | −21.2% |
| Türkiye | +32.3% | Italy | −16.4% |
| China | +24.7% | United States | −8.7% |
| Iran | +23.5% | Brazil | −8.6% |
In the Global Carbon Project’s breakdown by fuel, coal accounts for most of the fall in Germany, the United Kingdom and Italy, and for most of the rise in Viet Nam, Indonesia and India. Japan’s fall came more from oil. In the United States, coal fell by more than the total did, offset partly by more gas.
Every country: sortable table
All 214 countries and territories in the Global Carbon Budget. Territorial figures are for 2024; footprint (consumption) figures are for 2023 and exist for 120 countries. Click a column header to sort.
214 countries and territories, alphabetical. Click a column header to sort.
| Afghanistan | AFG | 10.8 | 0.25 | +15.4% | – | – |
|---|---|---|---|---|---|---|
| Albania | ALB | 4.4 | 1.59 | −5.7% | 5.4 | 1.91 |
| Algeria | DZA | 198.2 | 4.23 | +23.6% | – | – |
| Andorra | AND | 0.42 | 5.18 | −8.6% | – | – |
| Angola | AGO | 22.3 | 0.59 | −18.8% | – | – |
| Anguilla | AIA | 0.15 | 10.14 | +8.8% | – | – |
| Antigua and Barbuda | ATG | 0.67 | 7.09 | +14.9% | – | – |
| Argentina | ARG | 171.1 | 3.74 | −10.8% | 185.7 | 4.08 |
| Armenia | ARM | 7.4 | 2.50 | +35.9% | 7.7 | 2.61 |
| Aruba | ABW | 0.92 | 8.52 | +2.6% | – | – |
| Australia | AUS | 386.7 | 14.48 | −3.5% | 372.2 | 14.07 |
| Austria | AUT | 56.4 | 6.18 | −15.1% | 76.5 | 8.38 |
| Azerbaijan | AZE | 39.8 | 3.85 | +14.8% | 40.8 | 3.96 |
| Bahamas | BHS | 3.1 | 7.65 | +37.6% | – | – |
| Bahrain | BHR | 39.0 | 24.27 | +19.9% | 22.1 | 14.06 |
| Bangladesh | BGD | 108.3 | 0.62 | +40.8% | 167.9 | 0.98 |
| Barbados | BRB | 1.4 | 4.83 | +2.2% | – | – |
| Belarus | BLR | 55.8 | 6.16 | −5.1% | 62.5 | 6.86 |
| Belgium | BEL | 85.5 | 7.28 | −15.7% | 196.6 | 16.79 |
| Belize | BLZ | 0.80 | 1.91 | +16.2% | – | – |
| Benin | BEN | 6.1 | 0.42 | +14.1% | 8.4 | 0.60 |
| Bermuda | BMU | 0.55 | 8.51 | +1.5% | – | – |
| Bhutan | BTN | 1.7 | 2.09 | +15.6% | – | – |
| Bolivia | BOL | 28.7 | 2.31 | +44.3% | 25.6 | 2.09 |
| Bonaire, Saint Eustatius and Saba | BES | 0.15 | 4.95 | +18.8% | – | – |
| Bosnia and Herzegovina | BIH | 19.4 | 6.14 | +5.2% | – | – |
| Botswana | BWA | 7.5 | 2.96 | +37.7% | 14.5 | 5.85 |
| Brazil | BRA | 483.0 | 2.28 | −8.6% | 470.0 | 2.23 |
| British Virgin Islands | VGB | 0.19 | 4.88 | −13.8% | – | – |
| Brunei Darussalam | BRN | 12.1 | 26.05 | +73.8% | 8.9 | 19.34 |
| Bulgaria | BGR | 31.6 | 4.68 | −34.3% | 35.3 | 5.20 |
| Burkina Faso | BFA | 6.5 | 0.28 | +73.8% | 5.8 | 0.25 |
| Burundi | BDI | 0.92 | 0.07 | +158.3% | – | – |
| Cambodia | KHM | 21.9 | 1.24 | +167.3% | 39.1 | 2.24 |
| Cameroon | CMR | 9.6 | 0.33 | −2.2% | 10.4 | 0.37 |
| Canada | CAN | 533.3 | 13.42 | −5.3% | 519.9 | 13.23 |
| Cape Verde | CPV | 0.59 | 1.13 | +20.0% | – | – |
| Central African Republic | CAF | 0.40 | 0.07 | +103.6% | – | – |
| Chad | TCD | 2.8 | 0.14 | +20.4% | – | – |
| Chile | CHL | 78.7 | 3.98 | −3.7% | 88.2 | 4.48 |
| China | CHN | 12,289.0 | 8.66 | +24.7% | 10,857.0 | 7.63 |
| Colombia | COL | 92.7 | 1.75 | +1.8% | 104.5 | 2.00 |
| Comoros | COM | 0.55 | 0.64 | +206.7% | – | – |
| Congo | COG | 8.8 | 1.40 | +56.8% | – | – |
| Cook Islands | COK | 0.08 | 5.83 | +3.9% | – | – |
| Costa Rica | CRI | 8.8 | 1.71 | +19.1% | 14.7 | 2.88 |
| Croatia | HRV | 18.5 | 4.76 | +3.8% | 23.7 | 6.09 |
| Cuba | CUB | 24.4 | 2.23 | −16.0% | – | – |
| Curaçao | CUW | 2.3 | 12.34 | −68.8% | – | – |
| Cyprus | CYP | 7.3 | 5.37 | +5.0% | 8.6 | 6.41 |
| Czechia | CZE | 75.6 | 7.04 | −28.0% | 100.0 | 9.25 |
| Côte d'Ivoire | CIV | 14.8 | 0.46 | +55.2% | 17.9 | 0.57 |
| Democratic Republic of the Congo | COD | 5.9 | 0.05 | +80.3% | – | – |
| Denmark | DNK | 28.4 | 4.75 | −19.2% | 49.5 | 8.32 |
| Djibouti | DJI | 0.56 | 0.48 | +11.7% | – | – |
| Dominica | DMA | 0.17 | 2.58 | −2.8% | – | – |
| Dominican Republic | DOM | 33.1 | 2.90 | +44.1% | 40.4 | 3.57 |
| Ecuador | ECU | 46.0 | 2.54 | +11.3% | 48.9 | 2.72 |
| Egypt | EGY | 258.4 | 2.22 | +14.0% | 253.4 | 2.21 |
| El Salvador | SLV | 9.0 | 1.42 | +35.2% | 11.3 | 1.78 |
| Equatorial Guinea | GNQ | 7.0 | 3.70 | +0.0% | – | – |
| Eritrea | ERI | 0.74 | 0.21 | +33.4% | – | – |
| Estonia | EST | 8.3 | 6.11 | −47.4% | 12.6 | 9.21 |
| Eswatini | SWZ | 1.0 | 0.84 | +22.9% | – | – |
| Ethiopia | ETH | 17.8 | 0.14 | +42.0% | 23.2 | 0.18 |
| Faroe Islands | FRO | 0.72 | 13.09 | +19.2% | – | – |
| Fiji | FJI | 1.4 | 1.56 | −1.2% | – | – |
| Finland | FIN | 29.8 | 5.30 | −32.6% | 47.5 | 8.47 |
| France | FRA | 264.2 | 3.97 | −20.5% | 407.4 | 6.13 |
| French Polynesia | PYF | 0.92 | 3.27 | +9.1% | – | – |
| Gabon | GAB | 5.4 | 2.13 | −6.5% | – | – |
| Gambia | GMB | 0.80 | 0.29 | +37.7% | – | – |
| Georgia | GEO | 11.8 | 3.10 | +20.4% | 15.4 | 4.04 |
| Germany | DEU | 572.3 | 6.77 | −28.5% | 768.5 | 9.09 |
| Ghana | GHA | 21.0 | 0.61 | +44.3% | 26.4 | 0.78 |
| Greece | GRC | 53.4 | 5.31 | −28.8% | 67.2 | 6.56 |
| Greenland | GRL | 0.62 | 11.09 | +13.0% | – | – |
| Grenada | GRD | 0.38 | 3.22 | +45.0% | – | – |
| Guatemala | GTM | 19.9 | 1.08 | +28.7% | 25.4 | 1.40 |
| Guinea | GIN | 4.0 | 0.27 | +64.1% | 6.4 | 0.44 |
| Guinea-Bissau | GNB | 0.34 | 0.15 | +122.1% | – | – |
| Guyana | GUY | 4.5 | 5.43 | +129.6% | – | – |
| Haiti | HTI | 3.0 | 0.25 | +11.9% | – | – |
| Honduras | HND | 12.9 | 1.19 | +18.0% | 10.5 | 0.98 |
| Hong Kong | HKG | 33.3 | 4.49 | −21.4% | 144.2 | 19.37 |
| Hungary | HUN | 40.0 | 4.14 | −14.1% | 56.7 | 5.86 |
| Iceland | ISL | 3.8 | 9.67 | +7.4% | – | – |
| India | IND | 3,193.5 | 2.20 | +43.1% | 2,543.2 | 1.77 |
| Indonesia | IDN | 812.2 | 2.87 | +47.4% | 728.2 | 2.59 |
| Iran | IRN | 792.6 | 8.66 | +23.5% | 668.6 | 7.38 |
| Iraq | IRQ | 233.6 | 5.07 | +63.9% | – | – |
| Ireland | IRL | 33.3 | 6.34 | −14.0% | 40.8 | 7.86 |
| Israel | ISR | 52.6 | 5.61 | −16.4% | 88.3 | 9.54 |
| Italy | ITA | 301.9 | 5.09 | −16.4% | 429.0 | 7.21 |
| Jamaica | JAM | 8.4 | 2.96 | +5.5% | 8.3 | 2.94 |
| Japan | JPN | 961.9 | 7.77 | −21.2% | 1,142.3 | 9.19 |
| Jordan | JOR | 23.2 | 2.01 | −10.0% | 31.8 | 2.78 |
| Kazakhstan | KAZ | 287.0 | 13.94 | −5.3% | 212.7 | 10.46 |
| Kenya | KEN | 21.2 | 0.38 | +39.5% | 35.0 | 0.63 |
| Kiribati | KIR | 0.07 | 0.54 | +22.0% | – | – |
| Kosovo | KSV | 8.1 | 4.78 | −2.9% | – | – |
| Kuwait | KWT | 129.5 | 26.25 | +38.8% | 122.3 | 25.28 |
| Kyrgyzstan | KGZ | 11.8 | 1.64 | +14.7% | 19.2 | 2.71 |
| Laos | LAO | 24.4 | 3.14 | +165.7% | 14.8 | 1.93 |
| Latvia | LVA | 6.5 | 3.45 | −11.0% | 13.4 | 7.10 |
| Lebanon | LBN | 15.7 | 2.70 | −39.2% | – | – |
| Lesotho | LSO | 2.6 | 1.10 | +25.8% | – | – |
| Liberia | LBR | 0.86 | 0.15 | +22.9% | – | – |
| Libya | LBY | 65.3 | 8.84 | +7.2% | – | – |
| Liechtenstein | LIE | 0.13 | 3.30 | −17.5% | – | – |
| Lithuania | LTU | 12.5 | 4.39 | −3.9% | 20.5 | 7.19 |
| Luxembourg | LUX | 7.0 | 10.46 | −24.6% | 7.3 | 11.02 |
| Macao | MAC | 1.1 | 1.47 | −40.4% | – | – |
| Madagascar | MDG | 4.5 | 0.14 | +45.1% | 6.4 | 0.21 |
| Malawi | MWI | 1.9 | 0.09 | +79.1% | 3.2 | 0.15 |
| Malaysia | MYS | 290.2 | 8.16 | +23.0% | 286.5 | 8.16 |
| Maldives | MDV | 2.3 | 4.37 | +79.9% | – | – |
| Mali | MLI | 7.0 | 0.28 | +105.3% | – | – |
| Malta | MLT | 1.7 | 3.20 | +1.9% | 14.3 | 26.82 |
| Marshall Islands | MHL | 0.15 | 4.11 | +7.7% | – | – |
| Mauritania | MRT | 5.2 | 1.01 | +74.5% | – | – |
| Mauritius | MUS | 4.7 | 3.68 | +11.0% | 7.9 | 6.21 |
| Mexico | MEX | 461.0 | 3.52 | −3.8% | 565.0 | 4.36 |
| Micronesia (Federated States of) | FSM | 0.15 | 1.33 | +5.6% | – | – |
| Moldova | MDA | 5.3 | 1.75 | +11.3% | – | – |
| Mongolia | MNG | 44.7 | 12.86 | +92.0% | 36.6 | 10.67 |
| Montenegro | MNE | 2.4 | 3.72 | +6.1% | – | – |
| Montserrat | MSR | 0.03 | 6.06 | −47.1% | – | – |
| Morocco | MAR | 69.1 | 1.81 | +18.1% | 69.9 | 1.85 |
| Mozambique | MOZ | 8.6 | 0.25 | +28.0% | 14.4 | 0.43 |
| Myanmar | MMR | 31.6 | 0.58 | +44.4% | – | – |
| Namibia | NAM | 3.5 | 1.15 | +2.2% | 9.6 | 3.25 |
| Nauru | NRU | 0.06 | 5.14 | +10.9% | – | – |
| Nepal | NPL | 18.8 | 0.63 | +171.9% | 47.3 | 1.59 |
| Netherlands | NLD | 114.8 | 6.30 | −30.0% | 150.1 | 8.30 |
| New Caledonia | NCL | 5.3 | 18.07 | +8.4% | – | – |
| New Zealand | NZL | 32.5 | 6.23 | −9.3% | 41.4 | 8.00 |
| Nicaragua | NIC | 5.6 | 0.81 | +4.1% | 7.2 | 1.05 |
| Niger | NER | 3.2 | 0.12 | +44.2% | – | – |
| Nigeria | NGA | 135.8 | 0.58 | +22.9% | 133.3 | 0.58 |
| Niue | NIU | 0.01 | 4.19 | +14.3% | – | – |
| North Korea | PRK | 62.5 | 2.36 | +100.0% | – | – |
| North Macedonia | MKD | 6.6 | 3.63 | −1.5% | – | – |
| Norway | NOR | 37.2 | 6.67 | −18.3% | 39.0 | 7.06 |
| Oman | OMN | 82.7 | 15.65 | +21.8% | 83.4 | 16.51 |
| Pakistan | PAK | 179.8 | 0.72 | +24.1% | 220.1 | 0.89 |
| Palau | PLW | 0.23 | 12.78 | +11.9% | – | – |
| Panama | PAN | 12.7 | 2.81 | +18.9% | 19.5 | 4.38 |
| Papua New Guinea | PNG | 8.3 | 0.79 | +32.1% | – | – |
| Paraguay | PRY | 7.9 | 1.15 | +31.3% | 13.1 | 1.92 |
| Peru | PER | 70.2 | 2.05 | +42.8% | 78.9 | 2.33 |
| Philippines | PHL | 174.9 | 1.51 | +57.5% | 211.6 | 1.84 |
| Poland | POL | 272.9 | 7.08 | −12.7% | 273.9 | 7.07 |
| Portugal | PRT | 35.5 | 3.41 | −32.0% | 47.5 | 4.55 |
| Qatar | QAT | 125.8 | 41.27 | +34.8% | 82.2 | 27.60 |
| Romania | ROU | 68.6 | 3.60 | −12.2% | 78.3 | 4.09 |
| Russia | RUS | 1,780.5 | 12.29 | +8.9% | 1,406.0 | 9.67 |
| Rwanda | RWA | 2.0 | 0.14 | +110.3% | 3.5 | 0.25 |
| Saint Helena | SHN | 0.01 | 2.17 | +0.0% | – | – |
| Saint Kitts and Nevis | KNA | 0.26 | 5.54 | +12.6% | – | – |
| Saint Lucia | LCA | 0.54 | 2.99 | +11.9% | – | – |
| Saint Pierre and Miquelon | SPM | 0.06 | 9.83 | −16.7% | – | – |
| Saint Vincent and the Grenadines | VCT | 0.26 | 2.54 | +9.4% | – | – |
| Samoa | WSM | 0.25 | 1.13 | +8.4% | – | – |
| Sao Tome and Principe | STP | 0.14 | 0.60 | +4.4% | – | – |
| Saudi Arabia | SAU | 692.1 | 20.38 | +10.8% | 654.1 | 19.66 |
| Senegal | SEN | 14.1 | 0.76 | +43.1% | 19.0 | 1.05 |
| Serbia | SRB | 42.0 | 6.24 | −4.3% | – | – |
| Seychelles | SYC | 0.65 | 5.00 | +31.1% | – | – |
| Sierra Leone | SLE | 1.4 | 0.17 | +32.3% | – | – |
| Singapore | SGP | 53.9 | 9.24 | +9.1% | 186.9 | 32.29 |
| Sint Maarten (Dutch part) | SXM | 0.72 | 16.55 | −3.5% | – | – |
| Slovakia | SVK | 29.1 | 5.28 | −15.7% | 35.0 | 6.35 |
| Slovenia | SVN | 12.8 | 6.02 | −6.6% | 19.7 | 9.32 |
| Solomon Islands | SLB | 0.29 | 0.36 | −0.7% | – | – |
| Somalia | SOM | 1.3 | 0.07 | +42.9% | – | – |
| South Africa | ZAF | 439.8 | 6.87 | −3.9% | 325.4 | 5.15 |
| South Korea | KOR | 583.7 | 11.29 | −8.0% | 708.9 | 13.70 |
| South Sudan | SSD | 1.7 | 0.14 | −11.3% | – | – |
| Spain | ESP | 220.3 | 4.60 | −18.5% | 260.6 | 5.44 |
| Sri Lanka | LKA | 20.8 | 0.90 | +8.6% | 46.4 | 2.02 |
| State of Palestine | PSE | 4.8 | 0.87 | +59.3% | – | – |
| Sudan | SDN | 17.8 | 0.35 | +24.9% | – | – |
| Suriname | SUR | 3.0 | 4.71 | +10.1% | – | – |
| Sweden | SWE | 38.1 | 3.59 | −12.0% | 61.7 | 5.85 |
| Switzerland | CHE | 32.1 | 3.60 | −17.2% | 118.3 | 13.34 |
| Syria | SYR | 31.8 | 1.29 | +2.1% | – | – |
| Taiwan | TWN | 262.3 | 11.30 | −5.0% | 294.8 | 12.64 |
| Tajikistan | TJK | 10.7 | 1.01 | +102.4% | 13.0 | 1.25 |
| Tanzania | TZA | 20.0 | 0.29 | +56.6% | 25.8 | 0.39 |
| Thailand | THA | 267.8 | 3.74 | −3.4% | 305.6 | 4.26 |
| Timor-Leste | TLS | 0.67 | 0.48 | +13.2% | – | – |
| Togo | TGO | 2.8 | 0.29 | +53.2% | 8.6 | 0.93 |
| Tonga | TON | 0.15 | 1.46 | +44.3% | – | – |
| Trinidad and Tobago | TTO | 34.6 | 22.93 | −24.1% | 22.4 | 14.87 |
| Tunisia | TUN | 32.7 | 2.66 | +4.1% | 30.2 | 2.47 |
| Turkmenistan | TKM | 81.0 | 10.81 | +28.4% | – | – |
| Turks and Caicos Islands | TCA | 0.38 | 8.14 | +20.3% | – | – |
| Tuvalu | TUV | 0.01 | 1.19 | +57.1% | – | – |
| Türkiye | TUR | 513.0 | 5.87 | +32.3% | 483.0 | 5.54 |
| Uganda | UGA | 6.3 | 0.13 | +39.9% | 8.8 | 0.18 |
| Ukraine | UKR | 142.5 | 3.76 | −36.3% | 166.3 | 4.41 |
| United Arab Emirates | ARE | 222.0 | 20.13 | −1.4% | 248.1 | 23.31 |
| United Kingdom | GBR | 312.9 | 4.53 | −25.9% | 487.1 | 7.09 |
| United States | USA | 4,904.1 | 14.20 | −8.7% | 5,431.7 | 15.81 |
| Uruguay | URY | 8.0 | 2.35 | +18.3% | 10.8 | 3.18 |
| Uzbekistan | UZB | 139.2 | 3.83 | +34.7% | – | – |
| Vanuatu | VUT | 0.20 | 0.60 | +49.2% | – | – |
| Venezuela | VEN | 116.0 | 4.08 | −30.2% | 100.5 | 3.55 |
| Viet Nam | VNM | 370.9 | 3.67 | +73.8% | 247.8 | 2.47 |
| Wallis and Futuna Islands | WLF | 0.03 | 2.71 | +19.2% | – | – |
| Yemen | YEM | 10.1 | 0.25 | −28.3% | – | – |
| Zambia | ZMB | 12.0 | 0.56 | +118.1% | 12.7 | 0.61 |
| Zimbabwe | ZWE | 13.7 | 0.82 | +14.0% | 15.3 | 0.94 |
| European Union (27) | EU27 | 2,426.2 | 5.39 | −21.6% | 3,302.2 | 7.33 |
| International shipping and aviation | – | 1,192.5 | – | – | – | – |
| World | WLD | 38,598.6 | 4.73 | +9.0% | 38,094.0 | 4.71 |
Every row has its own link: add #cty- and the three-letter code, for example #cty-ken. A dash means the Global Carbon Project publishes no value. Per-person values for very small territories can be extreme because a single refinery or power plant is divided among few people.
What these numbers include
| Included | Not included |
|---|---|
| CO2 from burning coal, oil and gas | Methane, nitrous oxide and fluorinated gases |
| CO2 from cement production and other carbonates | CO2 from deforestation and other land-use change |
| Gas flaring | International shipping and aviation (in the world total only) |
So these are fossil CO2 figures, not total greenhouse gas emissions. Sources that add the other gases, such as the EU’s EDGAR database or national inventories reported to the UN, give higher numbers for the same country (EDGAR’s all-gas figure for the United States is about 17 t per person rather than 14). Compare countries within one source, never across two.
The Global Carbon Project publishes in million tonnes of carbon. We convert with its stated factor of 3.664 tonnes of CO2 per tonne of carbon (the ratio of their molar masses; see the carbon to CO2 converter). Population for per-person values is the UN’s World Population Prospects as compiled by the Global Carbon Project; for 2024 it is a UN projection.
Worked example
Two calculations from the table, using China’s 2024 row:
- Share of the world: 12,289.0 Mt ÷ 38,598.6 Mt = 31.8%.
- Per person: 12,289.0 Mt ÷ 0.0 million people = 8.66 t CO2 per person.
- Footprint gap (2023): territorial 12,172.0 Mt − consumption 10,857.0 Mt = 1,315.0 Mt embodied in net exports.
Common errors
- Adding up countries to get the world. The 214 national totals sum to 37,406 Mt, not 38,599 Mt: international shipping and aviation (1,192 Mt) belong to no country.
- Comparing different years. Territorial data run to 2024, footprints to 2023. Compare a footprint with the territorial figure for the same year.
- Mixing CO2 with CO2e. This page is fossil CO2 only. An all-gas figure from another database is not comparable.
- Reading carbon as CO2. The source workbook is in tonnes of carbon. Forgetting the 3.664 factor understates emissions by almost three quarters.
- Trusting extreme per-person values for tiny territories. Population estimates and single facilities dominate there.
Provenance and data access
| Stage | Detail |
|---|---|
| Territorial totals and per person | Andrew, R. M. and Peters, G. P., The Global Carbon Project’s fossil CO2 emissions dataset, version 2025v15 (Zenodo, 22 October 2025). Values in Mt CO2 and t CO2 per person. |
| Footprints and transfers | Global Carbon Budget 2025 supplemental data, National Fossil Carbon Emissions 2025 v1.0 (ICOS Carbon Portal), sheets “Consumption Emissions” and “Emissions Transfers”, method of Peters, Davis and Andrew (2012). Converted from carbon with ×3.664. Footprint per person is our division by the Global Carbon Project’s population series. |
| In MasterBrain | Section national_emissions, 1,016 rows (sources GCP_FOSSIL_CO2_2025V15 and GCB_2025_NATIONAL), each citing its file, cell and value. |
| Licence | CC BY 4.0. Reuse freely with credit to the Global Carbon Project. |
Every row is served from the open factor API:
/wp-json/greencalculus/v1/factors?key_prefix=national_emissions.co2.territorial.— 2024 totals (218 rows, including world, EU27 and the two bunker rows)/wp-json/greencalculus/v1/factors?key_prefix=national_emissions.co2.territorial_per_capita.— 2024 per person/wp-json/greencalculus/v1/factors?key_prefix=national_emissions.co2.consumption.— 2023 footprints/wp-json/greencalculus/v1/factors?key_prefix=national_emissions.co2.net_export_transfer.— 2023 transfers (territorial minus consumption; positive means a net exporter)
Citation guidance
Friedlingstein, P. et al. (2026). Global Carbon Budget 2025. Earth System Science Data, 18, 3211–3288. doi:10.5194/essd-18-3211-2026. National data: Andrew, R. M. and Peters, G. P. (2025), doi:10.5281/zenodo.17417124.
Primary citation
Frequently asked questions
China. It emitted 12,289 million tonnes of fossil CO2 in 2024, 31.84% of the world total, and it also has the largest consumption-based footprint (10,857 Mt in 2023). The United States is second on both measures.
Qatar, at 41.3 tonnes per person in 2024. Among countries with more than 20 million people the highest are Saudi Arabia (20.4 t), Australia (14.5 t) and United States (14.2 t).
4.73 tonnes of fossil CO2 per person in 2024: the world total of 38,599 million tonnes divided by about 8.16 billion people. Including methane and the other gases gives a higher figure.
Territorial emissions are released inside a country. Consumption-based emissions (the footprint) are released anywhere to make what the country consumes: territorial emissions minus those embodied in exports plus those embodied in imports. Rich importers such as the UK and the US have a larger footprint than their territorial total; manufacturing exporters such as China have a smaller one.
No. They cover fossil CO2 from coal, oil, gas, cement, flaring and other carbonates. Methane, nitrous oxide, fluorinated gases and CO2 from land-use change are excluded, so all-gas totals from other databases are higher.
Once a year. The Global Carbon Project publishes each Global Carbon Budget in November, adding the previous calendar year for territorial emissions. These figures are from the 2025 edition; we update the page when the next edition is published.
Version history
| Version | Date | MasterBrain | Summary |
|---|---|---|---|
| 1.0 | 2026-10-06 | v2026.231 | Initial publication: Global Carbon Budget 2025 fossil CO₂ for 214 countries (2024 totals, per person, change since 2015) and 2023 consumption-based footprints for 120 countries. |