
Sector PCF — Beverages Calculator (Spirits / Soft Drinks / Bottled Water)
Compute a cradle-to-gate product carbon footprint for a beverage from its ingredients, processing energy, water, and container under ISO 14067 — liquid plus packaging, normalised per litre or per pack, with a selectable shelf or grave boundary.
What this calculator computes. A ISO 14067 product carbon footprint (PCF) for a beverage, built bottom-up from four stages: ingredients, processing energy, water, and packaging (plus filling). It is computed across a production run and normalised to your chosen functional unit — per litre, per bottle, or per can. The default boundary is cradle-to-gate; optional shelf and grave settings extend it.
Three kinds of value, two kinds of provenance. The calculator reads three distinct provenance classes. Water, processing electricity and heat, packaging materials, and distribution freight are live MasterBrain factors. Ingredients and merchant carbonation CO2 are cited literature constants — agricultural medians from Poore & Nemecek 2018, ecoinvent, and the World Food LCA Database, each flagged in the data-quality meter as a literature-grade assumption and cited in prose rather than presented as a platform factor.
The ingredient boundary. Ingredient factors are cradle-to-farm-gate — the emissions of growing and harvesting the crop, not its downstream processing into a finished commodity. This is a narrower boundary than the cradle-to-retail medians sometimes quoted for foods, and the two must not be conflated.
Packaging and the recycled-content lever. The packaging stage uses the same model as the dedicated packaging PCF calculator: per-component mass times a material factor, with virgin and recycled factors blended linearly by a per-line recycled percentage. Glass here is a full cradle-to-gate container-glass factor, and the calculator adds a returnable-reuse model that amortises a refillable bottle’s production across its trip count.
Boundary and basis. Cradle-to-gate by default (ingredients + processing + packaging + filling), AR-basis GWP-100, product-level under ISO 14067 and the GHG Protocol Product Standard. An optional shelf boundary adds outbound distribution freight and cold-chain energy; a grave boundary adds packaging end-of-life (Module C3). The use phase — home chilling, dilution, dishwashing of reusables — is always excluded. For corporate accounting the result maps to the buyer’s Scope 3 Category 1.
Yield, co-product allocation and returnable reuse are your assumptions (not MasterBrain factors). Defaults are representative — replace with your own production data.
These drive the parametric distribution and cold-chain lines (only counted at the retail-shelf boundary or beyond).
Add emission sources and the system output above to calculate
Results appear instantly. A contribution-by-stage bar, source hotspots (Pareto), a data-quality / confidence meter, a recycled-content lever and the full audit trail appear after calculation.
Results are indicative Product Carbon Footprints for packaged beverages, aligned with the GHG Protocol Product Life Cycle Standard and ISO 14067:2018, reported per the declared unit you choose. The default boundary is cradle-to-gate; distribution, cold-chain and packaging end-of-life are optional modules you switch on with the boundary selector. There is no published beverage PCF — and no farm-gate ingredient PCF — in MasterBrain: the figure is built up from MasterBrain packaging, grid, fuel, water and parametric freight factors plus a cited literature ingredient catalogue (Poore & Nemecek 2018 / WFLDB / ecoinvent farm-gate medians), then divided by the system output and apportioned to the product by a co-product allocation factor. Ingredient factors, yield, allocation, returnable reuse and the carbonation-CO₂ factor are your / literature assumptions, not MasterBrain rows. Land-use change, the use stage and Module D are outside this boundary unless explicitly added as a line. Generic and literature factors suit early-stage estimating only — replace the most material ingredient and packaging lines with supplier-specific (Tier 2) and primary data, confirm your recycled-content and reuse assumptions, and complete a critical review under ISO 14067 / ISO 14071 before publishing a PCF, issuing an EPD, or exchanging product footprints.
Ask which is greener, a can of cola or a glass bottle of it, and most people guess wrong. The drink inside is often a minor part of the answer; the container, the recycled content, and the distance it travels frequently matter more than the recipe. A bottle of water is almost entirely its packaging. A glass of spirits is mostly its agriculture and the energy of distillation. Two drinks, two completely different footprints — and neither is dominated by the thing in the glass.
A defensible beverage PCF is built stage by stage — ingredients, processing, water, packaging — keeps the cradle-to-farm-gate ingredient boundary separate from packaging’s cradle-to-gate, and is explicit that the container is usually the variable worth optimising first.
A beverage product carbon footprint is the cradle-to-gate CO2e of making a drink — ingredients, processing energy, water, and packaging — normalised per litre or per pack. For most packaged drinks the container, not the liquid, is the largest single stage.

What Is a Beverage Product Carbon Footprint?
A beverage product carbon footprint quantifies the greenhouse-gas emissions embodied in producing a drink, expressed in carbon dioxide equivalent (CO2e) and normalised to a functional unit such as one litre or one pack. The figure this calculator returns is cradle-to-gate by default: ingredients, processing energy, water, packaging, and filling, summed across a production run and divided by the litres produced. It is the number a producer reports for its product and a buyer carries under Scope 3 Category 1.
Liquid Plus Container, Not Just the Recipe
A beverage footprint is the sum of two stacks that behave very differently. The liquid stack — ingredients, processing, water, carbonation — is what most people picture. The container stack — the bottle or can, its closure, label, and secondary packaging — is the one people forget, and for packaged drinks it is frequently the larger of the two. A serious beverage PCF accounts for both and is explicit about which dominates, because that determines where reduction effort should go.
A litre of soft drink is mostly water with a little sugar — a low-carbon liquid. But it ships in a bottle or can whose material had to be extracted, refined, and formed. When the liquid is cheap in carbon terms and the container is not, the packaging share rises above the recipe. This is why bottled water, the simplest possible liquid, has a footprint dominated almost entirely by its packaging.
How a Beverage PCF Is Built — The Four Stages
The engine computes four stages across a production run, sums them, and normalises to the functional unit. Each stage is entered as activity — kilograms of ingredient, kilowatt-hours of energy, cubic metres of water, kilograms of packaging material — so the model reflects a real production line rather than a generic per-litre average.
The Four Stages
Ingredients contribute their mass times a cradle-to-farm-gate factor. Processing contributes user-entered electricity and heat, each multiplied by a live grid or fuel factor. Water contributes its volume times a supply-and-treatment factor. Packaging contributes each component’s mass times a blended virgin-and-recycled material factor. The run total is divided by litres produced — or by bottles or cans, depending on the functional unit you choose.
The Functional Unit Is Family-Aware
The functional unit adapts to the beverage family: beer per litre or per hectolitre; wine per 0.75 litre bottle or per litre; spirits per 0.7 litre bottle or per litre; soft drinks per litre or per 330 ml can; water per litre or per pack. A per-bottle or per-can basis approximates a per-serving figure. As always, the unit must travel with the number — a footprint quoted per can and one quoted per litre are not comparable without the pack size.
Material mass does not scale linearly with volume, so a large format almost always has a lower packaging footprint per litre than a small one. Comparing a 330 ml can against a 1.5 litre bottle per pack flatters the can; per litre delivered, the larger format usually wins on packaging. The calculator exposes both bases so the comparison is honest.
Beverage-Class Deep Dive — Spirits, Soft Drinks, Bottled Water
The three archetypes this calculator targets sit at different points on the liquid-versus-container spectrum. The bars below show the characteristic stage split for each — illustrative of where each beverage’s emissions concentrate, not a calculator output.
Indicative stage splits by beverage class. Bottled water is packaging-dominant; soft drinks split between packaging and sugar; spirits are dominated by agriculture and distillation heat. Illustrative ranges, not calculator output — your result depends on the bill of materials you enter.
Spirits & alcohol — liquid-stack-dominant
The footprint is led by agriculture (grain, grapes, agave) and by the energy of distillation or brewing. A glass spirit bottle is heavy and adds a large packaging share, but the distillation heat and the crop behind the alcohol usually lead. Process heat — entered as a fuel kWh in the calculator — is the lever most spirits producers can move.
Soft drinks — split between sugar and container
A sweetened soft drink splits roughly between its sugar (a modest cradle-to-farm-gate factor multiplied by a large mass over a run) and its packaging. Carbonation adds a small merchant-CO2 supply-chain line. The container choice — can versus PET versus glass, and the recycled fraction — typically decides which way the balance tips.
Bottled water — almost pure packaging
The liquid is essentially free of agricultural carbon, so the footprint is the bottle. PET versus glass and virgin versus recycled content dominate the result almost entirely. For bottled water, packaging optimisation is not one lever among many — it is effectively the whole footprint.
The Packaging Layer — PET, Aluminium, Glass, Corrugated
The packaging stage uses the same per-component model as the dedicated packaging PCF calculator: each component’s mass times a material A1–A3 factor, with virgin and recycled factors blended linearly by a per-line recycled percentage. The table below shows the headline material factors as read at MasterBrain v2026.203.
| Material | Virgin A1–A3 | Recycled A1–A3 | Source |
|---|---|---|---|
| PET | 3.86 kg CO2e/kg | 2.21 kg CO2e/kg | DEFRA / DESNZ 2025 |
| Aluminium (ingot) | 10.1 kg CO2e/kg | 0.26 kg CO2e/kg | European Aluminium EPR 2024 |
| Container glass | 1.40 kg CO2e/kg | 0.82 kg CO2e/kg | DEFRA / DESNZ 2025 |
| Corrugated board | 1.20 kg CO2e/kg | 1.10 kg CO2e/kg | DEFRA / DESNZ 2025 |
Plastics, paper, and glass are DEFRA / DESNZ 2025 Material-use factors (carried per tonne in MasterBrain, shown here per kilogram); aluminium is European Aluminium EPR 2024. All read live at MasterBrain v2026.203 and can shift on a data-layer version bump.
Glass Here Is Full Cradle-to-Gate
One point distinguishes this calculator from a process-emissions view of glass: the beverage engine reads a full cradle-to-gate container-glass factor (1.40 kg CO2e/kg virgin, 0.82 recycled), which includes furnace fuel, batch materials, and forming — not just the melt-process CO2. A glass beverage bottle is heavy, so even at this complete factor glass is usually the highest-footprint container per litre delivered. That is a real result, not a boundary artefact.
The Recycled-Content and Reuse Levers
Two levers move the packaging stage hardest. Recycled content blends each material toward its recycled factor — and the gap is largest for aluminium, whose recycled secondary factor is roughly 39 times below primary ingot, then PET and glass, with corrugated saving the least. The second lever is unique to beverages: a returnable bottle’s production and end-of-life are amortised across its trip count, so a refillable glass bottle reused many times can undercut a single-use container despite its mass. The break-even depends on the trip count and the return-transport burden, which sits outside the cradle-to-gate boundary.
Ingredients — The Cradle-to-Farm-Gate Boundary
Ingredient factors are the one part of the model that comes from cited literature rather than live MasterBrain rows. Each is a cradle-to-farm-gate median — the emissions of growing and harvesting the crop, up to the farm gate — drawn from Poore & Nemecek 2018, ecoinvent, and the World Food LCA Database, and flagged in the data-quality meter as a literature-grade assumption. They are cited here in prose, not presented as platform factors, because there is no MasterBrain key behind them yet.
| Ingredient | Factor (kg CO2e/kg) | Source class |
|---|---|---|
| Sugar — cane | 0.70 | Poore & Nemecek 2018 |
| Sugar — beet | 0.55 | Poore & Nemecek 2018 |
| Molasses | 0.45 | ecoinvent proxy |
| Barley malt | 0.58 | WFLDB / ecoinvent |
| Barley grain | 0.50 | Poore & Nemecek 2018 |
| Grapes | 0.45 | Poore & Nemecek 2018 |
| Coffee — green | 5.20 | Poore & Nemecek 2018 |
| Tea | 2.00 | ecoinvent / literature |
| Cocoa | 2.90 | literature median |
| Orange juice concentrate | 1.00 | ecoinvent |
| Fruit — oranges / apples / generic | 0.30 / 0.30 / 0.40 | Poore & Nemecek 2018 |
| Milk — raw | 1.40 | Poore & Nemecek 2018 |
All ingredient values are literature medians on a cradle-to-farm-gate boundary, awaiting MasterBrain curation. When the queued food.ingredient_pcf.* rows land, the calculator upgrades to them automatically. Cited in prose; not surfaced via the factor shortcode.
Two Things to Watch
First, the boundary. These are farm-gate figures — they do not include refining sugar from cane, malting barley beyond the malt line, or roasting coffee. Where your inventory needs the processed-commodity boundary, that processing energy is a separate line in the processing stage, not part of the ingredient factor. Second, a structural gap: high-fructose corn syrup has no dedicated factor, so model it as maize grain or cane sugar and flag the substitution. Coffee stands out at 5.20 kg CO2e/kg — an order of magnitude above sugar — so for coffee-based drinks the bean, not the cup, is the story.
Processing, Carbonation, and Water
The processing stage is entered as activity and read against live MasterBrain factors — there is no automatic per-litre process-energy model, because real lines vary too much. You enter the energy your plant uses; the calculator applies the factor.
Electricity and Heat
Plant electricity — brewing, bottling, refrigeration — is entered in kilowatt-hours and multiplied by the location-based grid factor for the country of production (the GB factor is 0.131 kg CO2e/kWh at the current DEFRA/Ember basis). Process heat — distillation, brewing, pasteurisation — is entered as fuel kilowatt-hours on a net calorific basis and multiplied by the relevant fuel factor (natural gas, LPG, gas oil, fuel oil, LNG, or diesel). There is no separate “distillation” or “pasteurisation” input type; each is simply electricity or heat activity, which keeps the model transparent and auditable against meter readings.
Carbonation Is the Gas’s Footprint, Not the Fizz
Carbonation is counted as the supply-chain footprint of the merchant CO2 — producing, liquefying, and delivering it — at a literature value of 0.80 kg CO2e per kg of CO2. It deliberately does not count the dosed CO2 molecules themselves as a release emission: that carbon is short-cycle and is correctly excluded from the PCF. In other words, “carbonation” in this model is the cradle-to-gate of the gas cylinder, not the bubbles in the drink.
Water
Water is a live MasterBrain factor — supply mains at 0.1913 kg CO2e/m³ and wastewater treatment at 0.17088 kg CO2e/m³, both DEFRA 2026. For most beverages water is a small line, but it is accounted explicitly rather than ignored, which matters for water-heavy processes and for transparency in a sector under scrutiny for water use.
Worked Example — A 330 ml Can of Cola
The calculator boots pre-filled with a soft-drink run so the result is legible on load: a cola in a 330 ml can, 70% recycled aluminium, grave boundary so every module is visible. The seeded run produces 100,000 litres.
The default run computes to approximately 0.276 kg CO2e per litre (about 27.6 tonnes over the 100,000 L run), as computed in the calculator at engine v1.0.0 / MasterBrain v2026.203. The stage split is packaging 52%, ingredients (sugar) 28%, distribution 14%, processing 4%, filling 2%, end-of-life roughly 0. The live calculator is the source of truth; MasterBrain-backed lines can move on a version bump.
| Stage | Seeded activity | Factor basis | Provenance |
|---|---|---|---|
| Ingredients | 11,000 kg cane sugar | 0.70 kg CO2e/kg | Literature (Poore & Nemecek) |
| Carbonation | 600 kg merchant CO2 | 0.80 kg CO2e/kg | Literature |
| Processing | 8,000 kWh plant electricity | grid factor (location-based) | Live MasterBrain |
| Packaging | 4,500 kg aluminium @ 70% recycled | 10.1 / 0.26 blended | Live MasterBrain |
| Distribution | 105,000 kg · 350 km road | freight factor | Live MasterBrain |
| End-of-life | 4,500 kg can @ 70% recycled | C3 = 0 (see note) | Live MasterBrain |
The can’s end-of-life C3 is zero — and that is correct, not missing data. Aluminium does not combust, so it carries no incineration burden; its recovery benefit sits in Module D, which is excluded from this boundary. A glass or PET line would show a non-zero C3. Confidence on the default run is medium, with roughly 30% of the footprint resting on literature ingredient factors.
The lesson in the split: even with a 70%-recycled can, packaging is still the largest stage at 52%, and the sugar behind the drink is the second at 28%. Drop the recycled fraction and packaging climbs further; switch the same cola into glass and packaging would dominate outright. The container is the lever.
Choosing the Boundary — Gate, Shelf, or Grave
The calculator offers a three-way boundary selector, and the choice materially changes the number. Stating which boundary you used is part of a defensible declaration.
Cradle-to-gate (default)
Ingredients, processing, water, packaging, and filling — everything up to the finished pack leaving the factory. This is the comparable, recipe-and-container figure and the right default for product comparison and Scope 3 Category 1 reporting by a buyer.
Shelf
Adds outbound distribution freight and cold-chain energy to the gate figure. Use it when the question is “what does this drink cost in carbon to get onto a chilled shelf,” and when distribution distance or refrigeration is material — common for chilled and imported beverages.
Grave
Adds packaging end-of-life (Module C3) to the shelf figure. Note that recovery credit (Module D) and the use phase remain excluded — grave here means through disposal of the packaging, not a net-of-recycling-credit figure.
The use phase — home refrigeration, dilution of a concentrate, washing a reusable bottle — is excluded at every boundary setting. Where it is material, such as for cordials diluted at home or for energy-intensive home carbonation, it must be assessed separately as a cradle-to-grave question.
Standards and Frameworks Governing Beverage PCFs
A beverage PCF is governed by the same product-level accounting standards as any other consumer good, with sector-specific product category rules layered on top for formal declarations.
| Framework | What it governs | Relevance to beverages |
|---|---|---|
| ISO 14067 | Product carbon footprint quantification and reporting, on ISO 14040/14044 LCA principles | The primary standard this calculator follows; sets the cradle-to-gate boundary and functional-unit discipline |
| GHG Protocol Product Standard | Product life-cycle GHG accounting and reporting | Co-governing framework; aligns the beverage PCF with a buyer’s Scope 3 Category 1 purchased-goods accounting |
| EU Product Environmental Footprint | Multi-criteria LCA method with category rules, including drafts for beverages | Relevant for EU-market beverage declarations; carbon is one of several PEF impact categories |
| Sector PCRs (beer, wine, spirits, soft drinks) | Product category rules that fix boundaries and allocation for a specific drink type | Define the comparable boundary for formal EPDs within a beverage category |
For the buyer of a beverage as an input — a hospitality group, a retailer, a caterer — the resulting figure feeds Scope 3 Category 1. For the producer, it is the product footprint that anchors reduction targets and any consumer-facing carbon claim.
Common Beverage PCF Reporting Errors
Most defensibility problems in beverage PCFs come from a small set of recurring mistakes. The list below is the set most likely to draw a reviewer’s challenge.
- Optimising the recipe while ignoring the container. For most packaged drinks the packaging is the largest stage. A reformulation that shaves the liquid footprint while leaving a virgin-glass bottle in place misses where the carbon actually is.
- Counting dosed carbonation CO2 as an emission. The dosed gas is short-cycle and excluded; only the merchant CO2‘s supply-chain footprint counts. Adding the molecular CO2 as a release double-counts and inflates the result.
- Mixing the ingredient farm-gate boundary with cradle-to-retail medians. The ingredient factors are cradle-to-farm-gate. Comparing them against published cradle-to-retail food medians, or summing the two, mixes boundaries.
- Reading the literature ingredient values as platform factors. Ingredients are cited literature medians flagged in the data-quality meter, not verified MasterBrain rows. Report them as assumptions, and prefer supplier data where the ingredient is material.
- Comparing formats per pack instead of per litre. A small pack flatters itself per pack. Normalise per litre delivered when comparing across sizes or formats.
- Treating recycled content as the same saving across materials. Recycled aluminium saves enormously, recycled corrugated very little. Read both factors; do not generalise one material’s recycled benefit to another.
- Claiming a recovery credit at the grave boundary. The grave setting adds end-of-life C3 only; Module D recovery credit and the use phase stay excluded. A recycled-content pack does not also earn an avoided-burden credit in this boundary.
- Omitting the functional unit and boundary from the declaration. A beverage PCF without its functional unit, boundary setting, and per-component recycled fractions cannot be reconciled or reproduced by a third party.
Data Sources, Factor Provenance, and Data-Quality Tiering
Three Provenance Classes
The calculator draws on three clearly-separated sources of value. Packaging materials, processing electricity and heat, water, and distribution freight are live MasterBrain rows, current at MasterBrain v2026.203 — DEFRA / DESNZ Material-use and grid factors, European Aluminium EPR for aluminium, DEFRA water factors. Ingredients are cited literature medians on a cradle-to-farm-gate boundary, from Poore & Nemecek 2018, ecoinvent, and the World Food LCA Database. Carbonation is a literature merchant-CO2 value. The first class is read live; the second and third are cited in prose.
How Uncertainty Is Expressed
Rather than a single ± figure, the calculator expresses confidence structurally through a data-quality meter that shows the share of the result resting on primary supplier data, live secondary factors, and literature constants. The default cola run, for instance, reports medium confidence with roughly 30% of the footprint resting on literature ingredient factors. The honest reading of any result is how much of it is carried by live factors and supplier data versus literature medians — and the route to higher quality is the Custom-EPD packaging component and, for material ingredients, supplier-specific data.
Version and Update Behaviour
The live MasterBrain lines move with the data layer; a version bump that revises a grid, fuel, water, or material factor changes the rendered result without any edit to this page. The literature ingredient constants are engine version-stamped and change only when the engine is revised — or when the queued food.ingredient_pcf.* MasterBrain rows land, at which point the calculator upgrades to them automatically. Always read the live result from the calculator and stamp any quoted figure with the engine and MasterBrain version.
Frequently Asked Questions
For most packaged drinks, the bottle or can. Bottled water is almost entirely packaging; a soft drink splits roughly between sugar and container. Only for ingredient-heavy drinks like spirits and coffee does the liquid stack lead, driven by agriculture and processing heat. The calculator shows the stage split so you can see which dominates your specific product.
Not as a release emission. The dosed carbonation CO2 is short-cycle carbon and is correctly excluded from the footprint. What the calculator does count is the supply-chain footprint of producing, liquefying, and delivering the merchant CO2 — a literature value of about 0.80 kg CO2e per kg of gas. So “carbonation” in the result is the gas’s cradle-to-gate, not the fizz itself.
From cited literature — agricultural medians from Poore & Nemecek 2018, ecoinvent, and the World Food LCA Database — on a cradle-to-farm-gate boundary. They are flagged in the data-quality meter as literature-grade assumptions, not live MasterBrain factors, because the platform’s ingredient rows are not yet curated. When those rows land, the calculator upgrades to them automatically. Treat the ingredient values as assumptions and prefer supplier data where an ingredient is material.
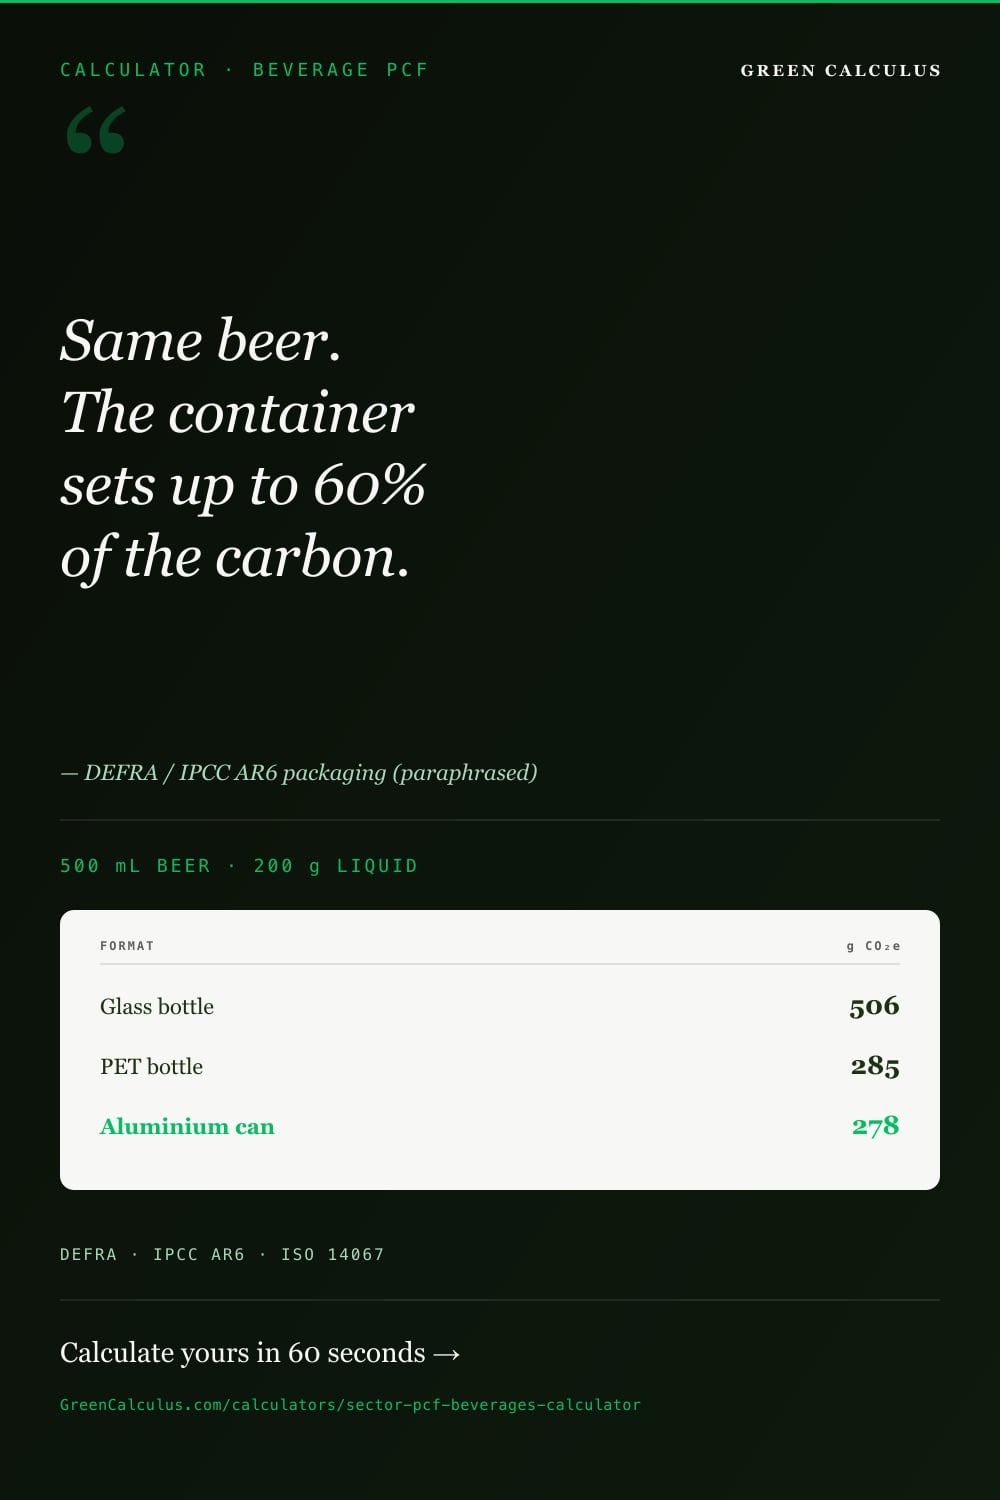
Usually yes, per litre delivered. The calculator uses a full cradle-to-gate container-glass factor that includes furnace fuel and forming, and glass bottles are heavy, so even before transport a glass bottle typically carries a higher packaging footprint than a PET bottle or aluminium can of the same volume. Refillable glass reused many times can close the gap, because the calculator amortises a returnable bottle’s production across its trips.
It depends on the beverage and the question. The calculator adapts the unit to the family — beer per litre or hectolitre, wine and spirits per bottle or litre, soft drinks per litre or 330 ml can, water per litre or pack. Per litre delivered is the fairer basis for comparing across pack sizes, because packaging mass does not scale linearly with volume. Always state the unit alongside the result.
Only if you select the shelf or grave boundary. The default cradle-to-gate figure stops at the factory gate. The shelf boundary adds outbound distribution freight and cold-chain energy; the grave boundary further adds packaging end-of-life. Home refrigeration and other use-phase effects are excluded at every setting and must be assessed separately if material.
Each packaging material has a virgin and a recycled factor, blended linearly by a per-line recycled percentage — 50% recycled sits halfway between the two. The saving depends on the gap between the factors, which is largest for aluminium (recycled secondary is roughly 39 times below primary), then PET and glass, with corrugated board saving the least. It is cut-off allocation, so no separate recovery credit is applied.
Scope 3 Category 1, purchased goods. A hospitality group, retailer, or caterer buying the beverage carries its cradle-to-gate footprint as an upstream purchased-good emission. For the producer, the same figure is its product footprint. The calculator’s default cradle-to-gate boundary and AR-basis GWP-100 are aligned with the GHG Protocol Product Standard for that use.
Methodology Notes and Limitations
Four-stage cradle-to-gate model. The default headline sums ingredients, processing, water, packaging, and filling, normalised to the functional unit. Optional shelf (+distribution freight + cold-chain) and grave (+packaging C3) boundaries extend it. The use phase is excluded at every setting.
Ingredients are literature, not MasterBrain. Ingredient and carbonation factors are cited literature medians on a cradle-to-farm-gate boundary, flagged in the data-quality meter. They are assumptions, not platform-verified factors; HFCS has no dedicated factor and is modelled as maize or cane sugar with the substitution flagged.
Live lines move with the data layer. Water, processing electricity and heat, packaging materials, and freight read live MasterBrain rows current at MasterBrain v2026.203; a data-layer bump can change the result without a page edit. Quote figures with both the engine and MasterBrain version.
Glass is full cradle-to-gate here. The beverage engine reads a complete container-glass factor including furnace fuel and forming — distinct from a melt-process-only view. Glass remains the heaviest container per litre at this factor; that is a real result, not a boundary artefact.
Carbonation is the gas’s footprint. Only the merchant CO2 supply chain is counted; the dosed CO2 is short-cycle and excluded. Recycled content is cut-off allocation with no Module D credit; returnable reuse amortises packaging across trips, excluding return-transport burden.
Screening-to-intermediate data quality. For an external product claim or a formal EPD under a beverage product category rule, replace material ingredient lines with supplier data, use a Custom-EPD packaging component, and have the inventory reviewed by a qualified LCA practitioner before use.
The container is usually the lever — model it in depth, then extend the boundary or roll the result into your purchased-goods total.