European Aluminium Environmental Profile Report — The Definitive Reference

Two pieces of the same metal can differ in embodied carbon by almost forty times. Primary European aluminium carries roughly 10 kilograms of CO₂e per kilogram; recycled aluminium carries about a quarter of one. The European Aluminium Environmental Profile Report is the sector-average dataset that puts numbers on that gap — the source behind a large share of the aluminium figures in European whole-life carbon and Scope 3 work.
If your aluminium factor does not say whether it is primary or recycled, consumption-mix or production-mix, it is not yet a usable number.
The European Aluminium Environmental Profile Report is a sector-average LCA dataset, published by the European Aluminium association, giving cradle-to-gate (EN 15804+A2 A1–A3) carbon factors for EU aluminium — primary, recycled, and semi-fabricated — on an IPCC AR5 GWP basis.
Executive Summary
The European Aluminium Environmental Profile Report is the industry-association life-cycle dataset that documents the environmental performance of aluminium produced and consumed in Europe. Published by European Aluminium — the Brussels-based association representing the European aluminium value chain — it provides sector-average, cradle-to-gate carbon factors for the metal at its principal stages: primary ingot, recycled (remelted) secondary metal, and semi-fabricated products such as extrusions and rolled sheet. The current edition referenced on this page is the 2024 Environmental Profile Report V2.0.
The dataset matters because aluminium is one of the most carbon-intensive mainstream construction and product materials, and because its embodied carbon is dominated by a single decision: primary versus recycled. Primary aluminium — smelted from alumina by electrolysis — carries on the order of 10 kg CO₂e per kg at cradle-to-gate, driven almost entirely by the electricity consumed in the smelting step. Recycled aluminium, produced by remelting scrap, carries on the order of 0.26 kg CO₂e per kg — roughly 39 times lower. No other common material carries a within-material spread of that magnitude, which makes the choice of factor the single largest lever in an aluminium embodied-carbon result.
Like ÖKOBAUDAT and the ICE database, the Environmental Profile Report is a factor source, not a methodology — it sits at Layer 3 of the carbon-accounting stack. It tells you the embodied carbon of a kilogram of European primary or recycled aluminium; it does not tell you how to draw a system boundary, allocate a recycling credit, or aggregate a building. Those decisions belong to the methodology layer — ISO 14040/14044 for LCA principles, EN 15804 for the product EPD rules, and EN 15978 for whole-building assessment. The Report supplies the numbers those methodologies consume, with a European representativity that a single national database often cannot match for this globally-traded metal.
(1) The Report is a free, association-published, EU-representative sector-average LCA dataset — a Layer 3 factor source, peer to ÖKOBAUDAT and ICE, not a methodology. (2) The primary-vs-recycled spread is roughly 39× (≈10 vs ≈0.26 kg CO₂e/kg) — the largest within-material lever in embodied carbon. (3) Primary metal carries two values — an EU consumption mix (≈10.1, import-weighted, the honest default for unknown-origin metal) and an EU produced mix (≈6.6) — and choosing the wrong one materially mis-states the result. (4) The data is cradle-to-gate (EN 15804+A2 A1–A3) on an AR5 GWP basis, and this dataset carries no Module D — the recycling credit is handled by the recycled-content method, not netted into A1–A3.
The Chain of Custody — From Smelter to Result
An aluminium embodied-carbon figure has a provenance chain, and the Environmental Profile Report occupies one specific link in it. Seeing the whole chain is what lets a practitioner defend the number when an auditor asks where it came from and how representative it is.
| Layer | Source | What it produces | Example |
|---|---|---|---|
| 1. LCA and PCR rules | ISO 14040/14044 · ISO 14025 · EN 15804 | The methodology and product-category rules that define how a cradle-to-gate aluminium LCA must be calculated and reported | EN 15804+A2 module boundaries; declared unit (per kg); cut-off allocation for recycled content |
| 2. Sector-average compilation | European Aluminium Environmental Profile Report | EU sector-average cradle-to-gate carbon factors for primary, recycled, and semi-fabricated aluminium, built from member production data | Primary ingot (consumption mix); recycled remelted secondary; extrusion |
| 3. Database aggregation | ÖKOBAUDAT, ICE, MasterBrain and peers | The sector-average factors surfaced in a structured, machine-readable library alongside other materials | GreenCalculus MasterBrain materials.aluminium.* rows, sourced from the Report |
| 4. Building / product LCA tool | Whole-building LCA or product-footprint tool | Applied factor × aluminium quantity → embodied-carbon result | EN 15978 whole-building LCA; a GreenCalculus embodied-carbon calculator |
Two consequences follow. First, the Report does not replace product-specific EPDs — where a manufacturer publishes a verified EPD for the actual aluminium product being specified, that is stronger evidence. The Report’s role is to supply a robust, European-representative sector average for the common case where product-specific data is not available, and to anchor the primary-vs-recycled and consumption-vs-production distinctions that a single generic number hides. Second, because aluminium is globally traded, the geographic scope of the factor matters more than for most materials — a European sector average is not a global average, and a primary-metal factor built on the EU consumption mix already embeds the carbon of imported metal smelted on higher-carbon grids.
This page documents Layer 2 as the Environmental Profile Report implements it. The LCA methodology and EPD rules above it are documented separately — see ISO 14040/14044 LCA principles and ISO 14067 product carbon footprint — and the whole-building methodology that consumes these factors is at EN 15978.
What the Environmental Profile Report Is
The Environmental Profile Report is a periodic life-cycle assessment of European aluminium, compiled by European Aluminium from primary-production and recycling data contributed by its member companies. It expresses the environmental performance of the metal — climate impact foremost, alongside other LCA indicators — per kilogram of aluminium at defined points in the value chain, calculated to recognised LCA methodology and aligned with the EN 15804 module structure used in construction EPDs.
Each headline factor is a sector average: it represents the typical European product across multiple producers, rather than a single manufacturer’s plant or a single conservative generic default. That positions the Report between two other kinds of data a practitioner might use. It is more representative of the actual European market than a conservative generic database entry, because it is built from real member production data. It is less specific than a manufacturer EPD for a named product, because it averages across the sector. For aluminium, where most projects cannot obtain a product-specific EPD for every component, the sector average is frequently the most defensible data that is realistically available.
The Report’s authorship by an industry association is a feature to understand rather than to discount. Association data is built from the producers’ own LCA submissions, which gives it real-world grounding and European representativity that a third party cannot easily replicate; it also means a competent reviewer treats the headline averages as sector data and reaches for a verified manufacturer EPD when a specific product’s performance — particularly a low-carbon primary product on a hydro-powered grid — needs to be evidenced rather than assumed.
The Report’s primary-aluminium average reflects the European consumption mix as a whole. A specific producer running on hydroelectric or otherwise low-carbon power can have a primary footprint well below the sector average, and a specific low-carbon or high-recycled-content product line can go lower still. Where a supplier’s lower carbon is a procurement claim or a reported reduction, evidence it with that supplier’s verified EPD — do not assume the sector average understates their product.
Why Practitioners Use It
Four properties make the Environmental Profile Report the working default for European aluminium embodied-carbon factors.
It is European-representative. Aluminium is globally traded, and a national database often cannot capture the real mix of metal a European project consumes. The Report is built from European member data and offers a consumption-mix factor that already embeds the carbon of imported primary metal — exactly what a European reporter needs when the origin of the metal is unknown.
It is grounded in real producer data. The sector averages are compiled from members’ own LCA submissions rather than estimated top-down, which gives the headline figures empirical grounding and keeps them current with the European industry’s actual electricity mix and recycling rates.
It is free and openly referenced. The Report is published by the association as a reference for the value chain and its customers, with no licence barrier — which is why it is widely adopted upstream of LCA tools and databases, including as the source behind the GreenCalculus aluminium factor rows.
It fills a real gap. General construction-LCA databases historically carried aluminium product datasets that were difficult to reconcile to a clean per-kilogram metal basis. A dedicated, value-chain-specific source resolves the primary-vs-recycled and consumption-vs-production distinctions cleanly, which is exactly where aluminium accounting goes wrong without it.
The consumption-mix primary average is the honest default when the metal’s origin is unknown. But for a project that has specified a particular low-carbon primary product, or that is sourcing high-recycled-content extrusions, the sector average understates the benefit of those choices. Use the sector average to set the baseline; use a verified product EPD to evidence a better-than-average product. Reporting the sector average where a specific lower-carbon product was procured leaves a real reduction unclaimed.
Primary vs Recycled — The 39× Decision
The defining feature of aluminium embodied carbon is the gap between primary and recycled metal. Recycling aluminium by remelting recovers the metal for a small fraction of the energy that primary electrolysis demands, because the carbon-intensive step — reducing alumina to metal in the electrolytic cell — is skipped entirely. The result is the largest within-material carbon spread of any mainstream material.
The Report’s headline cradle-to-gate factors, on an EN 15804+A2 A1–A3 basis, sit roughly as follows for the principal routes:
Two practitioner points follow. First, the dominant determinant of an aluminium result is the assumed recycled content, not small refinements to the primary factor. A component modelled as 100% primary versus the same component at a realistic recycled content can differ by several-fold — so the recycled-content assumption deserves explicit documentation and, ideally, supplier evidence rather than a default. Second, the recycled figure of ≈0.26 kg CO₂e/kg is a cut-off value for remelting: it counts the (small) burden of remelting scrap and assigns the primary-production burden to the metal’s first life, not its second. That allocation choice is standard but consequential, and it interacts with the no-Module-D treatment discussed in §7.
Consumption Mix vs Production Mix
The second distinction that determines an aluminium number — and the one most often missed — is the difference between a consumption-mix and a production-mix primary factor. The Report carries both, and they are not interchangeable.
Consumption mix (≈ 10.1)
Import-weighted: reflects the carbon of all primary metal consumed in Europe, including imports smelted on higher-carbon grids outside the EU. The honest default when the origin of the metal is unknown — which is the usual case for a European project buying on the open market.
Produced mix (≈ 6.6)
Reflects the carbon of primary metal produced within Europe, where the smelting electricity mix is cleaner on average. Appropriate only when the metal is evidenced as EU-smelted — not as a generic default for metal of unknown origin.
The gap between the two — roughly 10.1 against 6.6, a difference of more than a third on the primary factor — is large enough to swing a building or product result materially. The error mode is using the lower produced-mix figure as a convenient default for metal whose origin has not been established. Unless the EU-smelted origin is evidenced, the import-weighted consumption mix is the defensible choice, because a European project on the open market is, on average, consuming the European consumption mix.
For primary aluminium of unknown origin, use the EU consumption-mix factor (≈10.1 kg CO₂e/kg). Move to the EU produced-mix factor (≈6.6) only when the metal is evidenced as EU-smelted, and to a supplier-specific value only when a verified EPD supports it. Using the produced-mix figure as a generic default understates the carbon of typical open-market primary metal.
The Value Chain and Module Coverage
The Report follows aluminium through its value chain, and the factor a practitioner needs depends on how far down that chain the modelled product sits. The principal stages and their approximate cradle-to-gate (A1–A3) factors are:
| Stage / route | ≈ A1–A3 (kg CO₂e/kg) | What it covers | Use when |
|---|---|---|---|
| Primary ingot — consumption mix | ≈ 10.1 | Bauxite → alumina → electrolytic primary metal, import-weighted | Primary metal, unknown origin (default) |
| Primary ingot — produced mix | ≈ 6.6 | As above, EU-produced metal only | Metal evidenced as EU-smelted |
| Extrusion | ≈ 10.48 (alt ≈ 6.98) | Primary metal plus extrusion processing into profiles | Extruded profiles (façades, framing); alt value tracks the produced-mix primary input |
| Recycled secondary | ≈ 0.26 | Remelting of scrap (cut-off allocation) | Recycled-content metal; the recycled fraction of a mixed-content product |
The extrusion figure illustrates a structural point: a semi-fabricated factor is the primary (or recycled) metal factor plus the processing energy of the fabrication step, not a separate, lower number. An extrusion built on consumption-mix primary metal (≈10.48) carries a small processing increment over the primary ingot (≈10.1); its alt value (≈6.98) tracks the produced-mix primary input plus the same processing. Selecting an extrusion factor therefore inherits the same consumption-vs-production decision as the underlying metal.
Unlike many EN 15804 datasets, the Environmental Profile Report aluminium factors carry no Module D reuse/recycling credit to net against A1–A3. The end-of-life recycling benefit of aluminium is instead handled through the recycled-content method — by modelling the recycled fraction of the input at the recycled factor (≈0.26) rather than by subtracting a downstream credit. Looking for a Module D value to deduct, or importing one from a different dataset, double-counts the recycling benefit. Model the recycled content on the input side; do not net a credit on the output side.
Why Primary Aluminium Is Electricity-Bound
Primary aluminium’s carbon footprint is, more than almost any other material’s, a function of electricity. The Hall-Héroult process reduces alumina to aluminium metal in an electrolytic cell, and that electrolysis is enormously energy-intensive — on the order of thousands of kilowatt-hours per tonne of metal. The carbon intensity of the electricity feeding the smelter therefore dominates the primary factor: the same smelting process on hydroelectric power and on coal-fired power can differ by a factor of three or more in the resulting CO₂e per kilogram.
This is why the consumption-vs-production distinction in §6 exists at all: the gap between ≈10.1 and ≈6.6 is overwhelmingly a grid-carbon difference, not a process difference. European-produced primary metal is on a cleaner average grid than the import-weighted consumption mix, which includes metal smelted in regions with higher-carbon electricity. It is also why supplier-specific primary aluminium can sit far below the sector average — a producer on dedicated low-carbon power has a fundamentally different footprint, and that difference is evidenced through the producer’s own electricity-mix data, the territory of the GHG Protocol Scope 2 Guidance applied at the smelter.
A second, smaller climate contribution from primary smelting is the perfluorocarbon (PFC) process emissions released during anode effects in the electrolytic cell. These are potent greenhouse gases included in a complete primary-aluminium inventory; they are distinct from the combustion and electricity emissions and from the fluorinated gases governed by refrigerant regulation. The sector-average primary factors incorporate the process emissions characteristic of European smelting practice.
GWP Basis and EN 15804+A2 Alignment
The Report’s carbon factors are cradle-to-gate values aligned with the EN 15804+A2 product-stage module structure — modules A1 (raw material supply, including bauxite and alumina), A2 (transport), and A3 (smelting, casting, and any semi-fabrication) — reported on an IPCC AR5 GWP-100 characterisation basis consistent with EN 15804+A2. For corporate reporting, these factors map to Scope 3 Category 2 (capital goods) for aluminium embodied in a company’s own constructed assets, and to Category 1 (purchased goods) for aluminium purchased as product input.
The AR5 basis is the reconciliation point a practitioner must watch. The GHG Protocol’s current corporate framework moves headline reporting to IPCC AR6 GWP values, while EN 15804+A2 construction and material data — including these aluminium factors — remains characterised on AR5. A reporter blending the Report’s aluminium figures into an otherwise AR6-based corporate inventory should document the AR5 basis of the material data rather than silently mixing the two characterisation sets. For aluminium specifically, where CO₂ from electricity and process emissions dominates, the AR5-vs-AR6 difference on the headline CO₂e is modest, but the basis should still be stated for audit integrity.
Quote each aluminium factor with three qualifiers: the route (primary consumption / primary produced / recycled / extrusion), the module scope (A1–A3 cradle-to-gate), and the GWP basis (AR5). “≈10.1 kg CO₂e/kg” alone is ambiguous; “≈10.1 kg CO₂e/kg, primary consumption mix, A1–A3, AR5” is a usable, auditable figure.
How It Differs from CBAM Defaults and ÖKOBAUDAT
The Environmental Profile Report is one of several aluminium-carbon numbers a practitioner will encounter, and conflating them is a frequent and consequential error. The comparison below positions it against the other sources most often seen in European practice — and flags the one pairing that must never be summed.
| Source | ≈ Aluminium value | Basis | Scope mapping | Use |
|---|---|---|---|---|
| Environmental Profile Report | Primary ≈10.1 · recycled ≈0.26 | EN 15804+A2 A1–A3 cradle-to-gate, AR5, sector average | Scope 3 Cat 2 (capital goods) / Cat 1 (purchased) | Embodied carbon of aluminium in buildings and products; WLCA; Scope 3 |
| CBAM default | Unwrought ≈6.83 (per kg of good) | CBAM Annex IV regulatory embedded-emissions default, AR6 | Scope 3 Cat 1 (regulatory, separate quantity) | CBAM declarations for imported aluminium where actual data is unavailable |
| ÖKOBAUDAT aluminium | Per ÖKOBAUDAT dataset (generic / average / specific) | EN 15804+A2, AR5 | Scope 3 Cat 2 | German BNB/QNG assessment; general EN 15804 LCA |
| Manufacturer EPD | Product-specific | EN 15804+A2, verified | Scope 3 Cat 2 / Cat 1 | Procurement; material categories under assurance; low-carbon claims |
The Environmental Profile Report value (≈10.1 primary, AR5, EN 15804+A2 Scope 3 Cat 2 embodied carbon) and the CBAM default (≈6.83 per kg of good, AR6, regulatory embedded-emissions, Scope 3 Cat 1) are different quantities measuring different things. The Report is a cradle-to-gate LCA factor for embodied-carbon accounting; the CBAM default is a regulatory embedded-emissions value for border-adjustment declarations. They are not two estimates of the same number, they must not be averaged or reconciled, and they must not be summed. Keep them on separate lines and label each with its purpose.
The structural point: the Report and EU ETS/CBAM serve different regimes. CBAM defaults exist to put a price on the embedded emissions of imports; the Environmental Profile Report exists to put a representative number on embodied carbon for LCA. A defensible inventory uses the Report for Scope 3 embodied carbon and the CBAM value only in the CBAM declaration context, and never confuses the two.
Model primary vs recycled aluminium on a real take-off
The GreenCalculus embodied-carbon steel & aluminium calculator applies the Environmental Profile Report A1–A3 factors against your quantities, with the primary-vs-recycled split, the consumption-vs-production choice, and the AR5 basis visible at every step — so the provenance is in the result, not buried in a spreadsheet.
Open the steel & aluminium calculatorWorked Example — Façade, Primary vs Recycled
A worked example showing how the recycled-content decision drives an aluminium embodied-carbon result. Numbers are illustrative and hardcoded — they demonstrate the calculation chain and the factor discipline, not a live lookup for any specific project.
A curtain-wall package uses 5,000 kg of extruded aluminium profile. The embodied carbon depends entirely on the assumed metal source.
Case A — modelled as 100% primary (consumption mix): extrusion at 10.48 kg CO₂e/kg A1–A3. 5,000 × 10.48 = 52,400 kg CO₂e ≈ 52.4 tCO₂e.
Case B — modelled at 75% recycled content: blended factor = 0.25 × 10.48 + 0.75 × 0.26 = 2.62 + 0.195 = 2.815 kg CO₂e/kg. 5,000 × 2.815 = 14,075 kg CO₂e ≈ 14.1 tCO₂e.
Difference: the recycled-content assumption alone cuts the result by roughly 73% — from ≈52.4 to ≈14.1 tCO₂e on the same 5,000 kg of metal. This is why the recycled-content figure must be evidenced, not assumed: a default that is too generous understates the result; one that is too conservative leaves a real reduction unclaimed.
Three disciplines this example illustrates. First, the recycled-content split is modelled on the input side — the recycled fraction is costed at the recycled factor — consistent with the no-Module-D treatment in §7; there is no separate credit to subtract. Second, the primary input here is the consumption mix (≈10.48 extrusion); had the metal been evidenced as EU-smelted, the produced-mix alt value (≈6.98) would apply and Case A would fall accordingly. Third, the recycled-content percentage is a procurement fact, not a modelling convenience — it should come from the supplier and be documented, because it is the single most influential number in the calculation.
Compliance and Reporting Use
The Environmental Profile Report feeds several reporting and assessment contexts. Knowing which factor maps to which regime keeps an inventory defensible.
Corporate Scope 3 — capital goods and purchased goods
For a company reporting under the GHG Protocol, aluminium embodied in constructed assets falls under Scope 3 Category 2 (capital goods), and aluminium purchased as product input falls under Category 1. The Report’s sector-average A1–A3 factors are a defensible data source for both where product-specific EPDs are unavailable, provided the route (primary/recycled), the consumption-vs-production choice, and the AR5 basis are documented.
Whole-life carbon assessment
In building assessment under EN 15978 and the schemes that build on it, the Report’s cradle-to-gate factors feed the A1–A3 product stage of the aluminium components, with A4–A5, B, and C stages added per the assessment scope. Because this dataset carries no Module D, the building-level treatment of aluminium’s recycling benefit is handled through recycled content on the input side, consistent with §7.
CBAM — keep it separate
For importers, aluminium is a CBAM-covered good, and CBAM declarations use the regulatory embedded-emissions methodology with its own default values — not the Environmental Profile Report’s LCA factors. The two regimes consume different numbers for different purposes; the Report is for embodied-carbon LCA, CBAM defaults are for border-adjustment declarations.
Disclosure adjacency
As embodied carbon enters mandatory corporate disclosure through the CSRD and ESRS E1, traceable material-level carbon data becomes part of the assurance file. A sector-average source like the Environmental Profile Report is defensible for the baseline, but reasonable assurance will increasingly expect the recycled-content and origin assumptions behind a material aluminium figure to be evidenced rather than defaulted.
Use the Environmental Profile Report sector average to set the aluminium baseline and to fill the common case where no product-specific EPD exists. Move to a verified manufacturer EPD when aluminium is a material contributor to the result and a specific lower-carbon product (low-carbon primary, high-recycled-content extrusion) has been procured and needs to be evidenced — the sector average will not capture that product’s advantage.
Factor Selection Workflow
A repeatable checklist for selecting an aluminium factor from the Environmental Profile Report, ordered to put the most consequential decisions first.
- Establish recycled content first. It is the single largest determinant of the result. Get the recycled fraction from the supplier and document it; do not default it.
- For the primary fraction, choose consumption vs production mix. Default to the consumption mix (≈10.1, or ≈10.48 for extrusion) unless the metal is evidenced as EU-smelted, in which case use the produced mix (≈6.6 / ≈6.98).
- Select the value-chain stage. Use the ingot factor for cast/billet, the extrusion factor for profiles, and the appropriate semi-fabrication factor for rolled or other product — never the bare ingot factor for a fabricated product.
- Model recycled content on the input side. Cost the recycled fraction at the recycled factor (≈0.26). Do not look for or import a Module D credit to subtract — this dataset has none.
- Confirm the basis. A1–A3 cradle-to-gate, AR5 GWP. Flag if blending into an AR6-based corporate inventory.
- Reach for a manufacturer EPD where it matters. For material aluminium quantities and procured low-carbon products, evidence the better-than-average product with a verified EPD rather than reporting the sector average.
- Record provenance. Store the source (Environmental Profile Report edition), the route, the consumption-vs-production choice, the recycled-content fraction, and the basis for every aluminium line.
Edge Cases and Common Errors
Six recurring errors that surface when the Environmental Profile Report is used without the disciplines above.
Using ≈6.6 (produced mix) as a convenient default when the metal’s origin has not been established. The defensible default for unknown-origin primary metal is the import-weighted consumption mix (≈10.1).
Importing a Module D recycling credit from another dataset and netting it against A1–A3, while also modelling recycled content on the input side. This double-counts the recycling benefit. Model recycled content on the input; do not net a credit on the output.
Averaging ≈10.1 (LCA, AR5, Scope 3 Cat 2) with ≈6.83 (CBAM regulatory default, AR6, Scope 3 Cat 1), or adding them. They are different quantities for different regimes and must stay on separate lines.
Applying the ingot factor (≈10.1) to extruded profiles instead of the extrusion factor (≈10.48), omitting the fabrication processing energy. Use the factor for the actual value-chain stage of the product.
Reporting the sector average where a specific low-carbon primary or high-recycled-content product was actually procured — leaving a real, evidenced reduction unclaimed. Use the supplier’s EPD for the better-than-average product.
Reporting “≈10 kg CO₂e/kg aluminium” without stating route, module scope, and GWP basis. An aluminium factor is only auditable when it carries its route (primary/recycled), its A1–A3 scope, and its AR5 basis.
Future Evolution
Three trajectories will move the European aluminium carbon picture — and the factors in successive editions of the Report — over the coming years.
Smelter electricity decarbonisation. Because primary aluminium’s footprint is electricity-bound, the single largest lever on the sector-average primary factor is the decarbonisation of the grids feeding European and import smelters. As more primary capacity moves onto low-carbon power, the produced-mix factor falls, and — more slowly, as the global smelting fleet shifts — the consumption-mix factor follows. Successive editions of the Report will track this.
Inert anode and process-emission technology. Emerging smelting technologies that eliminate the carbon anode (and with it the direct process CO₂ and a route to lower PFC emissions) promise a step change in primary aluminium’s intrinsic footprint, independent of the grid. As these reach commercial scale, the primary factor’s floor moves down.
Rising recycled content and end-of-life recovery. Aluminium’s near-infinite recyclability and the ≈39× primary-recycled gap make recycled content the dominant decarbonisation lever on the demand side. As collection and recovery rates rise and recycled-content requirements enter procurement and regulation, the realistic blended factor for typical products falls — which sharpens the importance of evidencing recycled content rather than defaulting it, and of keeping the recycled-content method (not a Module D credit) as the accounting route.
Track every aluminium dataset update
GreenCalculus publishes a running update on the European Aluminium Environmental Profile Report, ÖKOBAUDAT and other material datasets, EN 15804 amendments, and the building-carbon and CBAM regimes that consume aluminium data.
Read the GreenCalculus changelog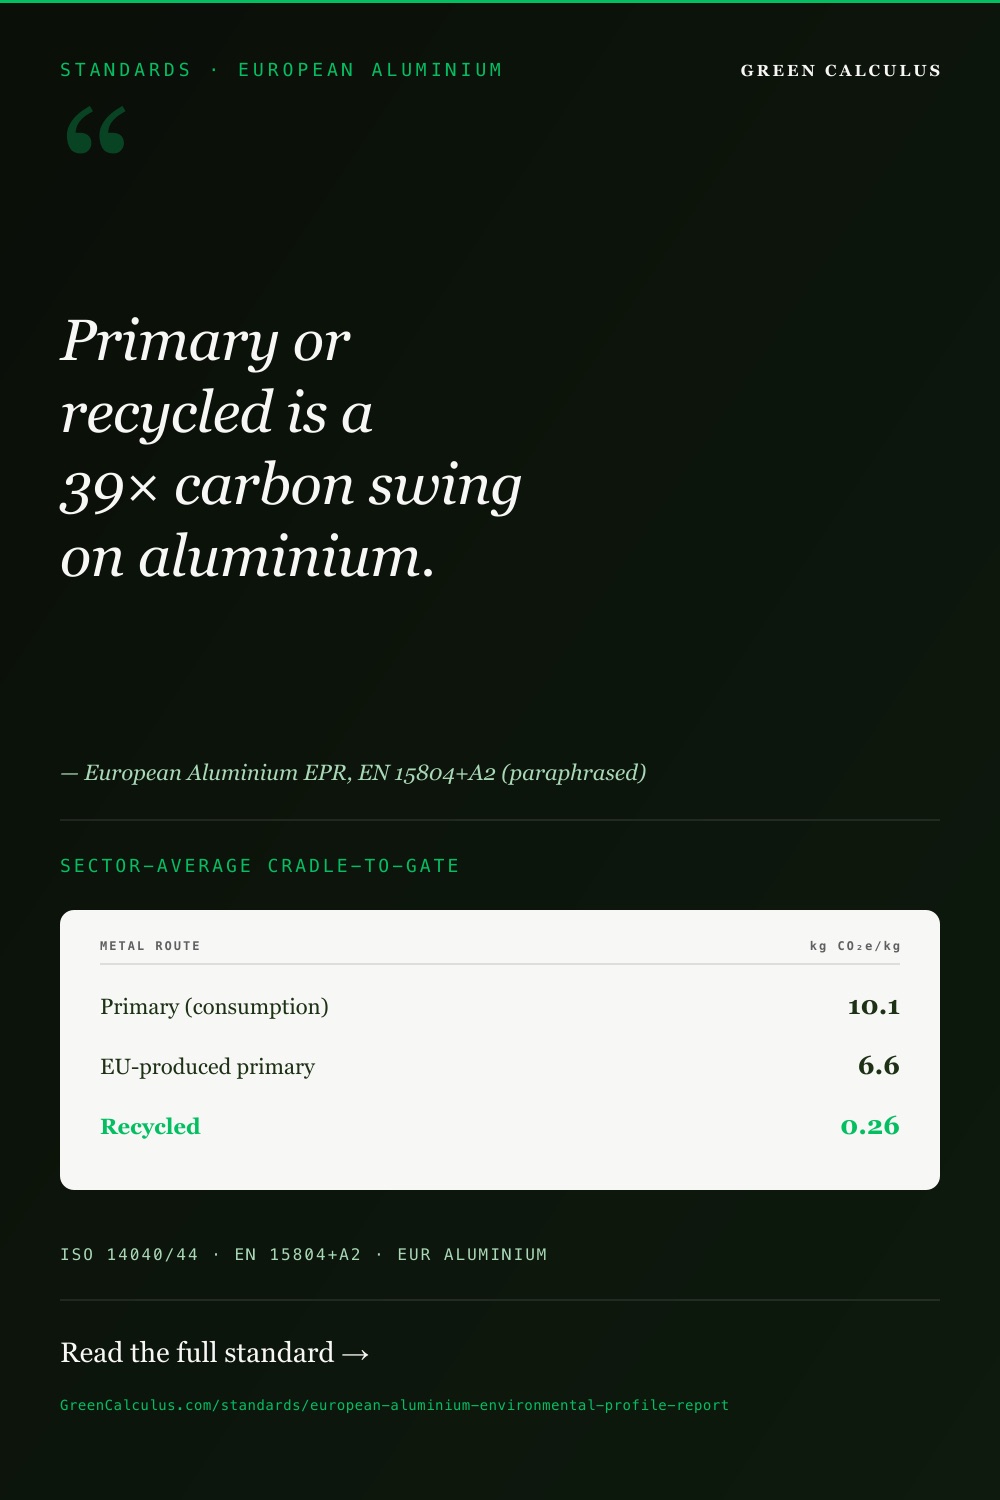
Frequently Asked Questions
It is a sector-average life-cycle assessment dataset for European aluminium, published by the European Aluminium association and compiled from member production data. It provides cradle-to-gate (EN 15804+A2, modules A1–A3) carbon factors for the metal at its main value-chain stages — primary ingot, recycled secondary, and semi-fabricated products such as extrusions — on an IPCC AR5 GWP basis. It is a factor source, not a methodology, and is widely used upstream of European whole-life carbon and Scope 3 work.
Because recycling skips the carbon-intensive step. Primary aluminium is smelted from alumina by electrolysis, which consumes an enormous amount of electricity — thousands of kilowatt-hours per tonne — so the primary factor is dominated by the carbon of that electricity. Recycled aluminium is produced by remelting scrap, which needs only a small fraction of that energy. The result is roughly a 39× gap: about 10.1 kg CO₂e/kg for primary (consumption mix) versus about 0.26 kg CO₂e/kg for recycled — the largest within-material carbon spread of any mainstream material.
The consumption mix (≈10.1 kg CO₂e/kg) is import-weighted — it reflects all primary metal consumed in Europe, including imports smelted on higher-carbon grids outside the EU. The production mix (≈6.6) reflects only metal produced within Europe, where the average smelting electricity is cleaner. For primary metal of unknown origin — the usual open-market case — the consumption mix is the defensible default. The production mix is appropriate only when the metal is evidenced as EU-smelted. Using the lower production-mix figure as a generic default understates the carbon of typical open-market primary aluminium.
Establish the recycled content first, because it is the largest determinant of the result. For the primary fraction of metal whose origin is unknown, use the EU consumption-mix factor (≈10.1 kg CO₂e/kg, or ≈10.48 for extrusions). Move to the produced mix (≈6.6 / ≈6.98) only when the metal is evidenced as EU-smelted, and to a supplier-specific value only when a verified EPD supports it. Document the recycled-content fraction and the consumption-vs-production choice on every aluminium line.
No. The Environmental Profile Report aluminium factors carry no Module D reuse/recycling credit to net against A1–A3. The recycling benefit is handled through the recycled-content method instead — by modelling the recycled fraction of the input at the recycled factor (≈0.26 kg CO₂e/kg) on the input side, rather than subtracting a downstream credit on the output side. Importing a Module D credit from a different dataset and also modelling recycled content double-counts the benefit. Model recycled content on the input; do not net a credit on the output.
No. The Environmental Profile Report value (≈10.1 primary, AR5, EN 15804+A2 cradle-to-gate, Scope 3 Cat 2 embodied carbon) and the CBAM default (≈6.83 per kg of good, AR6, regulatory embedded-emissions, Scope 3 Cat 1) are different quantities measuring different things for different regimes. The Report is an LCA factor for embodied-carbon accounting; the CBAM default is a regulatory value for border-adjustment declarations. They must not be averaged, reconciled, or summed. Keep them on separate lines, each labelled with its purpose.
The factors are cradle-to-gate, covering EN 15804+A2 product-stage modules A1 (raw material supply, including bauxite and alumina), A2 (transport), and A3 (smelting, casting, and fabrication). They are characterised on an IPCC AR5 GWP-100 basis, consistent with EN 15804+A2. This matters when blending into a corporate inventory: the GHG Protocol’s current corporate framework moves headline reporting to AR6, while EN 15804+A2 material data remains on AR5. Document the AR5 basis rather than silently mixing characterisation sets.
Almost entirely. The electrolytic smelting of alumina into aluminium consumes thousands of kilowatt-hours per tonne, so the carbon intensity of the smelter’s electricity dominates the primary factor — the same process on hydroelectric versus coal-fired power can differ by a factor of three or more. This is why the consumption-vs-production gap (≈10.1 vs ≈6.6) is mostly a grid-carbon difference, and why a producer on dedicated low-carbon power can sit far below the sector average. A smaller climate contribution comes from perfluorocarbon (PFC) process emissions released during anode effects in the cell.
Both are EN 15804+A2, AR5, cradle-to-gate sources, but they differ in scope and strength for aluminium. The Environmental Profile Report is a dedicated, EU value-chain-specific sector average that cleanly separates primary consumption mix, primary produced mix, recycled secondary, and semi-fabrication — the distinctions that drive aluminium accuracy. ÖKOBAUDAT carries aluminium among many materials as generic, average, or specific datasets tied to the German assessment regime. For aluminium specifically, the Report’s value-chain granularity makes the primary-vs-recycled and consumption-vs-production choices explicit, which a single generic database row can obscure.
It is a defensible baseline, not a universal answer. The sector average is appropriate where aluminium is not a dominant contributor or where no product-specific EPD is available, provided the route, the consumption-vs-production choice, the recycled content, and the AR5 basis are documented. Where aluminium is material and a specific lower-carbon product has been procured, reasonable assurance will increasingly expect a verified manufacturer EPD to evidence the better-than-average performance — the sector average cannot capture a specific product’s advantage and would leave a real reduction unclaimed.
On the input side, as a blend. The recycled fraction is costed at the recycled factor (≈0.26 kg CO₂e/kg) and the primary fraction at the appropriate primary factor (≈10.1 consumption mix, or the produced/extrusion value as applicable), then weighted by the recycled-content percentage. For example, a 75%-recycled extrusion blends as 0.25 × 10.48 + 0.75 × 0.26 ≈ 2.82 kg CO₂e/kg. Because this dataset has no Module D, there is no separate credit to subtract — the recycled content does all the work, which is why the recycled-content percentage must be evidenced rather than assumed.
Its cradle-to-gate factors map to Scope 3 Category 2 (capital goods) for aluminium embodied in a company’s own constructed or capital assets, and to Category 1 (purchased goods) for aluminium purchased as a product input. It is a defensible Scope 3 data source where product-specific EPDs are unavailable, provided the route, origin choice, recycled content, and AR5 basis are documented. It is not used for CBAM declarations — those use the separate regulatory embedded-emissions defaults — and it is not a methodology, so the boundary and allocation rules come from the LCA and Scope 3 standards above it.
Sources and References
Every claim and figure on this page reconciles to the primary sources below. The aluminium LCA dataset is cited directly; methodology and adjacent regimes are identified as such.
Primary dataset and LCA standards
- European Aluminium, Environmental Profile Report 2024, V2.0 — Life-Cycle Inventory Data for the European Aluminium Industry. Sector-average cradle-to-gate carbon factors for primary, recycled, and semi-fabricated aluminium (the basis for the figures on this page).
- EN 15804+A2, Sustainability of construction works — Environmental Product Declarations — Core rules for the product category of construction products. Module structure (A1–A3 cradle-to-gate) and the AR5 GWP characterisation basis.
- ISO 14040 / ISO 14044, Environmental management — Life cycle assessment — Principles and framework / Requirements and guidelines.
- ISO 14025, Environmental labels and declarations — Type III environmental declarations.
- EN 15978, Sustainability of construction works — Assessment of environmental performance of buildings — Calculation method. The whole-building LCA method that consumes these factors.
- IPCC, Fifth Assessment Report (AR5), Working Group I, 2013 — GWP-100 values underlying the EN 15804+A2 characterisation.
- IPCC, Sixth Assessment Report (AR6), Working Group I, 2021 — GWP-100 values (the AR6 corporate-reporting basis distinct from the EN 15804+A2 AR5 basis).
Adjacent regimes and frameworks
- EU CBAM (Carbon Border Adjustment Mechanism) — Annex IV default embedded-emissions values for aluminium (a separate quantity from the LCA factors on this page).
- EU Emissions Trading System (EU ETS) — the compliance regime for European primary aluminium production emissions.
- WRI & WBCSD, Corporate Value Chain (Scope 3) Accounting and Reporting Standard — Category 1 and Category 2 mapping for embodied aluminium.
- European Sustainability Reporting Standards, ESRS E1 (climate change), EFRAG — the disclosure regime that consumes embodied-carbon data.
Related GreenCalculus reference pages
- BS EN 15978 — Embodied Carbon for Buildings
- ICE Database — Embodied Carbon
- ISO 14040/14044 — Life Cycle Assessment
- ISO 14067 — Product Carbon Footprint
- GHG Protocol Product Standard
- GHG Protocol Scope 3 Standard
- GHG Protocol Scope 2 Guidance
- EU CBAM — Carbon Border Adjustment Mechanism
- EU ETS — Emissions Trading System
- CSRD / ESRS E1
- IPCC AR6
- Embodied Carbon — Steel & Aluminium Calculator
- GreenCalculus changelog
What changed in this revision
Updated 16 June 2026. Initial publication. Documents the European Aluminium Environmental Profile Report 2024 V2.0 as a Layer 3 sector-average aluminium LCA factor source: governance under European Aluminium; the primary-vs-recycled ≈39× spread (≈10.1 vs ≈0.26 kg CO₂e/kg); the consumption-mix (≈10.1) vs produced-mix (≈6.6) distinction; the value-chain stages and the no-Module-D treatment with recycled content modelled on the input side; the electricity-bound nature of primary smelting and the PFC process-emission note; the EN 15804+A2 A1–A3 / AR5 basis and Scope 3 Cat 2 mapping; the strict separation from the CBAM aluminium default (≈6.83, AR6, Scope 3 Cat 1); a hardcoded façade worked example showing the recycled-content lever; and the EN 15978 / Scope 3 / CSRD compliance context.