
Scope 3 · Category 1 · Purchased Goods and Services
Scope 3 Category 1 Spend-Based Calculator | GHG Protocol & PCAF Aligned
Multi-line portfolio calculator for upstream value-chain emissions from purchased goods and services. EPA USEEIO, EXIOBASE 3.8, and Defra 2025 Indirect Table 13 selectable per supplier line. Native currency input with automatic CPI deflation and FX normalisation. PCAF data quality scoring per line and portfolio-weighted.
Core formula (per supplier line):
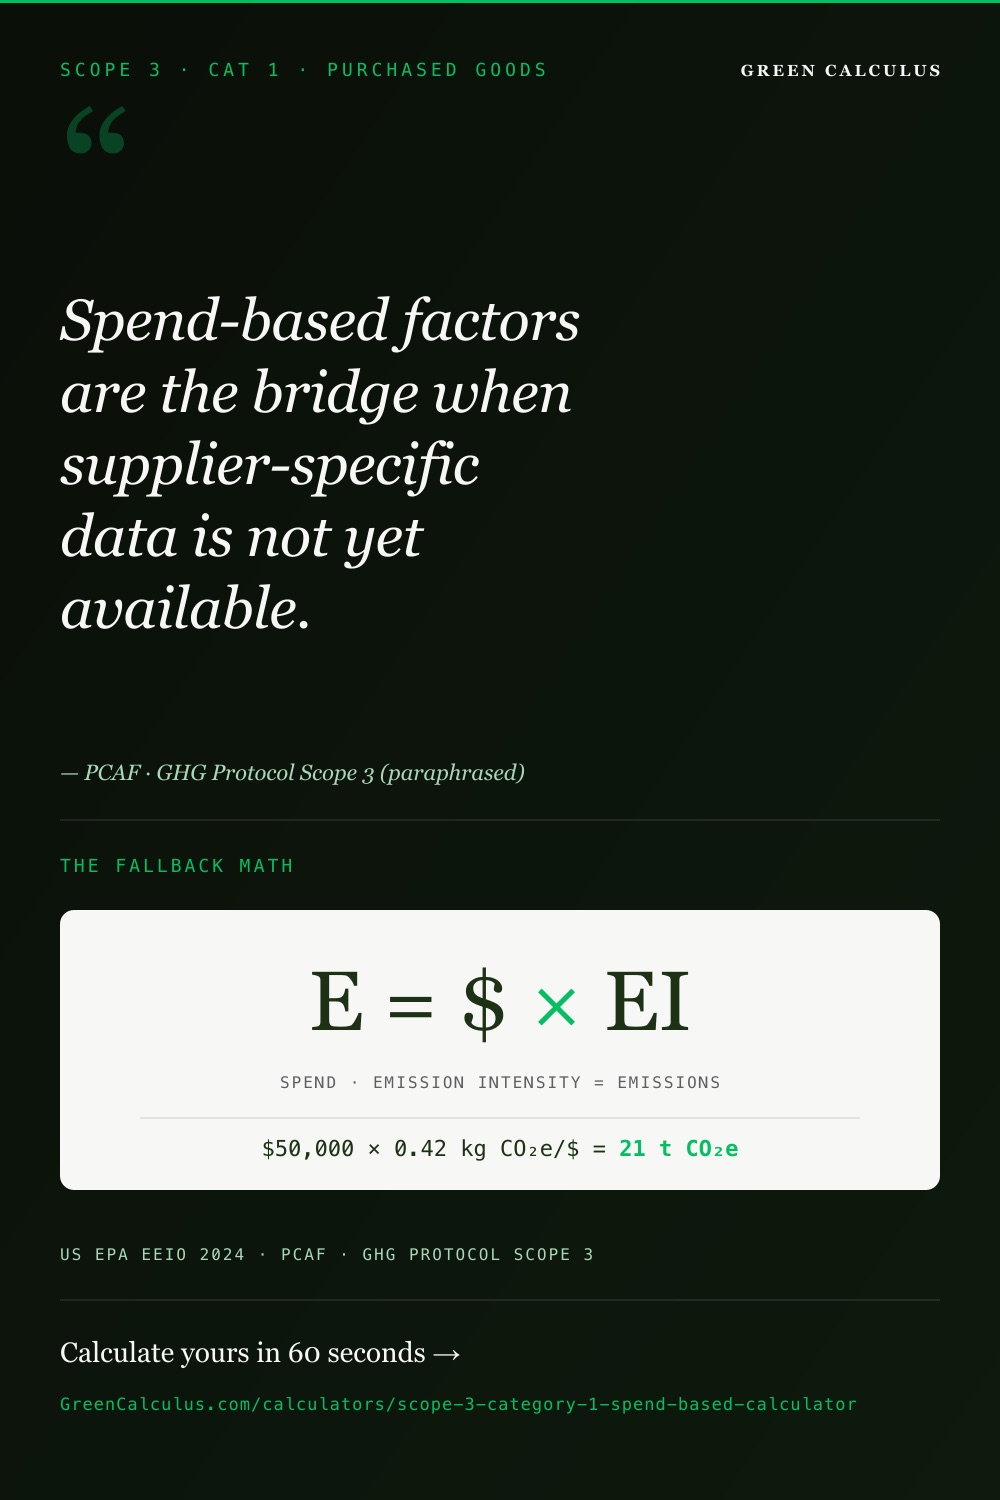
Line emissions (kg CO₂e) = Normalised spend × EEIO factor (kg CO₂e per unit currency)
Where Normalised spend = User spend × CPI deflator (user year → factor base year) × FX rate (user currency → factor base currency).
Factor source — three options, selectable per line:
EPA USEEIO v1.3 — US, USD 2022 producer price, AR5 GWP-100, 1,016 NAICS-6 commodities. Use for US-headquartered organisations or where supply chain is predominantly US.
EXIOBASE 3.8.2 — Global, EUR 2019 basic price, AR6 GWP-100 reweighted gas-mass, 200 product categories × 49 regions. Use for non-US-non-UK organisations or any mixed-geography portfolio.
Defra 2025 Indirect Table 13 — UK, GBP 2025 purchaser price including VAT, AR5 GWP-100, ~106 product groups. Use for UK SECR scope-3-extended reporting.
Price basis matters. EXIOBASE expects basic price (producer receipt before margins and taxes). Defra expects purchaser price including VAT. USEEIO ships both (the engine selects the “with margins” variant by default for consistency with what appears on a corporate ledger). Mismatching price basis can overstate or understate by 15–25%. The engine flags any line where the entered spend basis appears inconsistent with the chosen factor source.
PCAF data quality score per line: Spend-based with sector-average factor → score 4. Spend-based fallback to industry/national-average factor (sector unmapped) → score 5. Supplier-provided override (per-line kg CO₂e override) → score 2 (verified supplier data). Score 1 (third-party verified) requires evidence not collected by this calculator. The portfolio weighted-average score is reported alongside the total. Lines representing >5% of total emissions at score 4 or 5 are flagged as supplier-specific upgrade candidates.
Scope boundary: Scope 3 Category 1 — cradle-to-gate emissions of purchased goods and services. Excluded: capital goods (Category 2), fuel and energy-related activities (Category 3), upstream transportation (Category 4 — included only where embedded in EEIO supply-chain factor, not double-counted). Use-phase emissions of sold products are downstream and out of scope here. Where supplier data is available, use it (Category 1 methodology hierarchy prefers supplier-specific over spend-based — see GHG Protocol Scope 3 Standard).
Portfolio total is presented in this currency. New rows default to it.
Inherited by new rows unless overridden per line.
Each row may override this independently.
Most ledger / invoice data is purchaser price. The engine adjusts where the chosen factor source expects the other basis.
| Supplier / line name | Sector | Spend | Currency | Year | Source | Supplier override ⓘ | Emissions (kg CO₂e) | PCAF | Actions |
|---|---|---|---|---|---|---|---|---|---|
| Portfolio total | — | — | |||||||
Empty portfolio. Click + Add row to enter one supplier line, Paste CSV to bulk-import (columns: name, sector, spend, currency, year, source, override), or Load example portfolio to see a worked five-line scenario.
Audit mode reveals the full normalisation chain per line.
Embedded in the audit trail and JSON export.
Add supplier rows above to calculate the portfolio
Click + Add row, Paste CSV, or Load example portfolio to begin. Results, top contributors, PCAF scoring, and upgrade candidates appear here.
Spend-based estimates are by construction the lowest-precision tier of the GHG Protocol Cat 1 methodology hierarchy. PCAF assigns spend-based results a data quality score of 4 or 5. For material suppliers, this calculator is the first step on a multi-year roadmap toward supplier-specific (PCAF 1–3) data, not a long-term destination. Output is suitable for initial inventory baselining, screening, and reduction-target prioritisation; for regulatory submissions and third-party verification, supplier-specific data should replace spend-based estimates wherever the supplier is material. GHG Protocol Scope 3 Standard.
Scope 3 Category 1 — Purchased Goods and Services — is the single largest emissions category for the median corporate reporter, often 40–80% of the full inventory. It is also the first line auditors challenge, because spend-based estimates carry the lowest data quality score under PCAF (4 or 5) and the highest restatement risk in CSRD and SBTi verification.
This calculator applies the GHG Protocol Corporate Value Chain (Scope 3) Standard with full provenance: choose EPA USEEIO v1.3 (US, USD 2022, AR5), EXIOBASE 3.8.2 (global, EUR 2019, AR6), or Defra 2025 Indirect Table 13 (UK, GBP 2025, AR5) per supplier line. Native-currency spend is auto-deflated and FX-converted to the factor base before application. Per-line PCAF scoring surfaces which suppliers belong on the supplier-specific upgrade path, so this calculator becomes the bridge off spend-based methodology rather than a destination on it.
Why Scope 3 Category 1 dominates most inventories
Scope 3 emissions account for roughly 75% of total greenhouse-gas emissions across the corporate sector — and the gap between Scope 3 and operational (Scope 1+2) emissions widens sharply outside heavy industry. CDP’s analysis of disclosed inventories shows supply-chain Scope 3 emissions averaging 26 times operational emissions across manufacturing, retail, and materials sectors. For most companies outside cement, oil and gas, and a handful of other Scope-1-dominated sectors, Category 1 — Purchased Goods and Services — is the single largest line on the inventory.
But the dominance is sector-specific, and the shape matters for how this calculator should be used. The chart below shows Category 1’s share of total Scope 3 emissions by sector, based on CDP’s Scope 3 categories by sector technical note. Retail, consumer goods, and most industrial sectors run 50–80% Cat 1. Financial services run almost none — their Scope 3 is overwhelmingly Category 15 (Investments / Financed Emissions). Capital-goods companies sit low too, because Category 11 (Use of Sold Products) dominates their inventory. This calculator is built for the first group and is the wrong tool for the second.
The takeaway is structural: if your organisation is in the upper five bars, Category 1 is where reduction strategy lives, and getting it right matters more than refining any other line. If your organisation is in the lower two bars, this calculator is not your priority page — financial-services teams should review the PCAF financed-emissions standard instead.
Spend-based calculation is the floor of Cat 1 methodology, not the goal. The PCAF data quality framework rates it 4 or 5 out of 5 (where 1 is best). Use it to baseline, prioritise, and decide which suppliers to engage for primary data — then upgrade material suppliers off spend-based as the inventory matures.

The four-tier methodology hierarchy
The GHG Protocol Corporate Value Chain (Scope 3) Standard defines four calculation methods for Category 1, in order of preference. PCAF maps the same hierarchy to a data quality score from 1 (best) to 5 (worst). The four tiers correspond roughly to: verified supplier data, unverified supplier data, hybrid spend × supplier-specific intensity, and sector-average spend-based.
Supplier-specific (verified) PCAF 1
Method: Supplier provides product-level carbon footprint figures, third-party verified to ISO 14067 or equivalent.
When to use: For your most material suppliers, where regulatory exposure (CSRD assurance, SBTi target validation) demands the highest confidence.
Effort: Highest. Requires supplier engagement, often 12–18 months from request to first verified figure.
Supplier-specific (unverified) PCAF 2
Method: Supplier-provided emissions figures, not yet third-party assured. Often pulled from the supplier’s own CDP or sustainability report.
When to use: The most common entry point for primary data. The calculator’s supplier override column lands here.
Effort: Medium. Supplier conversation plus light documentation.
Hybrid (activity + spend) PCAF 3
Method: Activity-based factor (kg CO₂e per tonne, per unit) applied to known quantity. Used where you know the physical volume purchased but not the supplier’s specific footprint.
When to use: Mid-tier confidence — physical commodity purchases (steel, cement, paper) where industry-average activity factors exist.
Effort: Medium. Requires unit conversion from invoice line items.
Spend-based (sector average) PCAF 4–5
Method: Spend × sector-average EEIO factor. Score 4 with a sector match, score 5 with an unmapped fallback to industry average.
When to use: The baseline. Always available — every supplier with a known invoice total can be calculated this way. The default for any line not yet upgraded.
Effort: Lowest. The accounting team’s general-ledger export is the only input.
A mature Cat 1 inventory uses all four tiers, allocated by materiality. A common pattern: the top 20 suppliers by spend at PCAF 1 or 2 (covering ~60–70% of total Cat 1 emissions), the next 80–100 suppliers at PCAF 3 (covering another ~20%), and the long tail at PCAF 4. Pure spend-based portfolios (entirely PCAF 4 or 5) are acceptable for first-year baselines and CSRD initial filings, but SBTi target validation and CDP A-list scoring both penalise inventories that fail to migrate over time.
The three factor sources, compared
This calculator ships three EEIO factor sources selectable per supplier line. They differ on base year, currency, price basis, GWP basis, regional scope, and sector granularity. None is universally superior — the right source depends on your organisation’s geography and reporting requirement.
| Attribute | EPA USEEIO v1.3 | EXIOBASE 3.8.2 | Defra 2025 Indirect Table 13 |
|---|---|---|---|
| Base currency | USD 2022 | EUR 2019 | GBP 2025 |
| Price basis | Purchaser price (with margins) | Basic price (producer receipt) | Purchaser price incl. VAT |
| GWP basis | IPCC AR5 GWP-100 | IPCC AR6 GWP-100 | IPCC AR5 GWP-100 |
| Region | US (national average) | Global — 49 regions | UK (with global imports) |
| Sector granularity | 1,016 NAICS-6 commodities | 200 products × 49 regions | ~106 product groups |
| Data vintage | 2022 emissions data | 2019 emissions data | 2022 emissions data (3-yr lag) |
| Last updated | July 2024 | October 2021 (3.8 free tier; 3.9+ commercial) | June 2025 (annual) |
| License | US public domain | CC-BY-SA | UK Open Government Licence v3.0 |
| Best for | US-headquartered organisations; US-dominant supply chain | Non-US-non-UK; mixed-geography portfolios | UK SECR scope-3-extended reporting |
Read the per-source methodology pages for full provenance, sector taxonomies, and the gas-decomposition assumptions: USEEIO emission factors, EXIOBASE emission factors, and the UK Defra Conversion Factors standard page for Defra Table 13.
Two alternatives outside the calculator’s default set
Eora MRIO offers global multi-regional input-output coverage with stronger representation of developing economies than EXIOBASE — useful when supply chains pass through countries that EXIOBASE classifies into a “Rest of World” aggregate region. Eora is the right choice for organisations with material spend in sub-Saharan Africa, South Asia, or the smaller Latin American economies. The trade-off is licensing (academic free; commercial paid) and lower update frequency. See Eora MRIO emission factors methodology.
EPA AP-42 is not an EEIO source at all — it provides activity-based factors for specific industrial point sources (kg CO₂e per tonne of clinker, per cubic metre of glass melted, per litre of solvent). It is the right move for hybrid PCAF 3 calculations where your supplier provides physical volumes rather than emissions data, and complements rather than replaces the spend-based factors in this calculator. See EPA AP-42 emission factors methodology.
The price-basis trap (and how to avoid it)
The single most common audit finding on free spend-based calculators is mismatched price basis. EEIO factors are calibrated against a specific price definition — basic, purchaser, or purchaser plus VAT — and applying invoice-line totals to a factor expecting the other basis can shift Cat 1 results by 15–25% on goods with typical margins, and over 30% on high-margin or VAT-loaded categories.
EXIOBASE expects basic price — what the producer receives before retail margins, transport markups, and taxes. Defra expects purchaser price including VAT — the final invoice total. USEEIO ships both variants; this calculator uses the “with margins” variant by default for consistency with what appears on a corporate general ledger. Mixing bases without adjustment is the silent error that causes audited Cat 1 inventories to swing by 20% on restatement.
The chart below shows the magnitude of error for a typical retail goods purchase under three mismatch scenarios. Same supplier, same £100,000 invoice, three different basis assumptions:
The calculator’s portfolio-level price basis toggle declares the basis of your input spend data, and the engine applies a blended adjustment factor where the chosen factor source expects the other basis. For services-heavy spend (low margin, no VAT on B2B invoices in many jurisdictions) the adjustment is small; for retail goods with full margin chains it is the difference between a defensible inventory and a restatement.
The reliable workflow: pull your spend data in one consistent basis (typically the purchaser-price invoice total your AP team produces), declare that basis once at the portfolio level, and let the engine handle the per-line adjustment. Don’t mix bases across rows — that’s the path to silent error.
Currency and year normalisation
EEIO factors are denominated in a specific currency and base year. USEEIO v1.3 reports kg CO₂e per 2022 USD. EXIOBASE 3.8.2 reports kg CO₂e per 2019 EUR. Defra 2025 reports kg CO₂e per 2025 GBP. If your spend was incurred in 2024 GBP and you apply it to a 2019 EUR factor without adjustment, you are double-counting four years of accumulated inflation and missing the FX conversion entirely. The error is mechanical and large — typically 8–15% from CPI alone, plus 5–20% from FX direction depending on the currency pair.
The engine handles this automatically. Every line passes through a two-step normalisation: first CPI-deflate the spend within its native currency from spend year to factor base year, then FX-convert at the factor’s base-year annual average rate. Both steps are reported in the audit trail so verifiers can reproduce the result.
Sterling IT Services invoiced £18,500 in 2024. Applied to Defra 2025 (GBP 2025 base): CPI factor 1.000 ÷ 0.946 = 1.057, FX rate 1.000 (same currency). Normalised spend = £18,500 × 1.057 = £19,555 (2025 GBP). Multiplied by Defra IT-services factor 0.305 kg CO₂e/£ = 5,964 kg CO₂e. The same £18,500 applied directly without CPI adjustment would have produced 5,643 kg — a 5.4% understatement, growing each year as the gap from base year widens.
For SBTi-validated inventories and CSRD assurance, the audit trail this calculator produces is the minimum evidence required. The JSON export carries the CPI factor and FX rate for every line; the CSV export carries the normalised spend value alongside the original. Verifiers can recompute every line independently from the export alone.
PCAF data quality scoring
The PCAF Global GHG Accounting and Reporting Standard rates emissions data on a five-point scale, where 1 represents third-party-verified supplier data and 5 represents industry-average spend-based fallback. PCAF was developed for the financed-emissions context (Scope 3 Category 15) but the same scoring framework is now applied to Cat 1 by SBTi, CDP, and most CSRD assurance providers. A portfolio’s emissions-weighted average PCAF score has become the standard one-number summary of Cat 1 inventory maturity.
The calculator computes a per-line PCAF score automatically and reports the emissions-weighted portfolio average. The weighting matters: a portfolio of 100 lines where one line at PCAF 2 represents 60% of total emissions scores far better than a portfolio where 99 score-2 lines sum to 5% of emissions and the 100th score-5 line accounts for the rest. SBTi reviewers and CSRD assurance providers both check the weighted average, not the simple line-count average.
Sort the calculator’s upgrade-candidate list by emissions contribution. Email the top three suppliers, requesting their most recent CDP response or sustainability report. Most large suppliers will share an unverified Cat 1 figure for your share of their revenue — that’s PCAF 2 immediately, dropping the weighted average score by 0.5–1.0 points across the portfolio. Year two, push the same suppliers toward ISO 14067 product-level footprints (PCAF 1) and broaden engagement to the next tier.
Two worked portfolios
Two contrasting scenarios show how the calculator handles a pure spend-based baseline versus a hybrid portfolio with supplier overrides. The PCAF weighted-average score and the upgrade-candidate flagging are where the value lies — the absolute emissions totals are first-order useful, but the maturity signal is what auditors and SBTi reviewers track over time.
Portfolio A — UK SME, year-1 baseline
Profile: 50-person consulting firm, London. £2.4M annual Cat 1 spend, no supplier engagement yet.
Method: Five lines, all Defra 2025, all spend-based.
- Professional services £680k → 187 tCO₂e (PCAF 4)
- IT services £420k → 128 tCO₂e (PCAF 4)
- Office leases £350k → 47 tCO₂e (PCAF 4)
- Travel & accommodation £190k → 47 tCO₂e (PCAF 4)
- Office supplies and other £760k → 369 tCO₂e (PCAF 5 — long tail, unmapped)
Portfolio total: 778 tCO₂e
PCAF weighted average: 4.47
Top upgrade candidate: the £760k “other” line — splitting it into mapped sub-sectors alone would drop the weighted score by ~0.3.
Portfolio B — same firm, year-2 with three overrides
Profile: Same £2.4M Cat 1 spend. Three suppliers now provide unverified emissions data (PCAF 2). The “other” line has been disaggregated into four mapped sub-sectors.
Method: Eight lines, three with supplier override, five sector-mapped spend-based.
- Top legal advisor £180k → 32 tCO₂e (override, PCAF 2)
- Cloud SaaS provider £140k → 18 tCO₂e (override, PCAF 2)
- Facilities management £210k → 54 tCO₂e (override, PCAF 2)
- Remaining professional services £500k → 138 tCO₂e (PCAF 4)
- Remaining IT services £280k → 85 tCO₂e (PCAF 4)
- Office leases £140k → 19 tCO₂e (PCAF 4)
- Travel & accommodation £190k → 47 tCO₂e (PCAF 4)
- Office supplies (now mapped) £760k → 308 tCO₂e (PCAF 4)
Portfolio total: 701 tCO₂e
PCAF weighted average: 3.70
Result: -10% absolute emissions (suppliers’ verified data was lower than EEIO sector averages, which is typical), -0.77 PCAF score. This is the trajectory SBTi expects.
Two observations are worth pulling out. First, the absolute emissions number dropped — not because the firm reduced anything in year 2, but because supplier-specific data tends to be lower than EEIO sector averages (suppliers with above-average footprints don’t volunteer the data). This selection bias is real and verifiers know about it; it’s a reason SBTi treats year-on-year reductions sceptically until the inventory matures past ~70% supplier-specific coverage. Second, even three overrides at PCAF 2 dropped the weighted average meaningfully — concentration at the top of the spend distribution does most of the work.
What Category 1 excludes (avoid double counting)
Category 1 is purchased goods and services consumed during the reporting year for the production of the company’s own outputs. The boundary is precise and the most common audit findings on Cat 1 inventories are double-counts at the boundary with adjacent categories.
- Capital goods → Category 2. Plant, equipment, vehicles, IT hardware with multi-year useful life. These belong to Cat 2 and are calculated with their full embodied carbon in the year of purchase, not amortised.
- Fuel and energy purchased for own use → Category 3 (well-to-tank) plus Scope 1 or 2 (combustion). Don’t include diesel or electricity spend in Cat 1; it has its own category and is already covered by Scope 1/2 combustion factors and the Cat 3 well-to-tank companion.
- Upstream transportation paid by the supplier → embedded in the EEIO factor. Don’t add a separate Cat 4 freight line for goods where freight is included in the supplier’s invoice. The EEIO factor is cradle-to-gate by construction.
- Use-phase emissions of products you sell → Category 11, downstream. Not Cat 1, regardless of how much was spent on the product.
EEIO factors include the supply chain’s energy use — fuel, electricity, and transport — embedded in the per-currency factor by construction. Adding a separate Cat 3 well-to-tank line for the diesel embedded in your supplier’s truck fleet is a double count. The single most common audit finding on first-year Cat 1 inventories is exactly this: a supplier’s fuel spend appearing in both Cat 1 (because it’s in their invoice) and Cat 3 (because the user added a WTT companion). The calculator’s scope notice flags this; the methodology pages for USEEIO and EXIOBASE spell out the cradle-to-gate boundary in full.
Regulatory context — CSRD, SBTi, SECR, CDP
Cat 1 disclosure requirements differ sharply across the major frameworks. CSRD’s ESRS E1 requires disclosure of Scope 3 with materiality screening — Cat 1 is almost always material and must be quantified, though the standard accepts spend-based methods for year-1 baselines with a documented upgrade plan. SBTi target validation requires Cat 1 inclusion in the Scope 3 inventory for any company with Scope 3 emissions above 40% of the total — which means almost every non-cement company. SBTi increasingly expects supplier-specific data for material Cat 1 lines by the third reporting year. The UK SECR regime currently requires Scope 1+2 only, with Cat 1 voluntary but increasingly expected by institutional investors. CDP scoring penalises spend-based-only Cat 1 inventories heavily — A-list scoring requires meaningful supplier engagement coverage.
The trajectory across all four frameworks points one direction: spend-based Cat 1 is acceptable for year-1, treated with growing scepticism by year-3, and rejected for material lines by year-5. The calculator’s upgrade-candidate flagging exists because this trajectory is the default expectation, not a stretch goal.
Use the calculator
The calculator above accepts manual row entry, CSV paste from a general-ledger export, or the example portfolio for first-look familiarity. Per-line factor source selection lets a mixed-geography portfolio apply the right source to each supplier. The supplier override column is the path off spend-based — paste a verified or unverified supplier figure into any row and that line becomes PCAF 2 immediately.
For first-time users the recommended workflow is: load the example portfolio, study the audit-mode output to understand the CPI/FX chain, then clear it and paste your own data. The JSON export carries the full per-line audit trail and is the artefact verifiers will want.
Methodology references and provenance
The calculation engine, factor tables, and audit-trail format are documented in full at Scope 3 Category 1 spend-based methodology. The per-source provenance pages cover sector taxonomies, gas-decomposition assumptions, and the underlying input-output model construction for each:
- USEEIO v1.3 emission factors — sector taxonomy, NAICS-6 mapping, AR5 GWP basis, US public domain license.
- EXIOBASE 3.8.2 emission factors — 49-region MR-IOT, basic-price calibration, AR6 gas-mass reweighting, CC-BY-SA license.
- EPA AP-42 emission factors — activity-based companion for PCAF 3 hybrid calculations.
- Eora MRIO emission factors — alternative global MR-IOT for developing-economy supply chains.
For the foundational standards behind every calculation on this page:
- GHG Protocol Corporate Value Chain (Scope 3) Standard — defines Cat 1 boundaries, methodology hierarchy, and the four-tier calculation method ranking.
- PCAF Global GHG Accounting Standard — defines the 1–5 data quality scoring framework applied per line and weighted across the portfolio.
- UK Defra Emission Factors — Table 13 indirect-emissions supply-chain factors, OGL v3.0.
- Scope 3 Category 1 glossary entry — quick reference for terminology used on this page.
CDP Technical Note — Relevance of Scope 3 Categories by Sector (source for sector-share data in §1).
CDP / BCG Report 2024 — Supply-chain Scope 3 vs operational emissions (source for the 26× supply-chain ratio cited in §1).
US EPA Supply Chain GHG Emission Factors v1.3 (USEEIO source dataset).
EXIOBASE 3.8.2 (EXIOBASE source dataset, October 2021 release).
UK Government Conversion Factors for Company Reporting (Defra 2025 source, June 2025 release).
Frequently asked questions
No. Capital goods belong to Scope 3 Category 2, calculated with their full embodied carbon in the year of purchase. Category 1 covers operational purchases consumed during the reporting year — raw materials, professional services, office supplies, freight, software subscriptions, and similar. If a single supplier provides both (a vendor selling you both consumables and a piece of equipment), split the invoice line items: consumables to Cat 1, equipment to Cat 2.
The three factor sources use different GWP bases by design — USEEIO and Defra publish at AR5 GWP-100, EXIOBASE reweights to AR6 GWP-100. The calculator surfaces this honestly in the GWP-basis badge above the total. For internal screening and reduction-prioritisation work, the mixing is acceptable. For SBTi target validation and CSRD assurance, SBTi guidance prefers AR6 throughout, so most users moving to formal reporting consolidate on EXIOBASE for non-UK lines and accept the Defra AR5 carry-over for UK lines (Defra’s AR5 basis is part of its definition — the UK regulator does not expect AR6 conversion). This calculator does not auto-convert across GWP bases; that conversion requires gas-level decomposition which EEIO datasets don’t publish per line.
Three-stage pattern. Stage 1 (year 1): identify the top 10–20 suppliers by emissions contribution using this calculator’s upgrade-candidate flagging. Email each requesting their most recent CDP response, sustainability report, or product carbon footprint. Most large suppliers will share an unverified Cat 1 figure for your revenue share — that’s PCAF 2. Stage 2 (year 2): push these suppliers toward ISO 14067 product-level footprints. Their disclosure incentive is your business — make supplier-specific data a procurement criterion. Stage 3 (year 3+): broaden engagement to the next tier of suppliers and push the year-1 cohort to third-party verification (PCAF 1). A mature inventory reaches ~70% supplier-specific coverage by emissions weight.
For year-1 CSRD baseline filings, yes — spend-based Cat 1 with documented methodology is accepted under ESRS E1, and the JSON export carries the audit trail assurance providers require. For SBTi target validation, yes if the inventory is your first submission, but SBTi expects supplier-specific data to grow over time and will challenge a pure spend-based Cat 1 inventory in any third-year or later target review. The calculator’s upgrade-candidate output is specifically designed to help build the supplier-engagement roadmap SBTi will ask for. For CDP A-list scoring, spend-based-only Cat 1 is not enough — A-list requires meaningful supplier engagement coverage.
Several reasons compound. First, the GWP basis: EXIOBASE uses AR6, Defra uses AR5 — AR6 increases methane’s GWP from 28 to 29.8 and N₂O from 265 to 273, so any factor for an emissions-heavy sector shifts noticeably. Second, the regional supply-chain assumption: EXIOBASE global factors blend production from multiple regions including high-carbon-grid economies, while Defra reflects UK-specific imports. Third, the price basis: EXIOBASE basic price strips ~12% of margins+taxes that Defra purchaser-price includes — that alone is a 12% delta on what the factor sees, even before the per-£ intensity differs. The 20% combined movement is typical and not a bug — it reflects real methodological differences. Pick one source per geographically coherent group of suppliers and document the choice in the inventory methodology notes.
Eora MRIO is a legitimate alternative to EXIOBASE for global supply-chain coverage, particularly stronger for developing economies. It will be added in a future calculator version. For now, if your supply chain runs heavily through sub-Saharan Africa, South Asia, or smaller Latin American economies, read the Eora methodology page and consider whether EXIOBASE’s “Rest of World” aggregate is sufficient for your purpose. EPA AP-42 is not an EEIO source — it provides activity-based factors for specific industrial point sources (kg CO₂e per tonne of clinker, per cubic metre of glass melted). It complements rather than replaces spend-based calculation, and is the right move for PCAF 3 hybrid calculations where the supplier provides physical volume data. See the AP-42 methodology page.
Two options. First, look at the supplier’s NAICS or NACE code on the invoice or in your AP system — every taxonomy sector in this calculator maps to NAICS-6 (USEEIO), EXIOBASE product codes, and Defra Table 13 product groups. The mapping documentation in the methodology page covers the crosswalk. Second, if no clean match exists, the calculator falls back to industry-average automatically and tags the line as PCAF 5. That’s acceptable for screening but should be flagged for follow-up — split the spend across the supplier’s actual goods/services categories at year-end. Long-tail unmapped spend is the single biggest target for PCAF score improvement on year-2 inventories.
CPI and FX values are embedded in the calculator and update with each release. The current release carries annual averages for CPI through 2026 and FX through 2026. You enter spend in its native currency and year — the calculator does the deflation and conversion automatically. If your spend year is older than 2019, contact us via the contact page for an extended series; the calculator currently supports 2019–2026 to match the base-year coverage of the three factor sources. For transactional-level Cat 1 work (rare — typically only sub-monthly inventories) annual averages are insufficient; use month-of-invoice FX rates from a reliable source and apply spend-based factors at the year-end average for the reporting year.
Move from a spend-based estimate to a supplier-specific product footprint?