
PCAF Data Quality Score Calculator | Cross-Asset-Class Scoring (1–5)
Aggregate per-position PCAF data quality scores into a portfolio and per-asset-class weighted average under the PCAF Standard, using the amount-weighted canonical basis (PCAF §6) with an emission-weighted comparison view.
This tool aggregates scores; it does not derive them. The nine PCAF emission calculators each derive a position’s data quality score from its inputs. This calculator sits one layer above them: it takes positions that already carry a score and rolls them up into the portfolio and per-asset-class figures PCAF requires for disclosure. Each position is entered with its asset class, the data option held, the amount, and — optionally — its attributed emissions.
The score is a property of the data option, not a number you type. A position’s score comes from which data option you actually hold for it — verified reported emissions, physical-activity data, a sector proxy, and so on. Each PCAF asset class has its own scorecard mapping data options to scores from 1 (best) to 5 (weakest). The calculator reads the score from that option, so the score is provenance-based: pick the data you hold, and the score follows.
The canonical figure is amount-weighted.
Portfolio WADQS = Σ (amounti × scorei) ÷ Σ amounti
PCAF §6 specifies the weighted-average data quality score on the canonical financial weight — the outstanding or transaction amount of each position. Each position’s score is weighted by its amount, summed, and divided by the total amount. This is the figure reported for disclosure. The calculator computes it by default and surfaces the per-asset-class breakdown alongside it, because PCAF requires data quality to be disclosed at the asset-class level, not only as a single portfolio number.
The emission-weighted view is a comparison basis, not the disclosure figure. If attributed emissions are supplied per position, the calculator also computes an emission-weighted average — each score weighted by its share of attributed tCO2e rather than by amount. This view is informative for prioritisation: it shows whether the highest-emitting positions are the worst-scored. It is not the PCAF §6 disclosure figure, and the two can diverge — a large, low-emission, well-scored book can read better on amount than on emissions, or vice versa.
Scores are not self-assigned. Across every asset class, PCAF requires the score to follow from the data option held, never to be chosen by the analyst as a free number. The calculator enforces this by reading the score from the option, and the per-position audit trail records which option produced which score.
Aggregated per class and per portfolio — not per PCAF Part. The calculator rolls up to the per-asset-class and whole-portfolio levels. It does not produce a per-Part (financed / facilitated / insurance-associated) score: although each position carries its Part tag in the export and audit trail, PCAF disclosure is at the asset-class and portfolio levels, and a per-Part data quality score is not a defined PCAF metric.
Each asset class has its own 1–5 scorecard — the score reflects the data you hold, not a number you assign.
WADQS is weight-normalised — mixing currencies across positions does not affect it.
Lower scores are better data (1 = verified reported; 5 = sector-average proxy). Disclose the WADQS per asset class and at portfolio level (PCAF §6).
Audit mode exposes the per-position scorecard provenance for verification.
Add positions above and click Calculate
A 1–5 WADQS gauge, per-asset-class scores, the score distribution, a data-improvement solver, and a full audit trail appear after calculation.
Results are indicative, intended to help score and disclose PCAF data quality. The weighted-average data quality score (WADQS) is a data-quality indicator on the 1–5 scale (1 = verified reported, 5 = sector-average proxy) — it is never a substitute for, or a validation of, your absolute financed / facilitated emissions, which must be disclosed alongside it (PCAF §6). The canonical weighting is by outstanding / transaction amount; the emissions-weighted view is a non-canonical comparison. Each position’s score is read from its own asset-class scorecard — the same data option can sit at a different score in another PCAF asset class. For regulatory and voluntary disclosure (CSRD/ESRS, TCFD, IFRS S2, SBTi-FI), verify each position’s data option against source data and disclose the WADQS at both asset-class and portfolio level.
Every PCAF emissions figure carries a second number that decides how much weight a reader should give it: the data quality score. A financed-emissions total built on verified, reported emissions means something different from the same total built on sector averages — and PCAF’s scoring system is what makes that difference visible rather than hidden inside a single tonne figure.
The score is the honesty layer of the number — and it is reported, not optional.
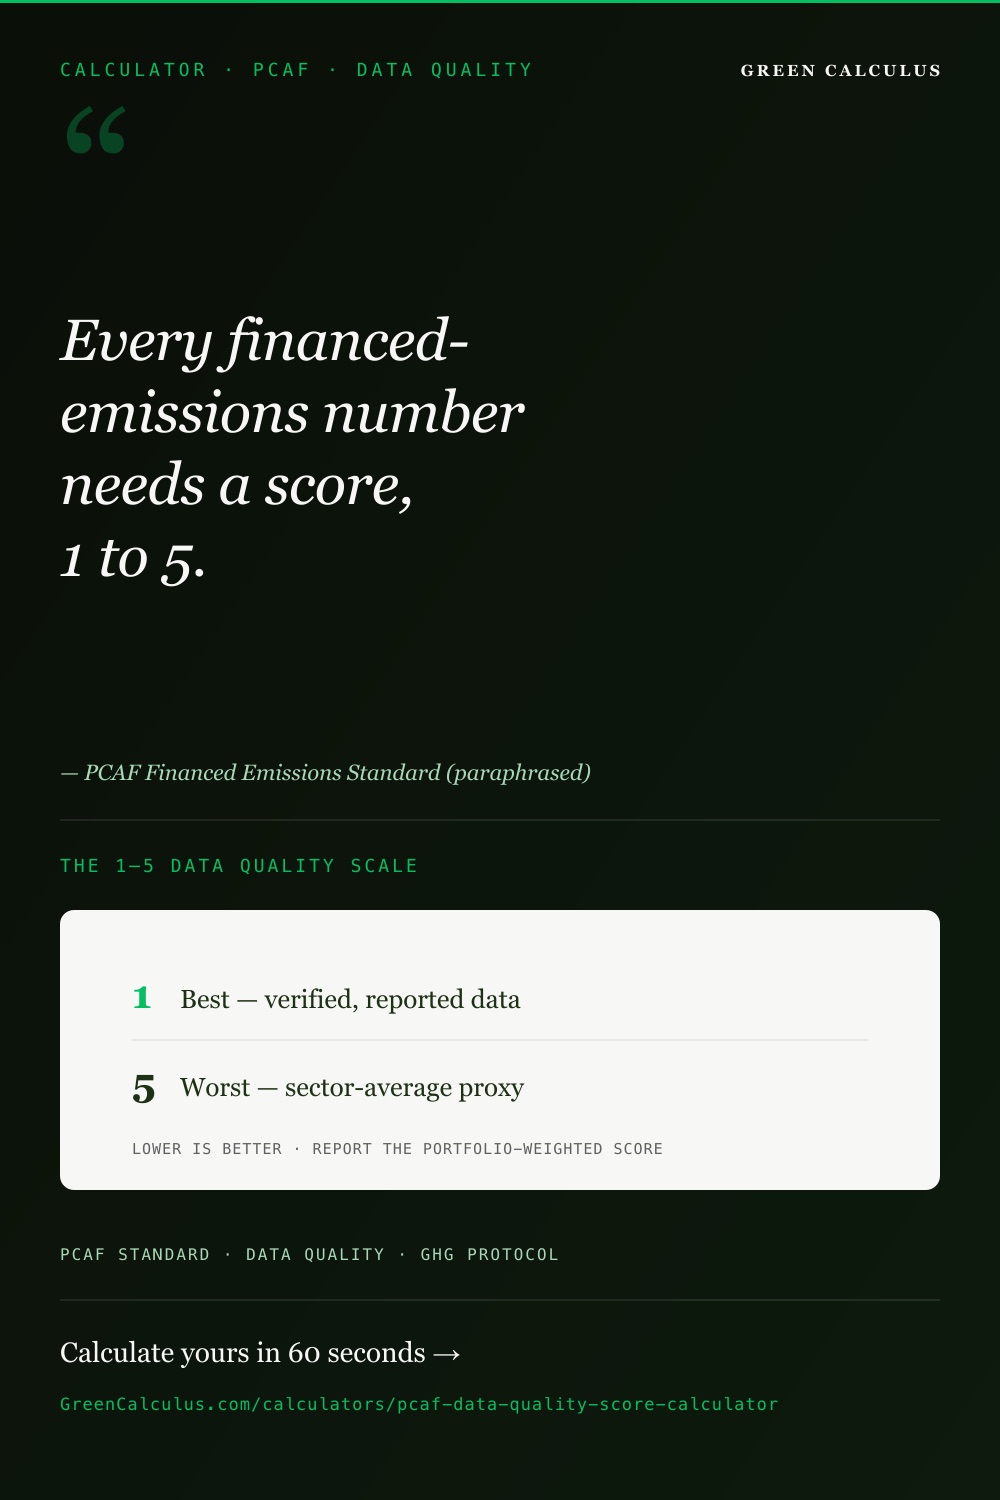
The PCAF data quality score rates each position from 1 (verified data) to 5 (sector proxy). The portfolio score is the amount-weighted average of position scores: Σ(amount × score) ÷ Σ amount, disclosed per asset class.

What the PCAF data quality score is
The PCAF data quality score is a 1-to-5 rating of how reliable the data behind an emissions figure is, where 1 is the highest quality (verified, reported emissions with known financial data) and 5 is the weakest (a sector proxy applied to limited financial information). Every position in a financed, facilitated, or insurance-associated inventory carries one, and PCAF requires the weighted-average score to be disclosed alongside the emissions total so a reader can judge how much of the number rests on measured data versus estimation.
The 1–5 scale — what each score means
The scale runs from best to weakest, and the direction matters: a lower score is better. At a high level, Score 1 means verified reported emissions with known financial data; Score 2 means reported but unverified emissions; Score 3 means an estimate built from primary physical-activity data (energy use or production); Score 4 means an estimate from economic activity (revenue times a sector emission factor); and Score 5 means the weakest proxy — a sector factor applied with the least counterparty-specific information. The precise definition of each score varies by asset class, because the data available differs between, say, a listed equity holding and a residential mortgage — but the 1-best-to-5-weakest direction is universal.
A lower PCAF score is better. Score 1 is the highest data quality; Score 5 is the weakest. This is the opposite of an intuitive “5 out of 5 is best” reading, and it is the single most common misreading of a PCAF disclosure. A portfolio moving from a weighted score of 4.2 to 3.1 is improving — it is shifting from estimated toward reported data.
Why PCAF scores data quality at all
PCAF scores data quality so that an emissions figure can be read with the right amount of confidence, and so that improvement over time is measurable. A high portfolio total built almost entirely on Score 5 sector proxies is a signal to obtain better counterparty data, not necessarily a signal that the underlying emissions are large. Conversely, a Score 1 portfolio is one where the number can be trusted and acted on. The score is a transparency mechanism, not a penalty: PCAF expects institutions to start with weaker scores and improve them as counterparty reporting matures, and the weighted score is the metric that tracks that journey.
How the score works — position to portfolio
The score operates at two levels. Each position has a score, derived from the data option held; the portfolio has a weighted-average score, computed by weighting each position’s score by its financial amount. This calculator takes positions that already carry a score and performs the roll-up.
Deriving a position’s score
A position’s score follows from which data option you hold for it — verified reported, unverified reported, physical-activity estimate, economic-activity estimate, or sector proxy. Each PCAF asset class maps its data options to scores 1–5 on its own scorecard. The score is read from the option, never typed as a free number, so it is provenance-based: the data you have determines the score.
The amount-weighted average
The portfolio score is each position’s score weighted by its amount (outstanding or transaction value), summed, and divided by the total amount. This is the PCAF §6 canonical figure. It answers: across all the capital deployed, how good is the data on average? Larger positions move the portfolio score more than smaller ones.
The per-class breakdown
PCAF requires data quality to be disclosed at the asset-class level, not only as one portfolio number. The calculator surfaces a weighted score for each asset class present in the book by default, so a reader can see whether the weak scores are concentrated in, say, the mortgage book or the business-loan book.
Portfolio WADQS = Σ (amount × score) ÷ Σ amount
Comparison basis = Σ (attributed emissions × score) ÷ Σ attributed emissions
Do not average position scores unweighted, by simply taking the mean of the 1–5 values. A small position scored 1 and a large position scored 5 do not average to 3 — the large position should dominate. PCAF §6 weights by amount, so the portfolio score reflects where the capital actually sits. An unweighted mean of the score column is a common error that understates the influence of large, poorly-scored positions.
The amount-weighted average explained
The weighting basis is the single most important mechanic in portfolio-level scoring, and the one where the canonical PCAF figure and an intuitive alternative diverge. PCAF §6 specifies the amount-weighted average; the emission-weighted average is a separate, supplementary view.
Why weight by amount
PCAF’s canonical weight is the financial amount — outstanding balance or transaction value — because the score describes the quality of the data behind the institution’s financial exposure. A position’s influence on the portfolio score scales with the capital committed to it, which is the same weight used to attribute the emissions themselves.
Why not weight by position count
Weighting every position equally regardless of size lets a tiny holding count as much as a major one, which misrepresents where the data risk sits. A book of fifty small Score-1 positions and one enormous Score-5 position is not a Score-1.1 book — the large weak position carries most of the exposure. Count-weighting hides that; amount-weighting surfaces it.
The emission-weighted comparison
Weighting by attributed emissions instead of amount answers a different question: are the highest-emitting positions the worst-scored? This is useful for prioritising which counterparties to chase for better data. But it is not the PCAF §6 disclosure figure — it is a management lens layered on top of the canonical amount-weighted number.
The amount-weighted score is the figure you disclose; the emission-weighted score is the figure you manage by. When the two diverge, the gap is informative. A book whose amount-weighted score is better than its emission-weighted score is one where the largest financial positions are better-documented than the largest emitters — so the data-improvement effort should target the high-emission, weakly-scored positions even though they are not the largest by amount. Report the amount-weighted figure; prioritise using the emission-weighted one.
The 1–5 ladder across all asset classes
The 1–5 direction is universal, but each PCAF asset class defines its own ladder because the data available differs by class. The table below maps the generic data-quality tiers onto the option each class uses, across all ten PCAF asset classes covered by the standard. It is the reference view of the whole scoring system in one place.
| Score | Generic tier | Typical data option | Direction |
|---|---|---|---|
| 1 | Verified reported | Counterparty’s reported, verified Scope 1 + 2 emissions with known financial data | Best |
| 2 | Unverified reported | Counterparty’s reported but unverified emissions (calculated per the GHG Protocol) | ↓ |
| 3 | Physical-activity estimate | Estimate from primary physical activity — energy consumption or production — with specific factors | ↓ |
| 4 | Economic-activity estimate | Estimate from economic activity — revenue × sector emission factor per unit revenue | ↓ |
| 5 | Sector proxy | Weakest proxy — sector factor per unit of asset, or revenue with a sector asset-turnover ratio | Weakest |
The same generic tier can sit at a different score number in different asset classes — the ladder is not identical across classes. Most notably, a physical-activity estimate is Score 2 in some Part A classes but Score 3 under the facilitated-emissions standard, and the insurance commercial-lines ladder has four levels where most classes have five. A score is only meaningful read against its own asset class’s ladder; see the per-class differences in the section below.
Score-improvement pathways — moving down the ladder
Because PCAF expects data quality to improve over time, the practical question is not only what a portfolio scores today but how to move it toward 1. Each step down the ladder corresponds to obtaining a better data option for a position, and the calculator’s per-position view makes the highest-impact moves visible.
Score 5 → 4 — add the counterparty’s revenue
A sector-proxy position moves to an economic-activity estimate once the counterparty’s revenue is known and a sector emission factor per unit revenue can be applied. This is often the lowest-effort first step: revenue is widely available even where emissions are not.
Score 4 → 3 — obtain physical-activity data
Replacing a revenue-based estimate with primary physical-activity data — energy consumption or production volumes — moves a position to Score 3. This requires counterparty engagement but removes the sector-average assumption from the largest source of estimation error.
Score 3 → 2 → 1 — get reported, then verified, emissions
Obtaining the counterparty’s own GHG-Protocol-calculated emissions reaches Score 2; obtaining third-party-verified emissions reaches Score 1. These steps depend on counterparty disclosure maturity and, ultimately, assurance — the same trajectory PCAF expects across the financial sector over time.
Target data-improvement effort at the positions that move the weighted score most, not the ones easiest to improve. Because the portfolio score is amount-weighted, upgrading one large Score-5 position can shift the headline more than upgrading a dozen small ones. Use the emission-weighted comparison view to find positions that are both large emitters and weakly scored — those are where better data changes both the number and its credibility most.
Scope coverage and avoiding double-counting
A data quality score describes the quality of the data behind whatever emissions are in scope — so the score must be read together with what the inventory actually covers. Two positions can both score 1 while covering different scopes of the counterparty’s emissions, and a portfolio score says nothing about coverage on its own.
PCAF requires the scope coverage of each position to be disclosed alongside its score: which of the counterparty’s Scope 1, 2, and 3 emissions are included. A Score 1 built on verified Scope 1 + 2 only is high-quality data on a partial boundary; the score does not flag the missing Scope 3. Separately, the standard requires that the same emissions are not attributed twice — a counterparty appearing in more than one asset class, or in more than one PCAF Part, must not have its emissions double-counted across the lines, even though each line is scored independently.
A strong data quality score does not mean complete scope coverage. A portfolio can be weighted toward Score 1 and still omit material Scope 3 emissions from its counterparties, because the score rates the quality of the data on the emissions in scope, not the completeness of the scope boundary. Disclose scope coverage alongside the score, and never let a good score stand in for a complete one.
Inputs this calculator needs — and where to source them
This calculator aggregates positions that have already been classified and scored — typically the outputs of the nine PCAF emission calculators. Each position carries four inputs, only three of which are required.
| Input | Required? | What it is | Primary source |
|---|---|---|---|
| Asset class | Required | One of the ten PCAF asset classes — determines which scorecard the data option maps against | The position’s PCAF classification |
| Data option → score | Required | The data option held (verified reported, physical activity, sector proxy, etc.); the score is read from the class scorecard | The per-position output of the relevant PCAF emission calculator |
| Amount | Required | Outstanding or transaction amount — the canonical PCAF §6 weight | Loan/holding/transaction records |
| Attributed emissions (tCO2e) | Optional | Unlocks the emission-weighted comparison basis only — not needed for the canonical figure | The per-position output of the relevant PCAF emission calculator |
Supply attributed emissions even though they are optional. The canonical amount-weighted score needs only the amount, but without the emissions column the calculator cannot show the emission-weighted comparison — and that comparison is what reveals whether the largest emitters are the worst-scored. The marginal effort of carrying the tCO2e each emission calculator already produced unlocks the prioritisation view for free.
The result components — portfolio score and per-class breakdown
The calculator reports in two components. The metric strip answers how good the portfolio’s data is overall; the per-class panel answers where the weak data sits — the asset-class-level disclosure PCAF requires.
Component one — the metric strip
| Metric | Units | What it answers | Disclosure framework |
|---|---|---|---|
| Portfolio WADQS (amount-weighted) | Score (1 = best) | The canonical weighted-average data quality across all capital deployed. | PCAF §6 (mandatory disclosure) |
| Comparison WADQS (emission-weighted) | Score (1 = best) | The same average weighted by attributed emissions — for prioritisation, not disclosure. | PCAF supplementary / management view |
| Estimate-grade share | % (by amount and by emissions) | The proportion of the book on Score 4 or 5 — the estimated, non-reported portion. | PCAF context metric |
| Score distribution by weight | % per score band | How the book splits across scores 1–5, weighted by amount. | PCAF context metric |
Component two — the per-asset-class panel
The per-class panel holds the asset-class-level disclosure PCAF requires:
- Per-class WADQS — the amount-weighted score for each asset class present in the book, computed on that class’s positions only.
- Class share of book — each class’s share of the total amount, so a reader can see whether a weak class score sits on a large or small slice.
- Estimate-grade by class — the Score 4–5 share within each class, locating the estimation concentration.
The portfolio score and the per-class scores answer different questions and must be read together. A portfolio score of 3.2 can hide a Score-1 listed-equity book sitting alongside a Score-5 facilitated position — the average conceals the spread. PCAF requires the class-level disclosure precisely so the average cannot mask a concentration of weak data in one class. Read the headline, then read where it comes from.
Worked example — a mixed multi-asset-class book
This example is computed against the engine’s exact compute path; the outputs reproduce verbatim. The book holds four positions across three asset classes and two PCAF Parts, reported in USD millions, with attributed emissions in tCO2e.
Inputs and per-position scores
| # | Position | Asset class | Part | Data option → score | Amount ($M) | Attr. tCO2e |
|---|---|---|---|---|---|---|
| 1 | Acme plc | Listed equity & corp bonds | A | Verified reported → 1 | 50 | 2,000 |
| 2 | Beta GmbH | Business loans & unlisted equity | A | Physical activity → 3 | 30 | 8,000 |
| 3 | Gamma residential | Mortgages | A | Estimated → 4 | 100 | 1,500 |
| 4 | Delta Corp | Facilitated (capital markets) | B | Sector proxy → 5 | 20 | 5,000 |
| Book total | 200 | 16,500 | ||||
The amount-weighted WADQS is (50×1 + 30×3 + 100×4 + 20×5) ÷ 200 = 640 ÷ 200 = 3.20 — the PCAF §6 disclosure figure. The emission-weighted comparison is (2,000×1 + 8,000×3 + 1,500×4 + 5,000×5) ÷ 16,500 = 57,000 ÷ 16,500 = 3.45. Each asset class holds a single position here, so the per-class scores are exactly those positions’ scores: listed equity 1.00, business loans 3.00, mortgages 4.00, facilitated 5.00.
Component one — the metric strip
Score distribution by weight (amount basis)
Component two — the per-asset-class panel
Reading the results — why the two bases diverge
The lesson is in the gap between 3.20 amount-weighted and 3.45 emission-weighted. The mortgage pool dominates by amount — $100M of the $200M book, at Score 4 — but it is low-emission, contributing only 1,500 of the 16,500 attributed tCO2e. The high-emission positions are the business loan (8,000 tCO2e at Score 3) and the facilitated deal (5,000 tCO2e at Score 5), which together carry most of the carbon at weaker scores. So when the average is re-weighted from amount to emissions, it gets worse: the carbon is concentrated in the worse-scored positions.
The disclosure implication is direct. PCAF §6 reports the amount-weighted 3.20. But the emission-weighted 3.45 is the management signal: it says the data-improvement effort should target the business loan and the facilitated deal — the high-emission, weakly-scored positions — even though the mortgage book is far larger by amount. Reporting the amount-weighted figure and prioritising by the emission-weighted one is exactly how the two views are meant to be used together.
How data quality scoring differs by asset class
The 1–5 direction is shared, but the ladders are not identical across the ten PCAF asset classes. Reading a score correctly means reading it against its own class’s ladder — a point the calculator preserves by scoring each position on its class scorecard rather than a single shared scale.
| Asset class | PCAF Part | Ladder note |
|---|---|---|
| Listed equity & corporate bonds | A | Five levels; EVIC denominator. Physical-activity estimate at Score 2. |
| Business loans & unlisted equity | A | Five levels; book-value denominator. |
| Project finance | A | Five levels; project-capitalisation denominator. |
| Commercial real estate | A | Five levels; property-value attribution, building-energy-based estimates. |
| Mortgages | A | Five levels; loan-to-value attribution, building-energy benchmarks. |
| Motor vehicle loans | A | Five levels; distance-based estimation. |
| Sovereign debt | A | Five levels; PPP-GDP attribution. |
| Facilitated emissions | B | Five levels; both physical-activity sub-options sit at Score 3, not Score 2 as in listed equity. |
| Insurance — personal motor | C | Five levels; industry-factor attribution. |
| Insurance — commercial lines | C | Four levels — the only class with a four-level ladder; premium-over-revenue attribution. |
Two ladder quirks matter most when reading cross-class scores. First, the insurance commercial-lines ladder has four levels, not five — a commercial-lines Score 4 is the weakest available, equivalent in position to a Score 5 elsewhere. Second, a physical-activity estimate scores 2 in listed equity but 3 under the facilitated-emissions standard. A weighted portfolio score blends these correctly because each position is scored on its own ladder, but a reader comparing raw score numbers across classes must remember the ladders differ.
Reporting context — PCAF, GHG Protocol, IFRS S2, CSRD, NGFS
The data quality score is not only a PCAF internal metric — it is increasingly expected in financial-sector disclosure, because regulators and standard-setters want to know how much of a reported financed-emissions figure rests on estimation. The frameworks below set the context.
| Framework | Role for the data quality score | Mandate scope |
|---|---|---|
| PCAF Standard (Part A — Financed) | The methodology home of the score. Defines the 1–5 ladders, the amount-weighted average (§6), and the asset-class-level disclosure requirement; the score is reused across Parts B and C. | Voluntary methodology; the financial-sector reference |
| PCAF Facilitated (Part B) & Insurance-Associated (Part C) | Each reuses the data quality scoring framework on its own ladder, scored and disclosed separately from financed emissions. | Voluntary; capital markets and underwriting |
| GHG Protocol Scope 3 Standard | The accounting standard PCAF cross-references; the data quality principle echoes the GHG Protocol’s emphasis on data-quality assessment for value-chain emissions. | Voluntary accounting standard; referenced by most regimes |
| IFRS S2 (ISSB) | The global disclosure baseline. Requires disclosure of the methodologies and data quality behind financed-emissions metrics where reported. | Mandatory in jurisdictions that have adopted IFRS S2 |
| CSRD ESRS E1 (EU) | The EU sustainability-reporting mandate. ESRS E1 expects disclosure of measurement uncertainty and methodology for Scope 3 financed emissions, with a methodology pointer to PCAF. | Large EU and EU-operating companies, phased |
| NGFS / financial supervision | The supervisory layer. Supervisors treat the data quality of financed-emissions estimates as central to the reliability of climate-risk disclosures. | Supervised institutions, by jurisdiction |
Once the inventory and its data quality are established, target setting follows. The SBTi Corporate Net-Zero Standard framework takes the PCAF baseline as an input; the SBTi Near-Term Target Calculator consumes the financed-emissions baseline, whose credibility the data quality score is what quantifies.
Audit checklist — what gets flagged in PCAF assurance
Assurance over a data quality disclosure traces each position’s score to the data option that produced it, and the weighted average to its weighting basis. The findings below are the issues reviewers raise most often on the scoring layer specifically.
01 — Self-assigned scores
A score typed by the analyst rather than read from the data option held fails the trace. Confirm each position’s score follows from its documented data option on the correct asset-class scorecard.
02 — Unweighted or wrongly-weighted average
A simple mean of the score column, or a count-weighted average, is not the PCAF §6 figure. Confirm the portfolio score is amount-weighted, and that the emission-weighted figure (if shown) is labelled as a comparison view.
03 — Cross-class score comparison
Reading a four-level insurance commercial-lines score as equivalent to a five-level score elsewhere, or treating a facilitated Score 3 physical estimate as a Score 2, misreads the ladders. Confirm scores are interpreted against their own class ladders.
04 — Missing asset-class-level disclosure
Reporting only the single portfolio score hides where the weak data concentrates. Confirm the per-asset-class weighted scores are disclosed alongside the portfolio figure, as PCAF requires.
05 — Good score read as complete coverage
A strong score on a partial scope boundary (e.g. Scope 1 + 2 only) can be mistaken for a complete inventory. Confirm scope coverage is disclosed alongside the score and not implied by it.
06 — Double-counting across classes or Parts
A counterparty appearing in more than one asset class or Part can have its emissions attributed twice. Confirm the boundary prevents double-counting, even though each line is scored independently.
Data sources, boundaries, and update transparency
The scoring rules — read from the MasterBrain
The per-asset-class data quality scorecards (PCAF Standard, the 1–5 ladders for each of the ten classes) are held in the MasterBrain and read by the engine at compute time, so a position’s score is always derived against the current PCAF scoring rules rather than a hand-typed value. The amount-weighted average is the PCAF §6 canonical rule — a qualitative weighting rule, applied by the engine to whatever positions are entered, not a stored constant.
This calculator does not derive scores from emissions
Unlike the nine PCAF emission calculators, this tool does not compute attributed emissions or derive a position’s score from raw activity data. It takes positions that already carry a score — the per-position outputs of those calculators — and performs the weighted roll-up. The score comes from the data option held; the amount drives the canonical weighting; the optional attributed emissions unlock the comparison basis.
MasterBrain versioning
The scoring rules are read from the MasterBrain (v2025.59), which stamps each result with the version against which it was computed, so portfolios scored against different vintages are distinguishable in restatement work. PCAF Standard versioning is independent of the underlying scoring data — the methodology applies until a new PCAF edition ships.
The PCAF calculator suite — score every asset class
This calculator is the scoring hub for the PCAF cluster: each asset-class calculator derives a position’s score, and this tool rolls the scored positions up into the portfolio and per-class disclosure figures. The nine emission calculators below each feed it.
Part A — Financed
Listed Equity & Corporate Bonds
§5.1. EVIC denominator.
Part A — Financed
Business Loans & Unlisted Equity
§5.2. Book-value denominator.
Part A — Financed
Project Finance
§5.3. Project-capitalisation denominator.
Part A — Financed
Commercial Real Estate
§5.4. Property-value attribution.
Part A — Financed
Mortgages
§5.5. Loan-to-value attribution.
Part A — Financed
Motor Vehicle Loans
§5.6. Distance-based attribution.
Part A — Financed
Sovereign Debt
§5.7. PPP-GDP attribution.
Part B — Facilitated
Facilitated Emissions
Capital markets. 33% weighting.
Part C — Insurance
Insurance-Associated Emissions
Underwriting. Premium and industry-factor attribution.
The full methodological deep-dive on the data quality scoring framework — the ten asset-class ladders, the amount-weighted average, the emission-weighted comparison, scope coverage, and double-counting controls — is published on the paired PCAF data quality score methodology page.
Frequently asked questions
It is a 1-to-5 rating of how reliable the data behind a PCAF emissions figure is, where 1 is the highest quality (verified, reported emissions with known financial data) and 5 is the weakest (a sector proxy). Every position in a financed, facilitated, or insurance-associated inventory carries one, and PCAF requires the weighted-average score to be disclosed alongside the emissions total so a reader can judge how much of the figure rests on measured data versus estimation. A lower score is better.
Lower is better. Score 1 is the highest data quality — verified, reported emissions — and Score 5 is the weakest, a sector proxy applied with the least counterparty-specific information. This is the opposite of an intuitive “5 out of 5 is best” reading and is the most common misinterpretation of a PCAF disclosure. A portfolio moving from a weighted score of 4.2 to 3.1 is improving, shifting from estimated toward reported data.
It is the amount-weighted average of the position scores: each position’s score is multiplied by its amount (outstanding or transaction value), the products are summed, and the total is divided by the total amount — Σ(amount × score) ÷ Σ amount. This is the PCAF §6 canonical figure. In the worked example, (50×1 + 30×3 + 100×4 + 20×5) ÷ 200 = 640 ÷ 200 = 3.20. PCAF also requires this to be disclosed at the asset-class level, not only as one portfolio number.
The amount-weighted score weights each position’s score by its financial amount and is the PCAF §6 disclosure figure. The emission-weighted score weights by attributed emissions instead and is a supplementary comparison view for prioritisation — it shows whether the highest-emitting positions are the worst-scored. The two can diverge: in the worked example the amount-weighted figure is 3.20 but the emission-weighted is 3.45, because the high-emission positions carry weaker scores. Report the amount-weighted figure; prioritise data improvement using the emission-weighted one.
No. This calculator aggregates scores; it does not derive them. The nine PCAF emission calculators each compute a position’s attributed emissions and derive its data quality score from the inputs. This tool sits one layer above them: it takes positions that already carry a score — with their asset class, amount, and optional attributed emissions — and rolls them up into the portfolio and per-asset-class figures PCAF requires. If you need to compute a position’s emissions and score in the first place, use the relevant asset-class calculator.
By obtaining better data options for the positions that move the weighted score most. Each step down the ladder corresponds to a better data option: a sector-proxy position (Score 5) improves to an economic-activity estimate (Score 4) once revenue is known; to a physical-activity estimate (Score 3) with energy or production data; to unverified reported emissions (Score 2); and to verified reported emissions (Score 1). Because the portfolio score is amount-weighted, upgrading one large weak position can shift the headline more than upgrading several small ones — and the emission-weighted view identifies the high-emission, weakly-scored positions worth targeting first.
Because PCAF requires the score to follow from the data actually held, never to be chosen as a free number by the analyst. Each asset class maps its data options — verified reported, physical activity, sector proxy, and so on — to scores 1–5 on its own scorecard. The calculator reads the score from the option you select, so the score is provenance-based and the audit trail records which option produced which score. A self-assigned score is a standard assurance finding.
No. The calculator aggregates to the per-asset-class and whole-portfolio levels only. Each position carries its PCAF Part tag in the export and audit trail, but a per-Part data quality score is not a defined PCAF metric — PCAF disclosure is at the asset-class and portfolio levels. Financed, facilitated, and insurance-associated emissions are reported on separate lines, each with its own asset-class-level scores, rather than rolled into a single per-Part score.
Because the data available differs by class, PCAF defines each asset class’s ladder separately. The 1-best-to-5-weakest direction is universal, but the specifics vary: a physical-activity estimate scores 2 in listed equity but 3 under the facilitated-emissions standard, and the insurance commercial-lines ladder has four levels where most classes have five. A weighted portfolio score blends them correctly because each position is scored on its own ladder, but a reader comparing raw score numbers across classes must remember the ladders are not identical.
No. The score rates the quality of the data on the emissions in scope, not the completeness of the scope boundary. A portfolio can be weighted toward Score 1 and still omit material Scope 3 emissions from its counterparties, because a Score 1 built on verified Scope 1 + 2 only is high-quality data on a partial boundary. PCAF requires scope coverage to be disclosed alongside the score; a good score should never be read as standing in for a complete one.
Methodology notes and limitations
Methodology version. Calculator implements the PCAF Standard data quality scoring framework: the per-asset-class 1–5 ladders, the amount-weighted average (§6), and the asset-class-level disclosure requirement, with an emission-weighted comparison basis. Inventories computed under a future PCAF edition should be re-run and the version transition documented.
This is an aggregation tool, not a derivation tool. The calculator takes pre-classified, pre-scored positions and rolls them up. It does not compute attributed emissions or derive a position’s score from raw activity data — that is the role of the nine PCAF asset-class emission calculators, whose per-position outputs feed this tool.
Scores are provenance-based. Each position’s score is read from the data option held, on the relevant asset class’s scorecard, never typed as a free number. The per-position audit trail records the option and the score it produced.
The canonical figure is amount-weighted. The portfolio and per-class scores are weighted by the financial amount (outstanding or transaction value), per PCAF §6. The emission-weighted figure is a supplementary comparison view for prioritisation and is not the disclosure figure; it is computed only when attributed emissions are supplied per position.
No per-Part roll-up. The calculator aggregates to the asset-class and portfolio levels only. Each position carries its PCAF Part tag in the export and audit, but a per-Part data quality score is not produced, because it is not a defined PCAF metric.
Ladders differ by class. The ten asset-class ladders share the 1-best-to-5-weakest direction but are not identical — notably the four-level insurance commercial-lines ladder and the facilitated-emissions placement of physical-activity estimates at Score 3. Each position is scored on its own ladder; raw score numbers are not directly comparable across classes.
Scope coverage is separate from the score. The score rates data quality on the emissions in scope, not the completeness of the scope boundary. Scope coverage must be disclosed alongside the score and is not implied by it.
Double-counting is the analyst’s responsibility. Each line is scored independently. Where a counterparty appears in more than one asset class or Part, ensuring its emissions are not attributed twice in a combined view is set by the reporting boundary, not by this calculator.
No FX conversion. Amounts and attributed emissions must use consistent units across positions. The calculator does not perform FX conversion; convert amounts to a single reporting currency before entry and document the FX rate and date.
No assurance opinion. Results are estimates and do not constitute a PCAF assurance opinion. They should be reviewed by a qualified practitioner before use in regulatory submissions, IFRS S2 disclosures, CSRD ESRS E1 datapoints, or supervisory reporting. For an assurance-grade output, the per-position audit trail (asset class, PCAF Part, data option and the score it produced, amount, attributed emissions) should be exported and reconciled against the source asset-class calculators position by position. The full methodological deep-dive is on the paired PCAF data quality score methodology page.